
5.1: Financial Statements
- Page ID
- 79774

\( \newcommand{\vecs}[1]{\overset { \scriptstyle \rightharpoonup} {\mathbf{#1}} } \)
\( \newcommand{\vecd}[1]{\overset{-\!-\!\rightharpoonup}{\vphantom{a}\smash {#1}}} \)
\( \newcommand{\id}{\mathrm{id}}\) \( \newcommand{\Span}{\mathrm{span}}\)
( \newcommand{\kernel}{\mathrm{null}\,}\) \( \newcommand{\range}{\mathrm{range}\,}\)
\( \newcommand{\RealPart}{\mathrm{Re}}\) \( \newcommand{\ImaginaryPart}{\mathrm{Im}}\)
\( \newcommand{\Argument}{\mathrm{Arg}}\) \( \newcommand{\norm}[1]{\| #1 \|}\)
\( \newcommand{\inner}[2]{\langle #1, #2 \rangle}\)
\( \newcommand{\Span}{\mathrm{span}}\)
\( \newcommand{\id}{\mathrm{id}}\)
\( \newcommand{\Span}{\mathrm{span}}\)
\( \newcommand{\kernel}{\mathrm{null}\,}\)
\( \newcommand{\range}{\mathrm{range}\,}\)
\( \newcommand{\RealPart}{\mathrm{Re}}\)
\( \newcommand{\ImaginaryPart}{\mathrm{Im}}\)
\( \newcommand{\Argument}{\mathrm{Arg}}\)
\( \newcommand{\norm}[1]{\| #1 \|}\)
\( \newcommand{\inner}[2]{\langle #1, #2 \rangle}\)
\( \newcommand{\Span}{\mathrm{span}}\) \( \newcommand{\AA}{\unicode[.8,0]{x212B}}\)
\( \newcommand{\vectorA}[1]{\vec{#1}} % arrow\)
\( \newcommand{\vectorAt}[1]{\vec{\text{#1}}} % arrow\)
\( \newcommand{\vectorB}[1]{\overset { \scriptstyle \rightharpoonup} {\mathbf{#1}} } \)
\( \newcommand{\vectorC}[1]{\textbf{#1}} \)
\( \newcommand{\vectorD}[1]{\overrightarrow{#1}} \)
\( \newcommand{\vectorDt}[1]{\overrightarrow{\text{#1}}} \)
\( \newcommand{\vectE}[1]{\overset{-\!-\!\rightharpoonup}{\vphantom{a}\smash{\mathbf {#1}}}} \)
\( \newcommand{\vecs}[1]{\overset { \scriptstyle \rightharpoonup} {\mathbf{#1}} } \)
\( \newcommand{\vecd}[1]{\overset{-\!-\!\rightharpoonup}{\vphantom{a}\smash {#1}}} \)
\(\newcommand{\avec}{\mathbf a}\) \(\newcommand{\bvec}{\mathbf b}\) \(\newcommand{\cvec}{\mathbf c}\) \(\newcommand{\dvec}{\mathbf d}\) \(\newcommand{\dtil}{\widetilde{\mathbf d}}\) \(\newcommand{\evec}{\mathbf e}\) \(\newcommand{\fvec}{\mathbf f}\) \(\newcommand{\nvec}{\mathbf n}\) \(\newcommand{\pvec}{\mathbf p}\) \(\newcommand{\qvec}{\mathbf q}\) \(\newcommand{\svec}{\mathbf s}\) \(\newcommand{\tvec}{\mathbf t}\) \(\newcommand{\uvec}{\mathbf u}\) \(\newcommand{\vvec}{\mathbf v}\) \(\newcommand{\wvec}{\mathbf w}\) \(\newcommand{\xvec}{\mathbf x}\) \(\newcommand{\yvec}{\mathbf y}\) \(\newcommand{\zvec}{\mathbf z}\) \(\newcommand{\rvec}{\mathbf r}\) \(\newcommand{\mvec}{\mathbf m}\) \(\newcommand{\zerovec}{\mathbf 0}\) \(\newcommand{\onevec}{\mathbf 1}\) \(\newcommand{\real}{\mathbb R}\) \(\newcommand{\twovec}[2]{\left[\begin{array}{r}#1 \\ #2 \end{array}\right]}\) \(\newcommand{\ctwovec}[2]{\left[\begin{array}{c}#1 \\ #2 \end{array}\right]}\) \(\newcommand{\threevec}[3]{\left[\begin{array}{r}#1 \\ #2 \\ #3 \end{array}\right]}\) \(\newcommand{\cthreevec}[3]{\left[\begin{array}{c}#1 \\ #2 \\ #3 \end{array}\right]}\) \(\newcommand{\fourvec}[4]{\left[\begin{array}{r}#1 \\ #2 \\ #3 \\ #4 \end{array}\right]}\) \(\newcommand{\cfourvec}[4]{\left[\begin{array}{c}#1 \\ #2 \\ #3 \\ #4 \end{array}\right]}\) \(\newcommand{\fivevec}[5]{\left[\begin{array}{r}#1 \\ #2 \\ #3 \\ #4 \\ #5 \\ \end{array}\right]}\) \(\newcommand{\cfivevec}[5]{\left[\begin{array}{c}#1 \\ #2 \\ #3 \\ #4 \\ #5 \\ \end{array}\right]}\) \(\newcommand{\mattwo}[4]{\left[\begin{array}{rr}#1 \amp #2 \\ #3 \amp #4 \\ \end{array}\right]}\) \(\newcommand{\laspan}[1]{\text{Span}\{#1\}}\) \(\newcommand{\bcal}{\cal B}\) \(\newcommand{\ccal}{\cal C}\) \(\newcommand{\scal}{\cal S}\) \(\newcommand{\wcal}{\cal W}\) \(\newcommand{\ecal}{\cal E}\) \(\newcommand{\coords}[2]{\left\{#1\right\}_{#2}}\) \(\newcommand{\gray}[1]{\color{gray}{#1}}\) \(\newcommand{\lgray}[1]{\color{lightgray}{#1}}\) \(\newcommand{\rank}{\operatorname{rank}}\) \(\newcommand{\row}{\text{Row}}\) \(\newcommand{\col}{\text{Col}}\) \(\renewcommand{\row}{\text{Row}}\) \(\newcommand{\nul}{\text{Nul}}\) \(\newcommand{\var}{\text{Var}}\) \(\newcommand{\corr}{\text{corr}}\) \(\newcommand{\len}[1]{\left|#1\right|}\) \(\newcommand{\bbar}{\overline{\bvec}}\) \(\newcommand{\bhat}{\widehat{\bvec}}\) \(\newcommand{\bperp}{\bvec^\perp}\) \(\newcommand{\xhat}{\widehat{\xvec}}\) \(\newcommand{\vhat}{\widehat{\vvec}}\) \(\newcommand{\uhat}{\widehat{\uvec}}\) \(\newcommand{\what}{\widehat{\wvec}}\) \(\newcommand{\Sighat}{\widehat{\Sigma}}\) \(\newcommand{\lt}{<}\) \(\newcommand{\gt}{>}\) \(\newcommand{\amp}{&}\) \(\definecolor{fillinmathshade}{gray}{0.9}\)Financial Statements come from the world of Accounting, which has established so-called Generally Accepted Accounting Principles (GAAP) to guide their actions. The financial statements are created using GAAP techniques to communicate to the world the financial situation and financial performance of a company. Fortunately, we investors don’t have to perform any of the accounting. We rely on the accountants to create the financial statements for us. However, the more we know and understand Accounting, the better we will be able to understand and analyze the companies we are researching using the financial statements and other reported financial data.
Recall from our Introduction to Stocks discussion that once a company “goes public,” it is now a public entity and as such, has certain responsibilities and obligations that private companies do not have to concern themselves with. One of the most important obligations is publishing the financial statements every quarter. Accounting firms pride themselves in following the rules and there is rarely ever any controversy with regard to the financial statements of most all bona fide companies and their Accounting firms.
However, this is not always the case. From time to time, you will hear in the news that a company must “restate their earnings” or “refile their financial statements.” Something somewhere went wrong. Given the complexity of large, multinational corporations, it is only a matter of time before some unintentional errors will snake their way into the numbers. However, there are times when the corporations and the accountants aren’t always on the up and up. In fact, some corporations, in collusion with their accounting firms, have used gimmickry and trickery and downright fraud to “cook the books.” One of the most egregious examples of this was the case of Enron, formerly Houston Natural Gas.
Enron Corporation was an American energy, commodities, and services company. At the time, the bankruptcy of Enron was the largest bankruptcy in recorded history. The company, with the help of their accounting firm, was engaging in accounting fraud. Their accounting firm, Arthur Anderson dissolved as a result of their association with the fraud and their confessed accounting sleight-of-hand and trickery. When the scandal hit, the corporate executives at Enron claimed ignorance. “We didn’t know that there was any accounting hanky-panky going on!” The executives were subsequently called to Congress to testify. One of those executives was Jeffrey Skilling, the former CEO of Enron, who had previously bragged about creating value out of thin air when Enron was flying high. He was now feigning ignorance about the whole misadventure, under oath and in front of Congress. There was one exchange with Senator Barbara Boxer from California about one of the more egregious accounting maneuvers Enron had used. Mr. Skilling firmly proclaimed that he was totally unaware that the maneuver was illegal. Senator Boxer asked, “Where did you go to school?” Mr. Skilling replied flatly, “Harvard Business School.” Those in attendance burst out laughing.
As a result of Enron and other scandals of the time, including WorldCom, Tyco, HealthSouth, and Global Crossing, the United States Congress passed the Sarbanes-Oxley Act of 2002. Under this law, corporate executives can be held responsible for the published financial statements of their accounting firms.
Now you understand why we love to say that, “Dividends don’t lie.” All the numbers on the following three financial statements could be, and on rare occasions are, completely made up, picked directly out of thin air, stupid wild fantasy guesses. All, except one. And that is the dividend. We know the dividend number is not a lie because the company wrote us a check. (Well, not exactly. The money is deposited electronically into our brokerage account. But you get the idea.) Even so, financial statement manipulation, accounting gimmickry and trickery, and outright fraud have always been with us. They will always be with us. That is also why we recommend large companies with their roots deep in the economy and long histories and earnings and dividends as the bulk of your investment portfolio.
Disclaimer: Speaking of accounting gimmickry and trickery, the following financial statements for Sprouts Family Market (symbol SFM) have been modified somewhat from various sources for educational purposes. It is typical for various sources to present financial statements in slightly different manners. The most reliable source is the company’s annual and quarterly submissions to the Security and Exchange Commission.
The Balance Sheet
The Balance Sheet is a snapshot in time of a company’s assets and debts. What assets does the corporation own? How much debt has the corporation incurred and will have to pay back with interest? The accountants enumerate the assets of the corporation and then compute the total value of the assets. They do the same for the debts, also known as liabilities. They then make a simple calculation to compute what is left over after the debts are subtracted from the assets. The result is called Stockholders’ Equity. This is how much of the corporation is owned by the shareholders.
Stockholders’ Equity = Total Assets - Totals Debts
The accountants will sometimes simplify and rearrange the formula thusly:
Asset - Liabilities = Equity
In our BUS-121, Financial Planning and Money Management, class, at Southwestern, we cover a very simplified version of the Balance Sheet. We call it our Net Worth Statement in personal financial planning. Similar to the accountants’ Stockholders’ Equity, we compute our Net Worth by subtracting our debts from our assets. The procedures involved in creating a Balance Sheet using Generally Accepted Accounting Principles are vastly more complicated than how we create a personal Net Worth Statement. Also, the numbers are a whole lot bigger. However, the idea is exactly the same. How much do we own? How much do we owe? What is left over? That is our equity, our ownership, our net worth.
There is one major difference between a Balance Sheet and Net Worth Statement that should be noted. When we assess the value of an asset in our personal Net Worth Statement, we use the Fair Market Value of the asset. Usually, the Fair Market Value is easy to find. How much is a 2015 Toyota Corolla worth? Consult any of a number of industry publications such as Kelly Blue Book or Edmunds or just take a look at Craigslist to see what people are asking for them. Assessing the Fair Market Value of other items is much more difficult for some assets such as furniture or baseball card collections. Often, individuals have an overly optimistic idea of the value. It is only when they endeavor to sell the items that the current Fair Market Value can be ascertained.
The values of assets on the Balance Sheet of corporations are assessed in a totally different manner. Accountants use a procedure called Depreciation. The value of the assets are reduced using any one of many depreciation methods until finally the value of the asset is reduced to zero or a predetermined Salvage Value. The current value of an asset as it is being depreciated is called the Book Value. This is the value of the asset “on the books,” the accountants’ records. The Book Value may or may not have any relation to the actual Fair Market Value of the asset. In other words, just because the Balance Sheet says that a particular asset is worth a certain amount does not mean that the asset would demand that price if it were sold. More likely, the value in the marketplace is very different from the Balance Sheet. This is yet another reason why we must be wary when we utilize and interpret the numbers we find on the Balance Sheet.
Another difference to take note of is the time frame of assets. In accounting, any asset that will be utilized within one year is called a Current Asset. All other assets are considered Long-Term Assets. This is very different to how we in finance and investments category assets with our short-term, intermediate-term, and long-term time frames.
Below is the Balance Sheet for Sprouts Family Market as of December 31, 2022.
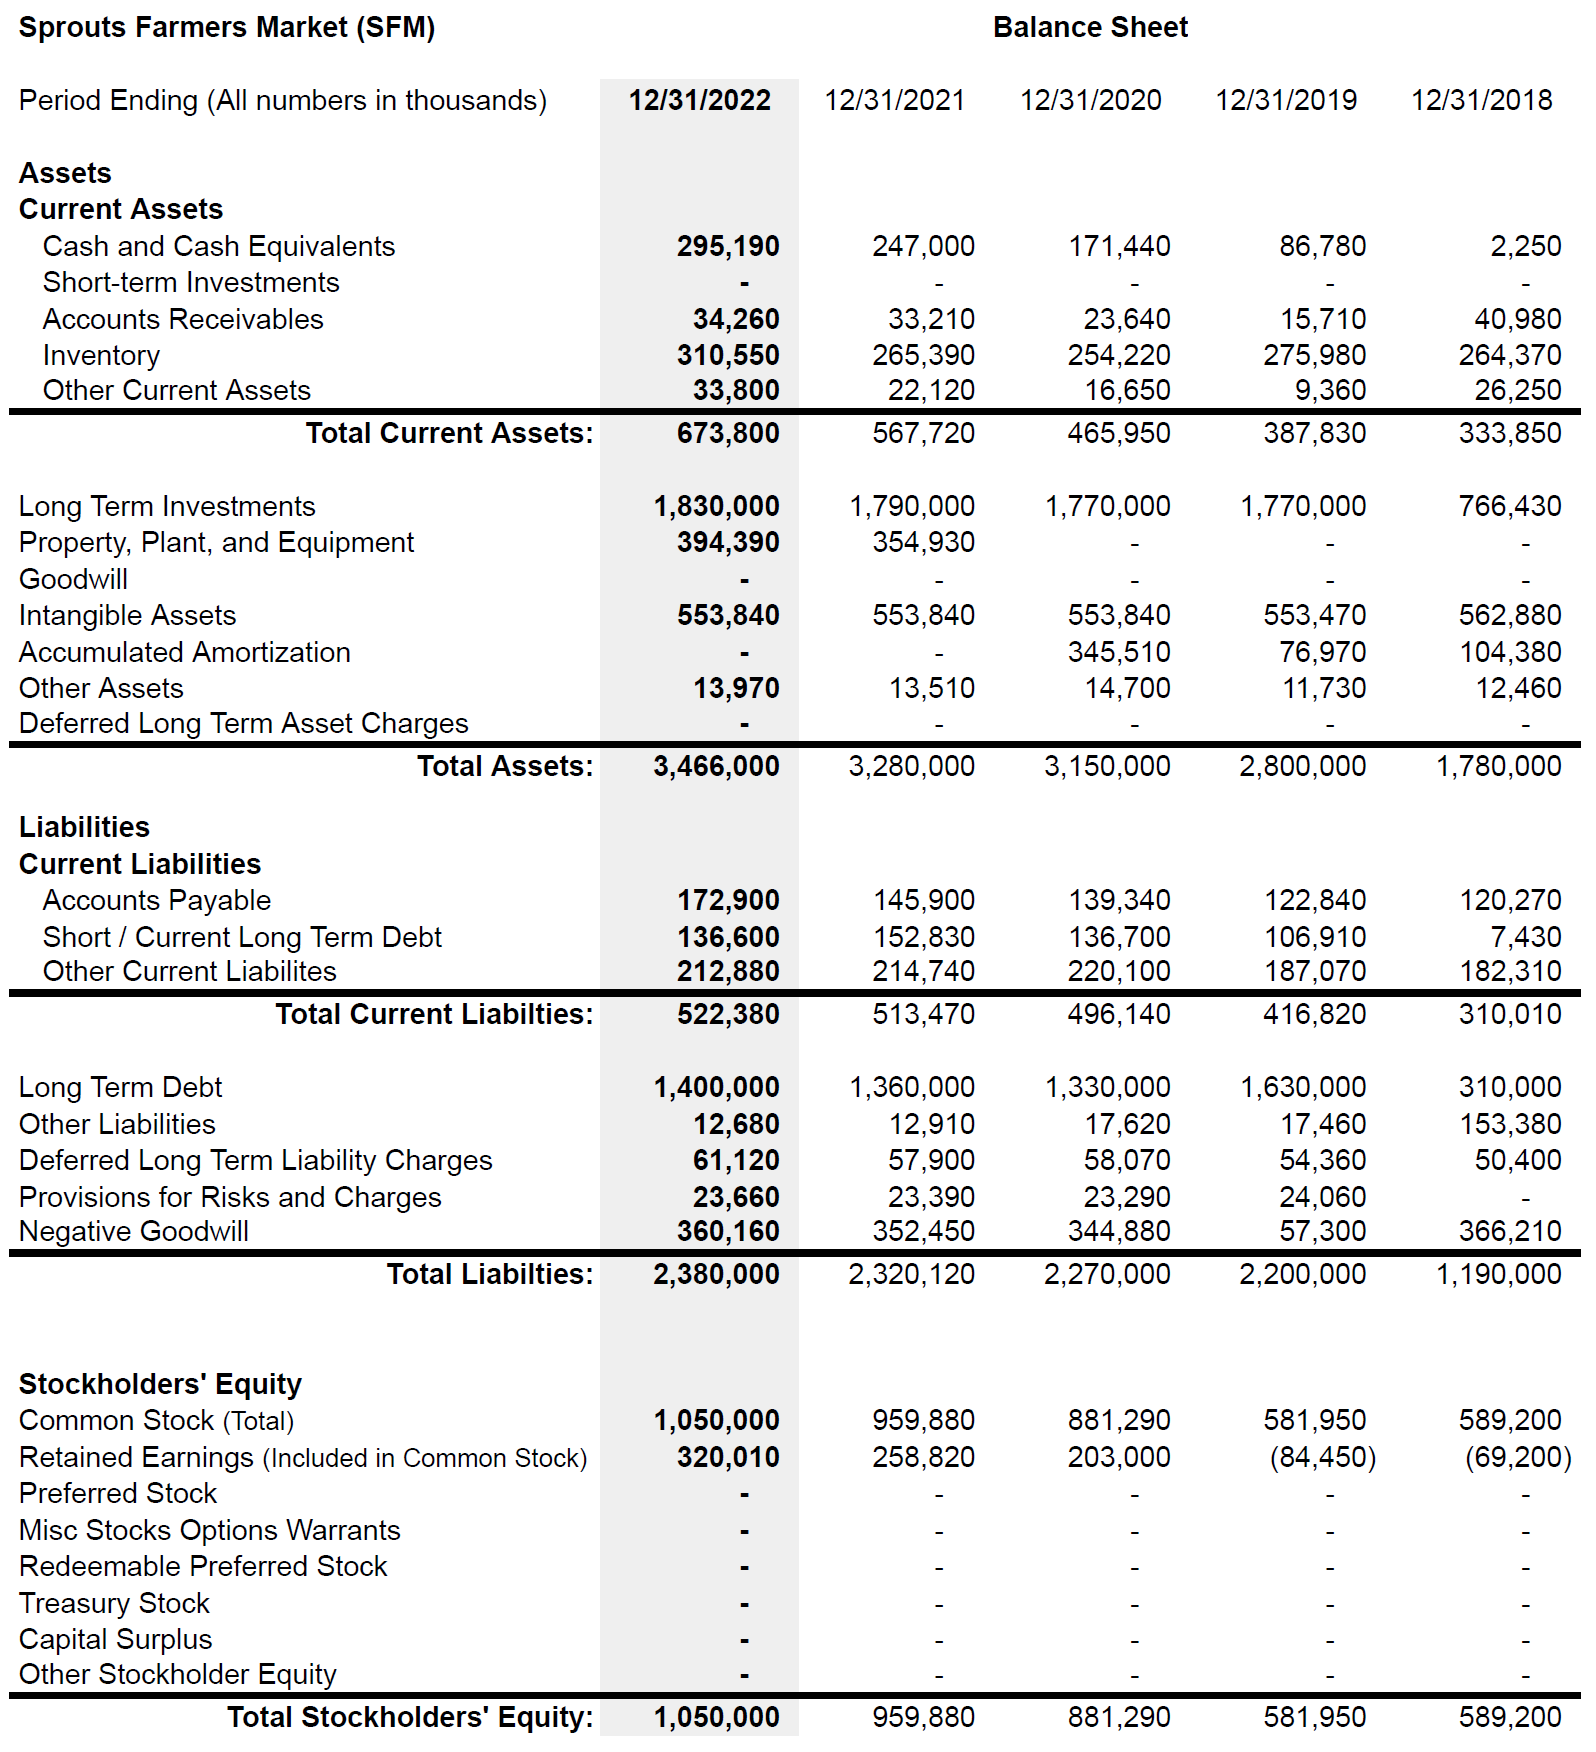
Notice the phrase “All numbers in thousands.” This means we must add three zeros to every number. For example, Sprouts did not have only $247,000 in Cash and Cash Equivalents on December 31, 2022. They had $247,000,000, two hundred and forty-seven million dollars.
The Income Statement
The Income Statement lists the revenue and expenses of a corporation in order to report the earnings of the corporation. Whereas the Balanced Sheet is a snapshot in time, the Income Statement is more similar to a movie and reports the difference between a company’s revenues and expenses over a set time period, usually either a three-month quarter or an entire year. An older term for the Income Statement that is still used by many is the Profit and Loss Statement. The ultimate goal of the Income Statement is to compute the net income of the business. The formula boils down to:
Net Income = Revenue - Expenses
The Income Statement, however, breaks down this simplistic formula into many steps. Although there are many calculations and entries regarding revenues and expenses, two of the entries on the Income Statement are followed more closely than the others, the “top line” and the “bottom line.”
The “top line” of the Income Statement refers to the revenues, also known as sales, of the corporation. The “bottom line” of the Income Statement refers to the net income, also known as the earnings, net earnings, profit, or net profit. Although Income Statements may vary depending upon the source, the revenue/sales are always at the top of the Income Statement and the net income/earnings/profit are always at the bottom of the Income Statement. During earnings calls, research articles, or discussions in the media about companies, the executives, authors, and analysts will invariably discuss the relationship and differences between the top line growth and the bottom line growth as they discuss the past and future performance of the company.
The bottom line net income is used by the corporation to pay dividends to stockholders. However, as we have learned, corporations are under no obligations to pay dividends. If the earnings are not paid to shareholders, they are referred to as retained earnings and are kept within the company to finance future growth.
Here is the Income Statement for Sprouts Family Market as of December 31, 2022.
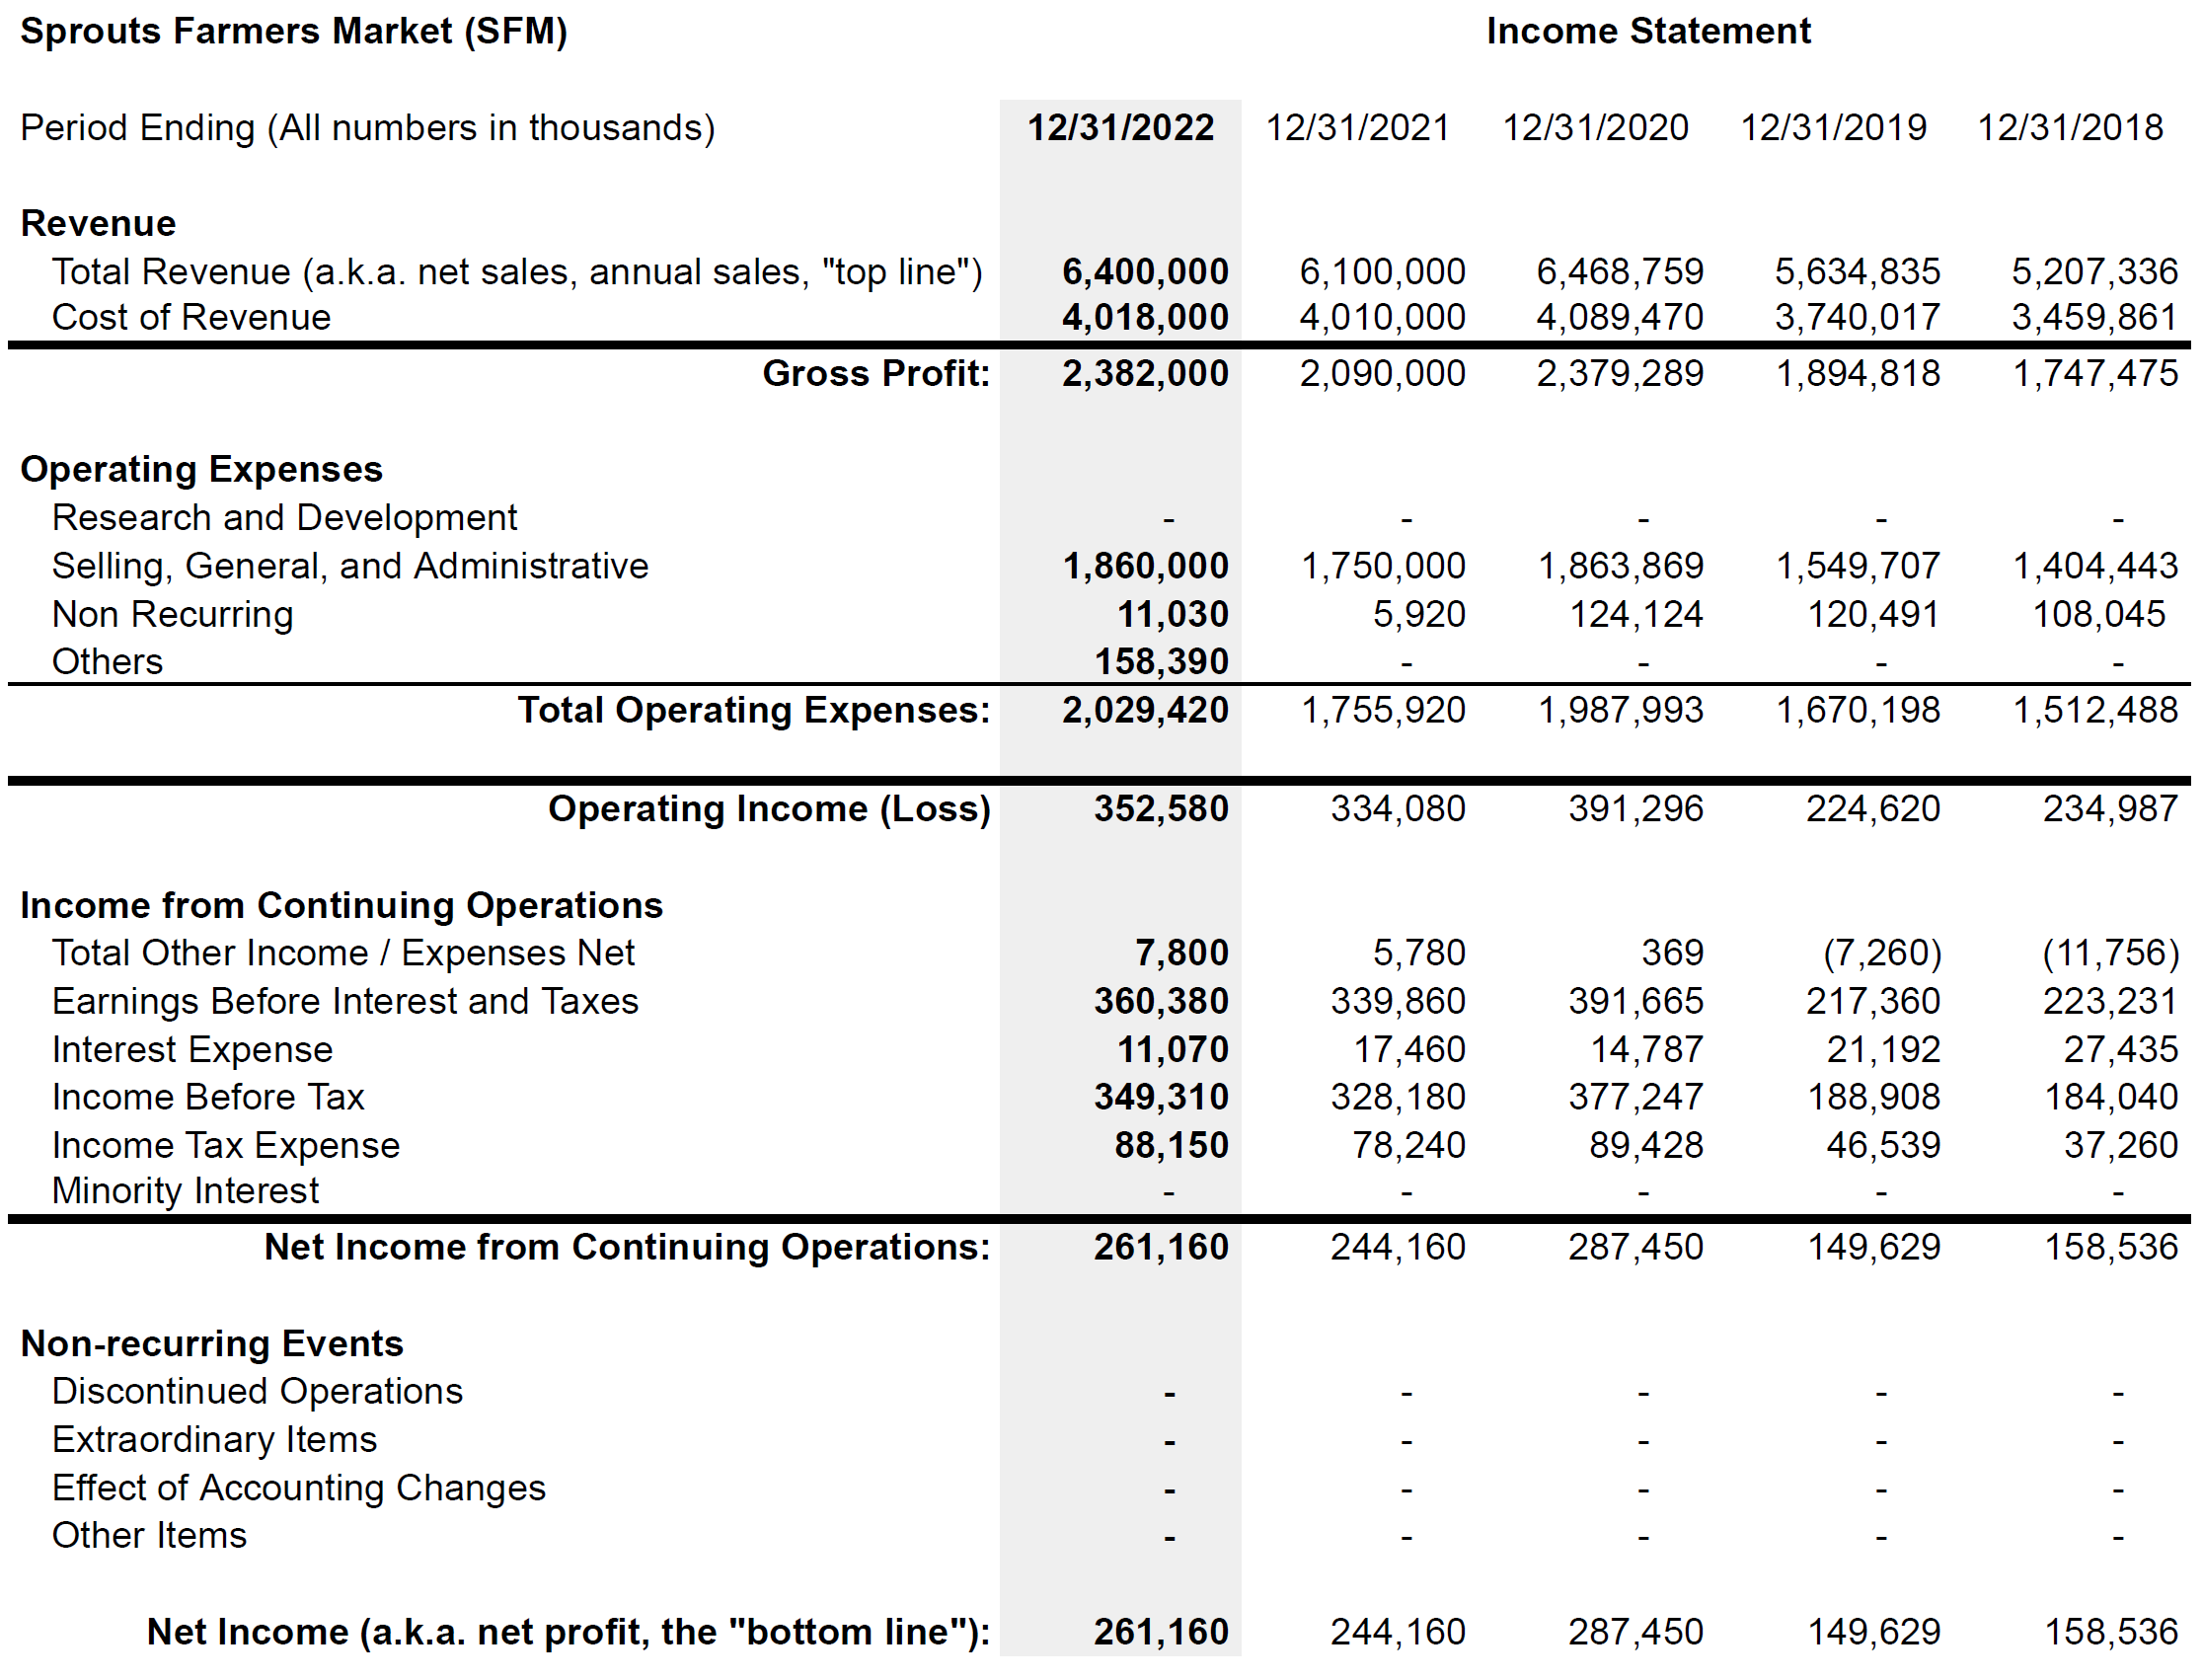
The bottom line net income is computed using the same GAAP procedures mentioned above. Hence, we find that there are some entries in the Income Statement that are not always received or paid in cash. One of the most important of these types of entries is our old friend, depreciation. As with the Balance Sheet, depreciation can obscure the numbers behind the Income Statement. Depreciation can complicate and obscure how much cash a company is actually being earned from their operations. Depreciation and other accounting entries can create a situation where the earnings that are reported by a company are widely different from the amount of cash that flows in or out of the company. That is why there is the Cash Flow Statement.
The Cash Flow Statement
The Cash Flow Statement, also known as the Statement of Cash Flows, follows the age-old advice, “Follow the money.” It peers into the corporation’s checkbook to see all the cash inflows and outflows. Depreciation is one of the biggest reasons for the potential differences between the earnings and the cash flow of a company. A company does not write a check for depreciation. No cash was paid. However, the depreciation amount reduced the company’s earnings. That amount is still contained within the company’s checking account. Other entries in the Cash Flow Statement refer to the cash and non-cash inflows and outflows from its ongoing operations and non-operating financial and investment transactions.
Here is the Cash Flow Statement for Sprouts Family Market as of December 31, 2022.
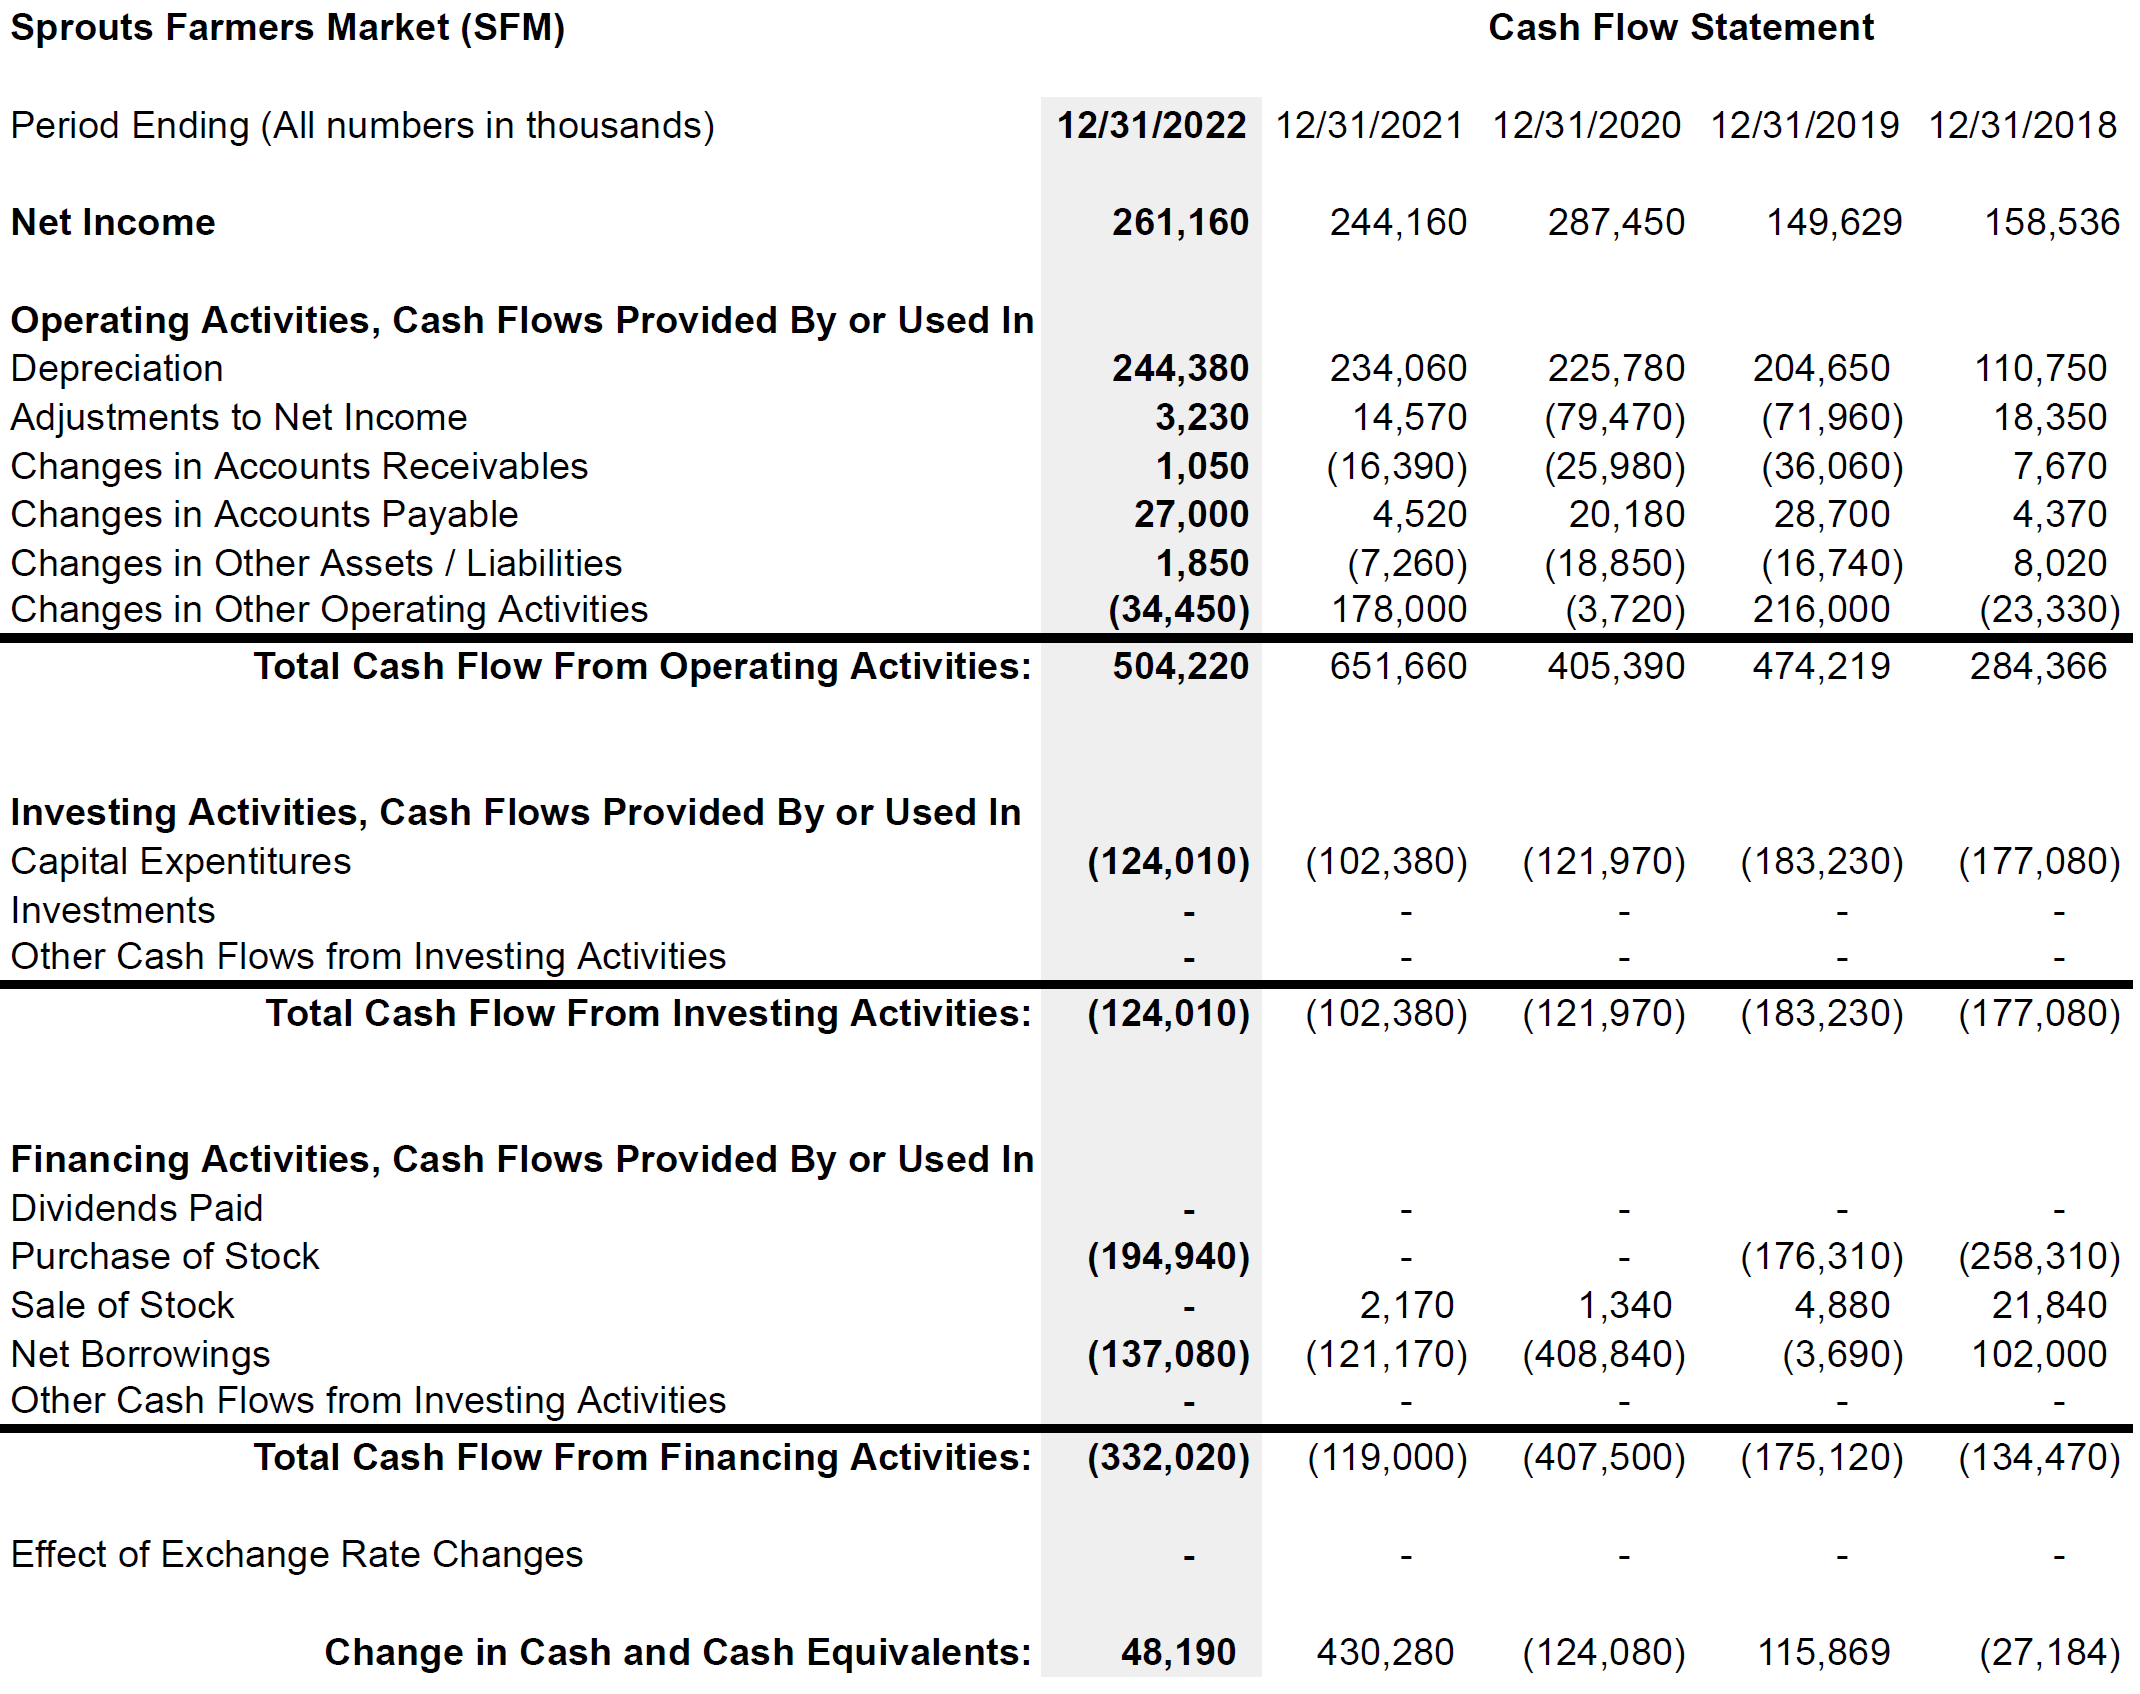
Note: This Cash Flow Statement is an amalgam of two different sources of the financial data for Sprouts Family Market. My apologies. I am not an accountant and I am pretty sure that these numbers need to be adjusted to better reflect their financial situation. (That is a fancy way of saying that I need help from someone more skilled in accounting.)
The Cash Flow Statement can be especially important when there are situations that are obviously conflicting and contradictory. For example, how could a company be reporting record earnings but at the same time, the cash balance of their checkbook was going down? This was the situation of many high-flying technology companies such as Lucent Technologies during the late 1990’s as the Internet dot-com bubble was raging.
Lucent Technologies was spun off from the old AT&T. It had originally been the manufacturing arm of AT&T and was known as Western Electric and Bell Labs, the folks that invented the transistor, the laser, photovoltaic cells, and Unix. They built the best telephone equipment in the world. During the Internet mania, many new companies sprung up to carve out a niche for themselves in the burgeoning world of telecommunications. Lucent was eager to sell wireless and Internet equipment to these new companies. However, the companies did not have the cash to pay for the equipment nor any earnings that would help them finance the purchase using a bank or other form of borrowing. In order to facilitate the transactions, Lucent agreed to sell these companies their equipment and accept payments over many years. In essence, Lucent became their banker. Hence, Lucent’s sales were enormous and they were reporting record earnings. However, since only a small part of the payment was being realized each year, the cash position was falling. When the dot-com bubble burst, events did not end well for Lucent. Many of these companies failed to ever achieve profitability and went bankrupt. In the bankruptcy, Lucent received the equipment back but now the equipment was obsolete and could not be sold again except at salvage prices. Its stock price fell from a high of $84 down to $2.13. Close examination of Lucent’s Cash Flow Statement during the heady years of the dot-com mania would have warned prudent, long-term investors of the dangers ahead for Lucent. “Hey, Lucent! How come you are recording record earnings but your checkbook balance is declining?”
SEC Edgar
As a central repository for the financial statements of corporations, the Securities and Exchange Commission (SEC) uses a system called EDGAR, the Electronic Data Gathering, Analysis, and Retrieval system. Annually and quarterly, publicly traded corporations are required to file their financial statements with this system. The annual reports are called 10-K’s and the quarterly reports are called 10-Q’s. Anyone with Internet access is free to download the statements. Before Internet technology made the dissemination of information to anyone around the world readily and easily available, it was typical for analysts and other Wall Street professionals to be apprised of the upcoming financial information coming from a company. With the advent of the new technologies, in the year 2000, the SEC instituted Regulation FD, Fair Disclosure. Companies were prohibited from sharing any information before the material was submitted to the EDGAR system. Subsequently, companies now schedule an Earnings Call for when the material is available on EDGAR and all parties are privy to the information at the same date and time.
EDGAR and the financial statements are just the beginning. We must also take advantage of the company’s annual report and other materials found on their website. And don’t forget The Value Line! However, there are countless reliable and scrupulous and not-so-reliable and not-so-scrupulous sources. These days, it is common to hear investors complain that there is just too much information. A quote from the author Nick Murray is useful here. When discussing the value of a financial advisor, Nick Murray once quipped, “Wisdom sold separately.” Yes, there is no end to the information available. Deciding what information is important and how to make sense of it is a very different matter.
Starting in the heady dot-com mania days and continuing to this day, much attention was and still is focused on the whisper number, the unofficial, unregulated, unsubstantiated, presumed company earnings. For some short-term traders and speculators, what passes for intelligent investing is gambling whether or not a company will beat the whisper number or not. If the company’s official earnings beat the whisper number, the stock price might zoom higher. If not, the stock might be punished. Should a prudent, long-term investor ever pay attention to the whisper number? If you have been paying attention, you already know the answer.
Financial Ratios and Ratio Analysis
We will use the financial statements to compute financial ratios. Financial ratios are simply the relation between two financial quantities expressed as the quotient of one divided by the other. We have already covered a few such as the Price-to-Earnings Ratio, Earnings Per Share, Dividends per Share, and Dividend Payout Ratio. We will then utilize the various financial ratios to perform ratio analysis, the study of the relationships between financial statement accounts. Does it sound as exciting as the Dividend Discount Models and the Discounted Cash Flow Model? Ah, yeah, right, it does not sound that exciting and to be honest, it really isn’t. However, ratio analysis is important and it helps us get a more complete picture of the companies that we are researching and investigating as potential investments.
The more important point to keep in mind is that there is no one ratio that can accurately sum up the overall general state of a company. Each ratio must be considered in the context of all the information gathered. Plus you must consider any ratio in the context of the industry the company exists within. We will see an example of this as we investigate the most popular financial ratio, the Price-to-Earnings Ratio, also known as P/E or just PE. (No, not Physical Education.)