
3.4: Stock Market Averages and Indexes; Volatility Reexamined
- Page ID
- 83077

\( \newcommand{\vecs}[1]{\overset { \scriptstyle \rightharpoonup} {\mathbf{#1}} } \)
\( \newcommand{\vecd}[1]{\overset{-\!-\!\rightharpoonup}{\vphantom{a}\smash {#1}}} \)
\( \newcommand{\dsum}{\displaystyle\sum\limits} \)
\( \newcommand{\dint}{\displaystyle\int\limits} \)
\( \newcommand{\dlim}{\displaystyle\lim\limits} \)
\( \newcommand{\id}{\mathrm{id}}\) \( \newcommand{\Span}{\mathrm{span}}\)
( \newcommand{\kernel}{\mathrm{null}\,}\) \( \newcommand{\range}{\mathrm{range}\,}\)
\( \newcommand{\RealPart}{\mathrm{Re}}\) \( \newcommand{\ImaginaryPart}{\mathrm{Im}}\)
\( \newcommand{\Argument}{\mathrm{Arg}}\) \( \newcommand{\norm}[1]{\| #1 \|}\)
\( \newcommand{\inner}[2]{\langle #1, #2 \rangle}\)
\( \newcommand{\Span}{\mathrm{span}}\)
\( \newcommand{\id}{\mathrm{id}}\)
\( \newcommand{\Span}{\mathrm{span}}\)
\( \newcommand{\kernel}{\mathrm{null}\,}\)
\( \newcommand{\range}{\mathrm{range}\,}\)
\( \newcommand{\RealPart}{\mathrm{Re}}\)
\( \newcommand{\ImaginaryPart}{\mathrm{Im}}\)
\( \newcommand{\Argument}{\mathrm{Arg}}\)
\( \newcommand{\norm}[1]{\| #1 \|}\)
\( \newcommand{\inner}[2]{\langle #1, #2 \rangle}\)
\( \newcommand{\Span}{\mathrm{span}}\) \( \newcommand{\AA}{\unicode[.8,0]{x212B}}\)
\( \newcommand{\vectorA}[1]{\vec{#1}} % arrow\)
\( \newcommand{\vectorAt}[1]{\vec{\text{#1}}} % arrow\)
\( \newcommand{\vectorB}[1]{\overset { \scriptstyle \rightharpoonup} {\mathbf{#1}} } \)
\( \newcommand{\vectorC}[1]{\textbf{#1}} \)
\( \newcommand{\vectorD}[1]{\overrightarrow{#1}} \)
\( \newcommand{\vectorDt}[1]{\overrightarrow{\text{#1}}} \)
\( \newcommand{\vectE}[1]{\overset{-\!-\!\rightharpoonup}{\vphantom{a}\smash{\mathbf {#1}}}} \)
\( \newcommand{\vecs}[1]{\overset { \scriptstyle \rightharpoonup} {\mathbf{#1}} } \)
\(\newcommand{\longvect}{\overrightarrow}\)
\( \newcommand{\vecd}[1]{\overset{-\!-\!\rightharpoonup}{\vphantom{a}\smash {#1}}} \)
\(\newcommand{\avec}{\mathbf a}\) \(\newcommand{\bvec}{\mathbf b}\) \(\newcommand{\cvec}{\mathbf c}\) \(\newcommand{\dvec}{\mathbf d}\) \(\newcommand{\dtil}{\widetilde{\mathbf d}}\) \(\newcommand{\evec}{\mathbf e}\) \(\newcommand{\fvec}{\mathbf f}\) \(\newcommand{\nvec}{\mathbf n}\) \(\newcommand{\pvec}{\mathbf p}\) \(\newcommand{\qvec}{\mathbf q}\) \(\newcommand{\svec}{\mathbf s}\) \(\newcommand{\tvec}{\mathbf t}\) \(\newcommand{\uvec}{\mathbf u}\) \(\newcommand{\vvec}{\mathbf v}\) \(\newcommand{\wvec}{\mathbf w}\) \(\newcommand{\xvec}{\mathbf x}\) \(\newcommand{\yvec}{\mathbf y}\) \(\newcommand{\zvec}{\mathbf z}\) \(\newcommand{\rvec}{\mathbf r}\) \(\newcommand{\mvec}{\mathbf m}\) \(\newcommand{\zerovec}{\mathbf 0}\) \(\newcommand{\onevec}{\mathbf 1}\) \(\newcommand{\real}{\mathbb R}\) \(\newcommand{\twovec}[2]{\left[\begin{array}{r}#1 \\ #2 \end{array}\right]}\) \(\newcommand{\ctwovec}[2]{\left[\begin{array}{c}#1 \\ #2 \end{array}\right]}\) \(\newcommand{\threevec}[3]{\left[\begin{array}{r}#1 \\ #2 \\ #3 \end{array}\right]}\) \(\newcommand{\cthreevec}[3]{\left[\begin{array}{c}#1 \\ #2 \\ #3 \end{array}\right]}\) \(\newcommand{\fourvec}[4]{\left[\begin{array}{r}#1 \\ #2 \\ #3 \\ #4 \end{array}\right]}\) \(\newcommand{\cfourvec}[4]{\left[\begin{array}{c}#1 \\ #2 \\ #3 \\ #4 \end{array}\right]}\) \(\newcommand{\fivevec}[5]{\left[\begin{array}{r}#1 \\ #2 \\ #3 \\ #4 \\ #5 \\ \end{array}\right]}\) \(\newcommand{\cfivevec}[5]{\left[\begin{array}{c}#1 \\ #2 \\ #3 \\ #4 \\ #5 \\ \end{array}\right]}\) \(\newcommand{\mattwo}[4]{\left[\begin{array}{rr}#1 \amp #2 \\ #3 \amp #4 \\ \end{array}\right]}\) \(\newcommand{\laspan}[1]{\text{Span}\{#1\}}\) \(\newcommand{\bcal}{\cal B}\) \(\newcommand{\ccal}{\cal C}\) \(\newcommand{\scal}{\cal S}\) \(\newcommand{\wcal}{\cal W}\) \(\newcommand{\ecal}{\cal E}\) \(\newcommand{\coords}[2]{\left\{#1\right\}_{#2}}\) \(\newcommand{\gray}[1]{\color{gray}{#1}}\) \(\newcommand{\lgray}[1]{\color{lightgray}{#1}}\) \(\newcommand{\rank}{\operatorname{rank}}\) \(\newcommand{\row}{\text{Row}}\) \(\newcommand{\col}{\text{Col}}\) \(\renewcommand{\row}{\text{Row}}\) \(\newcommand{\nul}{\text{Nul}}\) \(\newcommand{\var}{\text{Var}}\) \(\newcommand{\corr}{\text{corr}}\) \(\newcommand{\len}[1]{\left|#1\right|}\) \(\newcommand{\bbar}{\overline{\bvec}}\) \(\newcommand{\bhat}{\widehat{\bvec}}\) \(\newcommand{\bperp}{\bvec^\perp}\) \(\newcommand{\xhat}{\widehat{\xvec}}\) \(\newcommand{\vhat}{\widehat{\vvec}}\) \(\newcommand{\uhat}{\widehat{\uvec}}\) \(\newcommand{\what}{\widehat{\wvec}}\) \(\newcommand{\Sighat}{\widehat{\Sigma}}\) \(\newcommand{\lt}{<}\) \(\newcommand{\gt}{>}\) \(\newcommand{\amp}{&}\) \(\definecolor{fillinmathshade}{gray}{0.9}\)Finally! We are finally at the point in our journey together where we will discuss market measures that we have been using since our first discussions about investments. It’s about time! How can we say that “stocks have returned approximately 10% over the past 90 years?” The industry uses market averages and indexes. These are standards, also called benchmarks, that are used to measure the general behavior of securities prices at a given point in time or over specific time periods. In other words, they are just lists of stocks. You cannot help but hear about these every day in the news. “The Dow went down! The NASDAQ went up!” What are they trying to tell us and how much significance should we attach to them? Let’s explore.
Market Averages versus Market Indexes
A few of these standards are market averages and reflect the average price behavior of the list of stocks. Most others are market indexes and reflect the relational price behavior. The differences between a market average and market index are subtle. Most people do not even know there are differences. Market averages use share price calculation only. They look solely at the price of the stock without regard to the market value of the stock. The most important example of a market average is the Dow Jones Industrial Average. Market indexes use a market-weighted calculation. They take into account the overall market value of the company as well as the stock price. The larger the size of the company, the more weight and influence the security will have in the index. The most popular example of a market index is the Standard and Poor’s 500 Stock Index. Market-weighted calculations are generally regarded as better measures than market averages but for our purposes, the differences are mostly unimportant. As with anything we humans have done, neither is perfect.
The Dow Jones Industrial Average and other Dow Averages and Indexes
In 1896, Charles Dow and his partner, Edward Jones, created the Dow Jones Industrial Average, a list of 12 stocks. It is also represented as the DJIA, the Dow Average, or simply the Dow. The Dow is the second oldest market benchmark and is the most famous of all stock market measures. The list of companies in the average is composed of 30 high-quality stocks selected for total market value and broad public ownership and believed to reflect overall market activity. Since it is an average, it uses share price calculation only, not taking into account the size of the company. As the economy and technology change and evolve and companies rise and fall, from time to time, the list of stocks is adjusted. Some companies are removed and others take their place. As such, it now has more non-industrial stocks than industrial stocks. Although the Dow is by far the most popular index and is reported more than any other, with only 30 companies, it really isn’t the best measure of the stock market’s performance.
For decades the Dow was managed by Dow Jones, the company that publishes the Wall Street Journal. Dow Jones was controlled by a close-knit family for generations, the famed Bancrofts. The stock of the company was selling for approximately $36 when in 2007, Rupert Murdoch of Fox News, offered to buy all shares for $60 per share and fold the business into his publishing empire. Some in the family did not want to sell. However, the allure of the elevated premium was too powerful to resist. Since then, it appears that Fox News has either sold or simply delegated the management of the Dow to Standards and Poor’s, the research company that manages the Standard and Poor’s 500 Index and the subject of our next section. However, it is difficult to know for sure the exact nature of the relationship between Dow Jones and Standard and Poor’s. If anyone wants to take on this research as an extra credit assignment, please contact me.
| American Express | Goldman Sachs | NVIDIA |
| Amazon | Home Depot | Procter & Gamble |
| Amgen | Honeywell | Salesforce |
| Apple | IBM | Sherwin-Williams |
| Boeing | Johnson & Johnson | 3M |
| Caterpillar | J. P. Morgan Chase | Travelers |
| Chevron | McDonald’s | United Healthcare |
| Cisco Systems | Merck | Verizon |
| Coca Cola | Microsoft | Visa |
| Disney | Nike | Walmart |
The table above lists the 30 stocks that are contained in the Dow Jones Industrial Average as of February 2025. Only a handful are associated with the industrial industry. That is why it is more often referred to as the Dow. Also, the past 25 years have seen numerous changes in the makeup of the index. Many of the recent changes have seemed erratically, questionable, and even slow-witted. For example, AIG and Citigroup were removed from the Dow as they teetered on the edge of bankruptcy. GM was in bankruptcy when it was removed. This is yet another reason why the Dow is not a good measure of stock market performance. With only 30 stocks, just one or two spectacular failures muddle the long-term results.
There is a more insidious problem with the Dow. For example, you may hear after a severe market downturn, “The Dow is where it was 15 years ago!” The problem with this statement is that the Dow 15 years ago was a very different index. Many of the companies that are now in the Dow weren’t in the index 15 years ago and others that were in the list have been removed. This is a problem with all averages and indexes but it is especially a problem with a list such as the Dow which only has 30 stocks. In Your Humble Author’s opinion, the Dow should be retired. However, that is not going to happen anytime soon.
Dow Jones has many other benchmarks. One average that is followed by many is the Dow Jones Transportation Average. This average is actually the first average that Mr. Dow and Mr. Jones created. It was created in 1884, twelve years before the Industrial Average. It is a list of 20 stocks in the transportation industry. The Transportation Average is followed by many because of the belief that the transport industry is a leading indicator of economic activity. Before the products can be produced and then sold, the raw materials must get to where they need to go to be developed into finished products and then the finished products need to be delivered to where they will be sold. Another long-lived Dow Jones average is the Dow Jones Utility Average. It was created in 1929 and contains 15 prominent utility companies. Put them all together and you have the Dow Jones Composite Average. The Transport average is sometimes reported in the media. The Utility Average and the Composite Average are rarely ever reported.
A Dow Jones benchmark which is worthy of following is the Dow Jones U.S. Total Stock Market Index. This is a broad-based index that includes large companies, mid-sized companies, and small companies, representing approximately 95% of the total market value of stocks domiciled in the United States stocks. The original index was created by Wilshire Associates in 1974 and was called the Wilshire 5000. In 2004, Dow Jones somehow cajoled Wilshire to rename the index the Dow Jones Wilshire 5000 Index and then in 2009, they kicked Wilshire to the side of the road and renamed the index to Dow Jones U.S. Total Stock Market Index. We don’t know about you, but Wilshire 5000 is a whole lot easier to say than Dow Jones U.S. Total Stock Market Index, don’t you agree? Unfortunately for us tongue-twisted investors, this index is important for us to be aware of. It is used in many passively-managed index funds and Exchange Traded Funds.
Another important Dow Jones index is the Dow Jones U.S. Completion Total Stock Market Index. What a mouthful! Like the Wilshire 5000, Dow Jones somehow spirited away the idea behind this index from Wilshire Associates. The original index was called the Wilshire 4500. Wilshire Associates wanted to measure the results of medium-sized and small companies. They took the 5,000 stocks in the Wilshire 5000 and then removed the 500 largest companies. This index may be familiar to those who have finished the Thrift Savings Plan assignment. One of the funds uses this index as its benchmark. Do you remember which one?
Dow Jones published many other benchmarks. One of their more forgettable indexes was the Dow Jones Internet Index. The index was created in February of 1999 as the “dot com” Internet mania was in full swing. Companies with no prospects of earnings for several years attached “.com” to their names and saw their stock prices rise tenfold! The “dot com” mania was then followed by the “dot bomb” crash. The Dow Jones Internet Index proceeded to fall 96% from its peak. Yet another example of why it is dangerous to follow the crowd to the “Next Big Thing!”
The Standard & Poor’s 500 Index and other S&P Indexes
Standard and Poor’s is an investment research firm with many decades of experience. They now refer to themselves as S&P Global but everyone still refers to them as Standard and Poor’s, or just S&P. Their most famous index is the Standard and Poor’s 500 Index, commonly referred to as the S&P 500. We have been using it in our studies since the first chapter. While the Dow Jones Industrial Average may be more popular in the eyes of the general public, the S&P 500 is by far the more influential benchmark. The index consists of approximately 500 stocks chosen for market size, liquidity, and industry group representation. Traditionally, the index contained 500 of the largest companies based in the United States. The S&P 500 is a very popular index and is used by many index mutual funds and Exchange Traded Funds.
Because the S&P 500 is market-weighted, it was affected by the Internet bubble of the late 1990’s in a bizarre manner. The market values of a small percentage of technology companies were inflated to extremes. This skewed the index even more toward those companies. Consequently, in 1998, 10% of the gain in the S&P 500 was due to one stock. This same phenomenon is currently in play with the top ten companies having an outsized influence on the index.
If Wikipedia is to be believed, Standard and Poor’s has over 100,000 benchmarks consisting of their own and the Dow Jones averages and indexes that they also manage. There are small company indexes, mid-sized company indexes, global and international indexes, sector indexes, you name it! None are as important as the S&P 500. Feel free to peruse them at your leisure at their website. Enjoy!
The NYSE, AMEX, and NASDAQ Indexes
The NYSE, the AMEX, and the NASDAQ all have their own composite indexes consisting of chosen stocks on their respective stock marketplaces. The NYSE Composite and the AMEX Composite Index are not generally reported by the media nor followed by the investing public. However, the NASDAQ Composite is. Since the NASDAQ is dominated by technology companies, the NASDAQ Composite is often called the “tech index.” The NASDAQ Composite went from 800 in March of 1995 to 5,000 in March of 2000. As the Internet bubble burst, the NASDAQ then dropped to 1,200 in September of 2002 before starting to recover. When this happened, you often heard the talking heads in the investment media asking rhetorical questions such as, “When will the NASDAQ reach 5,000 again?” or, “Can you believe that the NASDAQ is back to where it was in 1996?” Both of these questions show a profound misunderstanding of how indexes work. In 2000, the index was nothing like it was in 1996. Dozens and dozens of companies were not in the index in 1996 and had sprouted up during the Internet euphoria. Many of these companies were not likely to ever be profitable yet but had profound valuations. Likewise, when the NASDAQ finally did reach 5,000 again in 2015, most of those new companies that were in the NASDAQ in 2000 were gone, bankrupt, finished, kaput! The name of the index was the same. However, the companies on the list were very different.
For this reason, prudent, long-term investors may follow the popular indexes in the news as they would follow the weather. They are both interesting and a frequent topic of polite conversation. However, making any kind of investment decisions based upon the short-term or long-term performance ‒ or lack thereof ‒ of any particular index or group of indexes is contradictory to one’s long-term success.
The Russell 2000
In 1984, the investment research firm Russell Investments, née Frank Russell and Associates, created the Russell 2000 Index. They took the 3,000 largest companies and then chopped off the largest 1,000 companies. What is left are 2,000 small and mid-sized companies. Many investors look to the Russell 2000 as a leading indicator for the United States economy as small businesses tend to suffer sooner when an economic downturn occurs. However, smaller companies tend to recover more quickly when the economy turns around as they are nimbler and can more rapidly take advantage of new opportunities.
Global and International Indexes
After World War II, some domestic investment firms started searching for investment opportunities outside the United States. However, there was no index designed to measure the performance of global and international markets. In 1969, Capital International, then a division of the Capital Group, launched a series of indexes to measure the performance of global and international markets. In 1986, Morgan Stanley licensed the rights to the indexes and rebranded them with the title MSCI, Morgan Stanley Capital International. The most popular and useful indexes were the MSCI World Index and the MSCI EAFE Index. The MSCI World Index was meant to measure the global stock market, including the United States while the MSCI EAFE Index was meant to measure the international stock market, everyone except for the United States. EAFE stands for Europe, Australia, and the Far East. When these indexes were created, they focused primarily on developed countries. No provision was ever made for the fast-growing emerging and developing economies. As they grew, their companies were left out of the indexes. Instead of including companies from these countries, MSCI decided to launch two new indexes, the MSCI All Country World Index and the MSCI All Country World Index ex-USA. (And you thought that the Dow Jones U.S. Completion Total Stock Market Index name was bad!)
Which indexes are important for investors to follow? Each investor will decide upon which indexes are important to them or indeed, if any are important. However, for our class, we need to internalize the following eight indexes as described in Stock Worksheet #1. (As with all worksheets on the class website, there is an answer key and an audio commentary.)
| Market Average or Index | Description |
| Dow Jones Industrial Average, also known as the DJIA or just the Dow | Stock market average made up of 30 high-quality stocks selected for total market value and broad public ownership and believed to reflect overall United States market activity |
| Standard and Poor’s 500 Index, also known as the S&P 500 or just the S&P | Traditionally, the 500 largest stocks based in the United States chosen for their market size, liquidity, and industry group representation |
| NASDAQ Composite | Market index mostly composed mainly of high-tech companies based in the United States |
| Dow Jones U.S. Total Stock Market Index, née Wilshire 5000 | Market index designed to gauge the total United States stock market |
| Dow Jones U.S. Completion Total Stock Market Index, née Wilshire 4500 | Market index designed to measure the total United States stock market excluding the largest 500 companies, very popular with many index funds |
| Russell 2000 | Market index most often used as a measure of the strength or weakness of medium-sized and small-sized companies based in the United States |
| MSCI All Country World Index (née MSCI World Index) | Market index designed to measure the global stock markets of the world including the United States |
| MSCI All Country World Index ex-USA (née MSCI EAFE Index) | Market index designed to measure the international stock markets of the world excluding the United States |
Stock Market Index Mania!
The job of the mass media is to keep you on the edge of your seats. "Stay tuned for the latest disasters!" The investment media is not immune from sensationalism. Each day, you will be bombarded with graphics similar to this one, entitled Today’s Unstable Stock Market:

There is a joyful little book entitled How to Lie with Statistics by Darrel Huff. It was written in 1954 so the numbers are very different from what we would see today. Nevertheless, the concepts are timeless. In the book, Mr. Huff shows us one of the most common ways to lie with statistics is to simply not show the whole story. In this case, by just showing you the Dow from 44,725 to 44,740, we perceive that the market is widely convulsing up and down. However, if we were to include from 0 to 45,000, the graphic would show a much different story. Please consider today’s stable stock market:
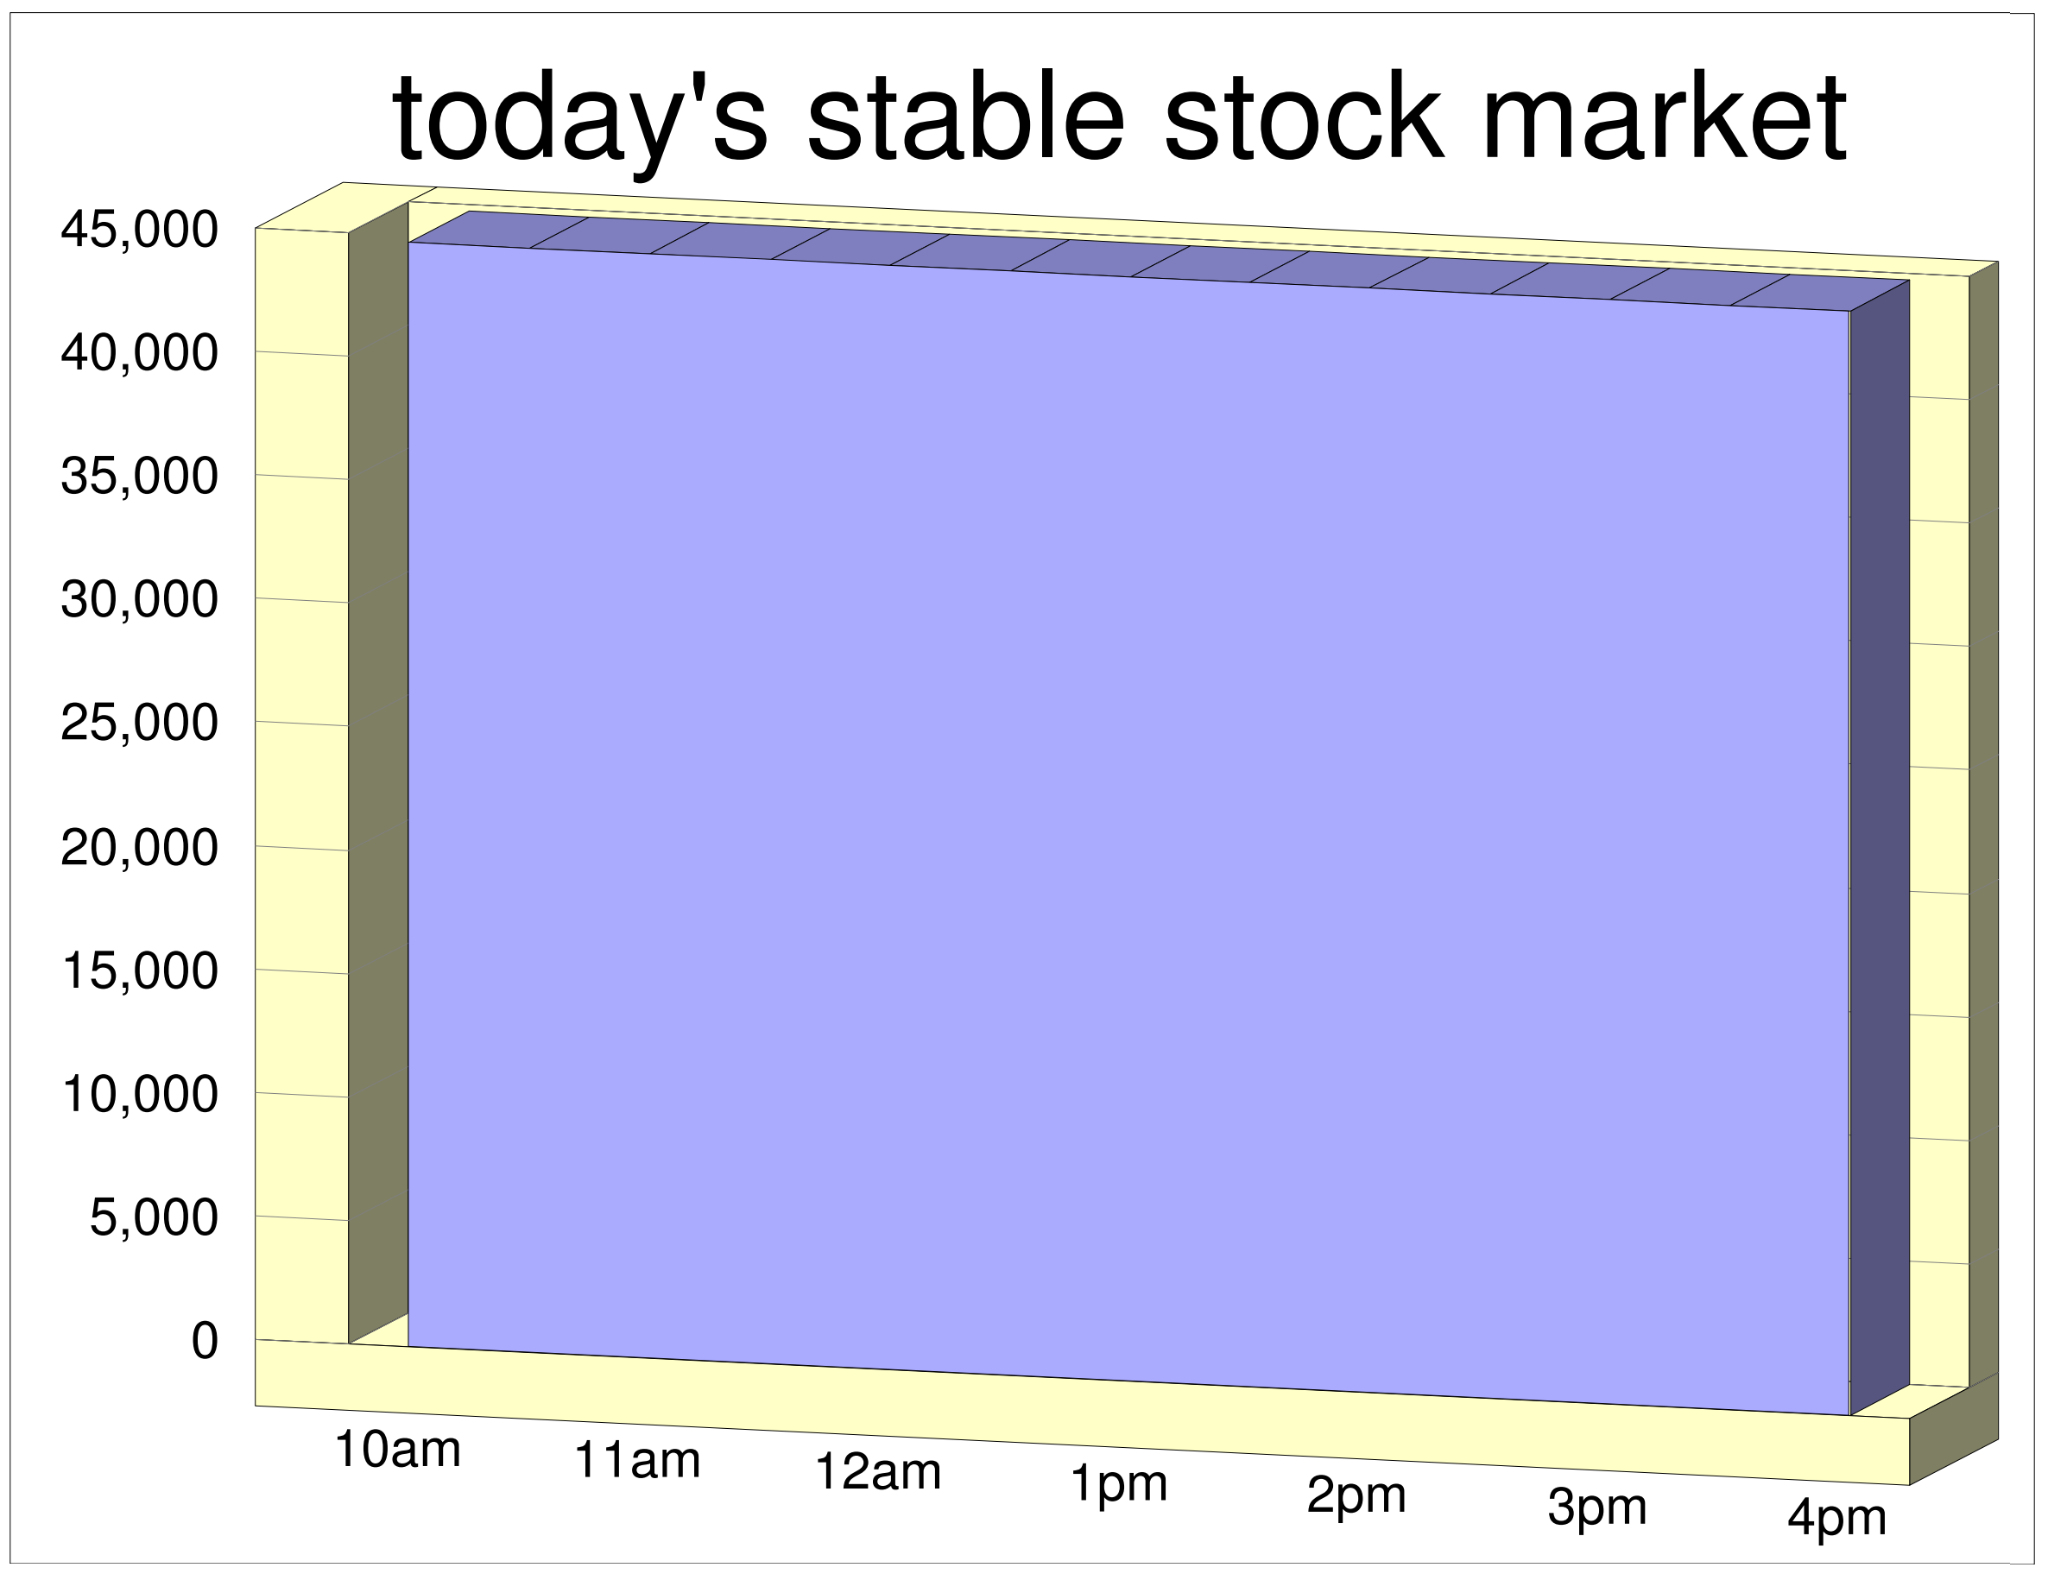
This graphic would not elicit much emotion, would it? Good! That’s what we want! When the news or radio or website is screaming about how volatile the stock market is, please pull out this graph and remind yourself what their scary slick graphic would look if they showed us the whole picture.
Volatility Reexamined
We can now revisit volatility. Here is the same graph of the S&P 500 Index for the year 2022 that we first saw at the beginning of this chapter. The only difference is that this graph shows us the whole picture, starting at $0. For Your Humble Author, when we get to this slide in a face-to-face class, this is typically one of the most satisfying moments in the whole semester. Invariably, you can literally see the faces of at least a few students relax as they realize, “Hey! A 30% downturn ain’t so bad. I can handle it.”
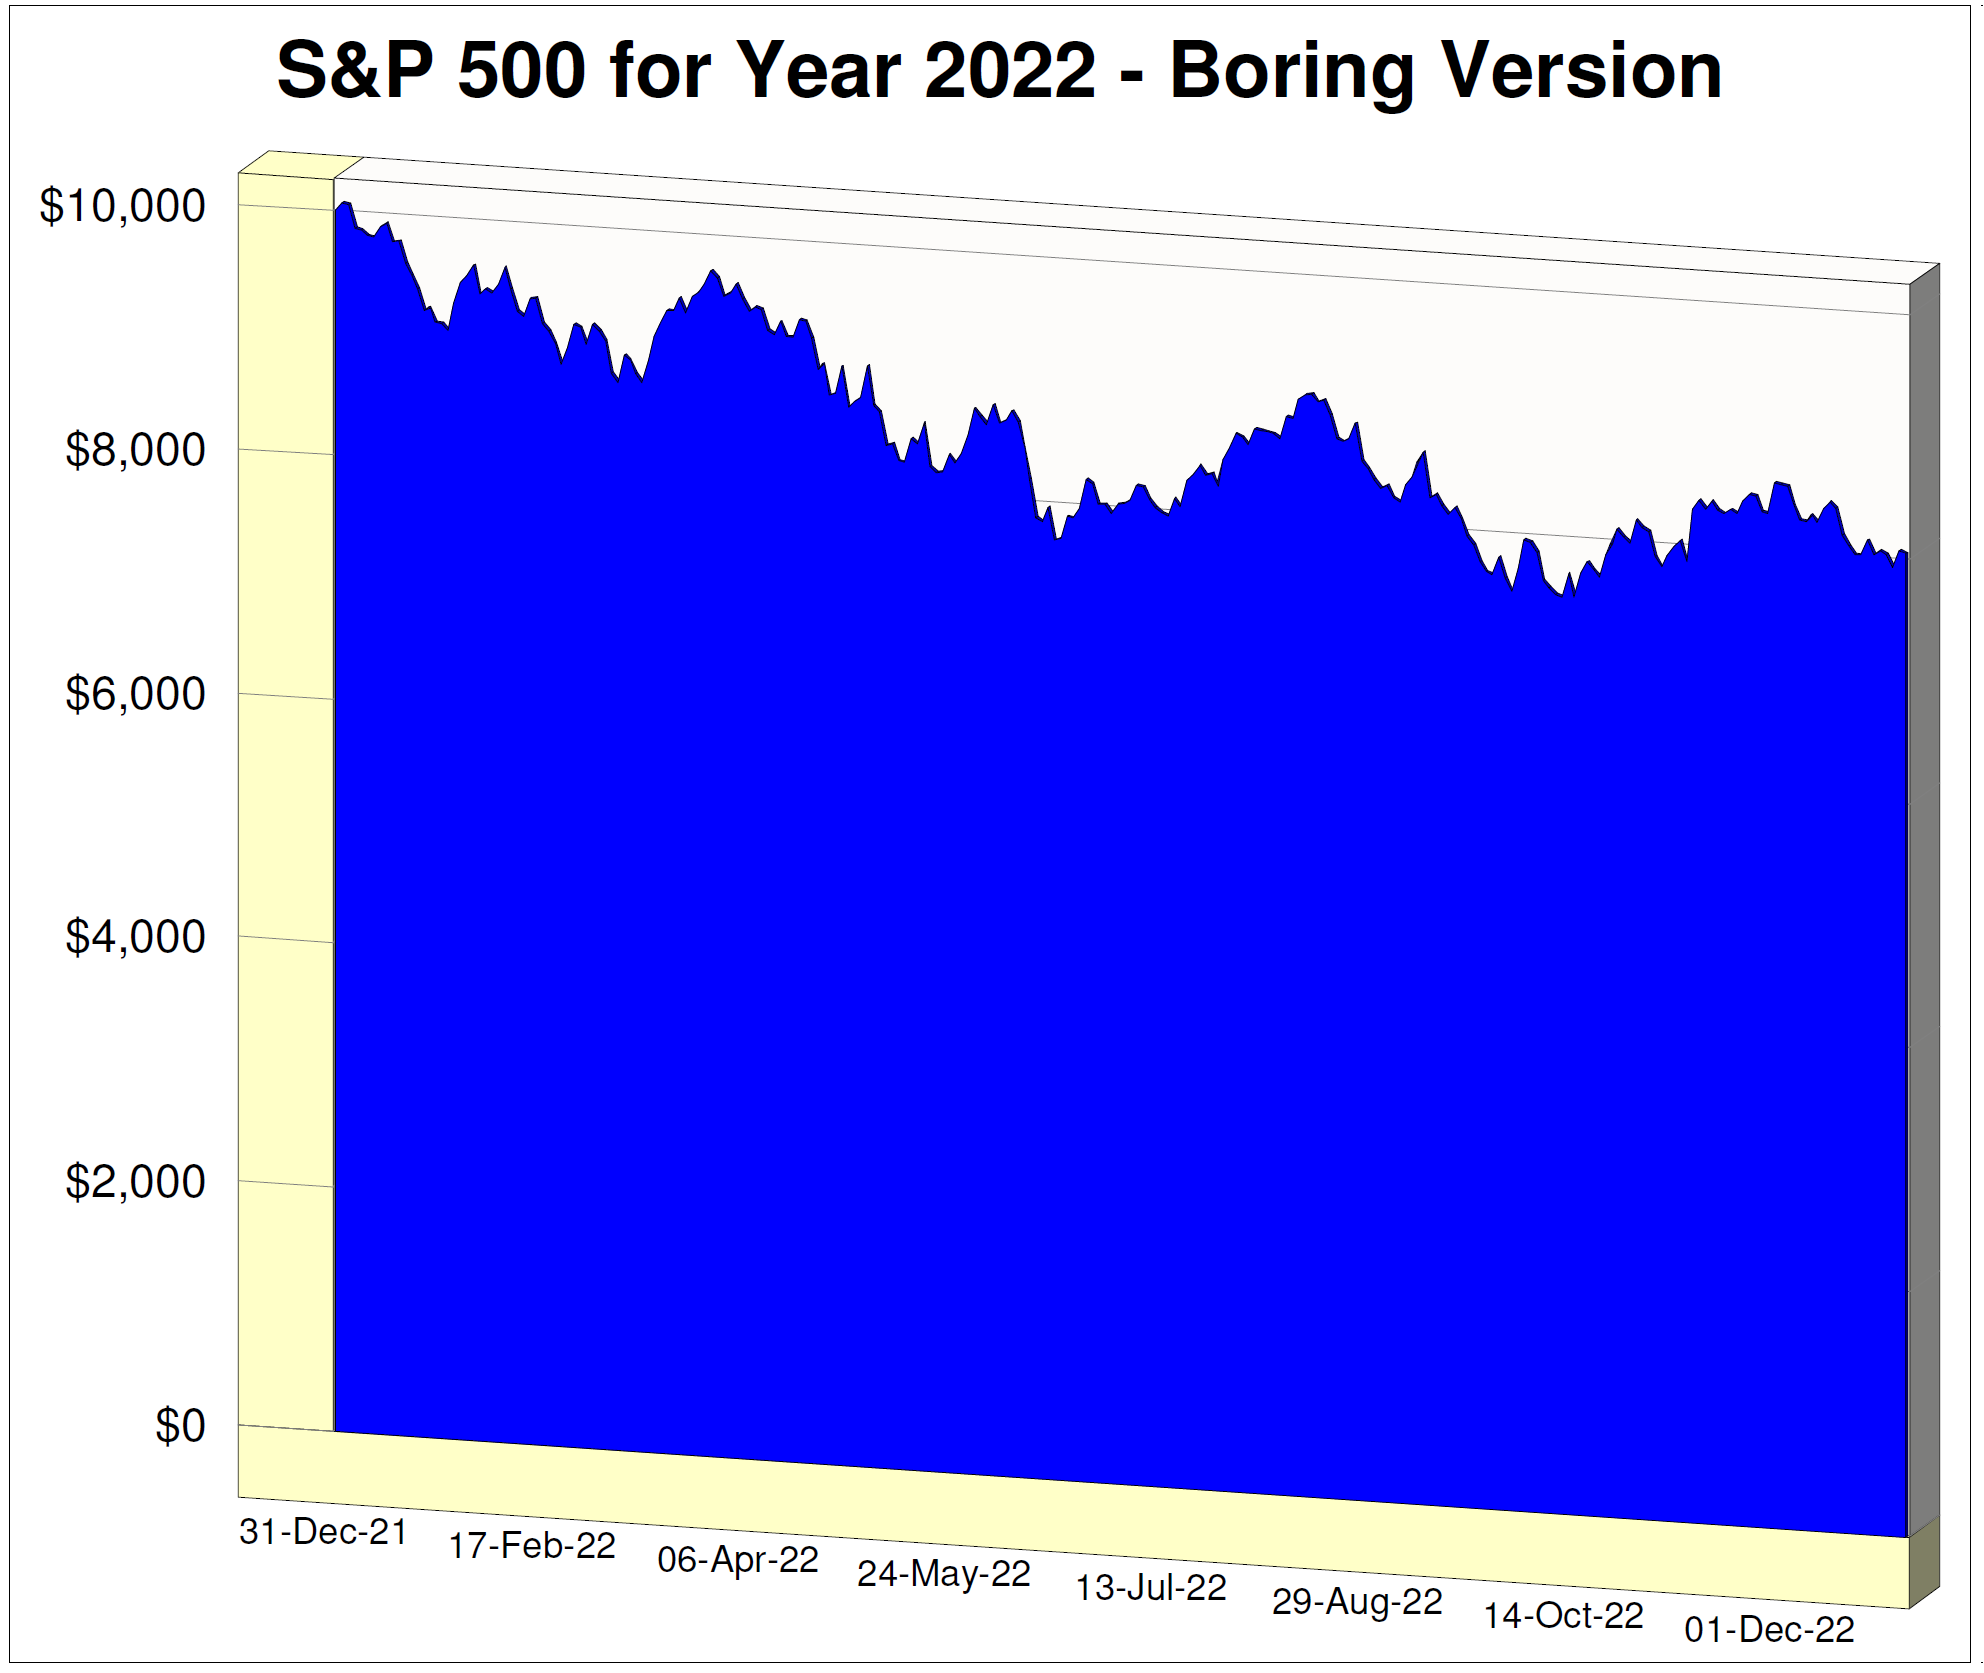
P.S. You won’t see this graph on the nightly financial news!