
11.1: A - Statistical Tables
- Page ID
- 79102
\( \newcommand{\vecs}[1]{\overset { \scriptstyle \rightharpoonup} {\mathbf{#1}} } \)
\( \newcommand{\vecd}[1]{\overset{-\!-\!\rightharpoonup}{\vphantom{a}\smash {#1}}} \)
\( \newcommand{\id}{\mathrm{id}}\) \( \newcommand{\Span}{\mathrm{span}}\)
( \newcommand{\kernel}{\mathrm{null}\,}\) \( \newcommand{\range}{\mathrm{range}\,}\)
\( \newcommand{\RealPart}{\mathrm{Re}}\) \( \newcommand{\ImaginaryPart}{\mathrm{Im}}\)
\( \newcommand{\Argument}{\mathrm{Arg}}\) \( \newcommand{\norm}[1]{\| #1 \|}\)
\( \newcommand{\inner}[2]{\langle #1, #2 \rangle}\)
\( \newcommand{\Span}{\mathrm{span}}\)
\( \newcommand{\id}{\mathrm{id}}\)
\( \newcommand{\Span}{\mathrm{span}}\)
\( \newcommand{\kernel}{\mathrm{null}\,}\)
\( \newcommand{\range}{\mathrm{range}\,}\)
\( \newcommand{\RealPart}{\mathrm{Re}}\)
\( \newcommand{\ImaginaryPart}{\mathrm{Im}}\)
\( \newcommand{\Argument}{\mathrm{Arg}}\)
\( \newcommand{\norm}[1]{\| #1 \|}\)
\( \newcommand{\inner}[2]{\langle #1, #2 \rangle}\)
\( \newcommand{\Span}{\mathrm{span}}\) \( \newcommand{\AA}{\unicode[.8,0]{x212B}}\)
\( \newcommand{\vectorA}[1]{\vec{#1}} % arrow\)
\( \newcommand{\vectorAt}[1]{\vec{\text{#1}}} % arrow\)
\( \newcommand{\vectorB}[1]{\overset { \scriptstyle \rightharpoonup} {\mathbf{#1}} } \)
\( \newcommand{\vectorC}[1]{\textbf{#1}} \)
\( \newcommand{\vectorD}[1]{\overrightarrow{#1}} \)
\( \newcommand{\vectorDt}[1]{\overrightarrow{\text{#1}}} \)
\( \newcommand{\vectE}[1]{\overset{-\!-\!\rightharpoonup}{\vphantom{a}\smash{\mathbf {#1}}}} \)
\( \newcommand{\vecs}[1]{\overset { \scriptstyle \rightharpoonup} {\mathbf{#1}} } \)
\( \newcommand{\vecd}[1]{\overset{-\!-\!\rightharpoonup}{\vphantom{a}\smash {#1}}} \)
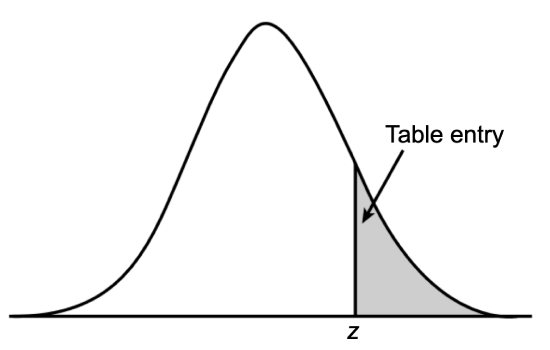
Standard Normal Probability Distribution: z Table
Numerical entries represent the one-tailed probability that a standard normal random variable exceeds |z| (image modified from z-table.com).
| z | Second decimal place of z | |||||||||
|---|---|---|---|---|---|---|---|---|---|---|
| .00 | .01 | .02 | .03 | .04 | .05 | .06 | .07 | .08 | .09 | |
| 0.0 | .5000 | .4960 | .4920 | .4880 | .4840 | .4801 | .4761 | .4721 | .4681 | .4641 |
| 0.1 | .4602 | .4562 | .4522 | .4483 | .4443 | .4404 | .4364 | .4325 | .4286 | .4247 |
| 0.2 | .4207 | .4168 | .4129 | .4090 | .4052 | .4013 | .3974 | .3936 | .3897 | .3859 |
| 0.3 | .3821 | .3783 | .3745 | .3707 | .3669 | .3632 | .3594 | .3557 | .3520 | .3483 |
| 0.4 | .3446 | .3409 | .3372 | .3336 | .3300 | .3264 | .3228 | .3192 | .3156 | .3121 |
| 0.5 | .3085 | .3050 | .3015 | .2981 | .2946 | .2912 | .2877 | .2843 | .2810 | .2776 |
| 0.6 | .2743 | .2709 | .2676 | .2643 | .2611 | .2578 | .2546 | .2514 | .2483 | .2451 |
| 0.7 | .2420 | .2389 | .2358 | .2327 | .2296 | .2266 | .2236 | .2206 | .2177 | .2148 |
| 0.8 | .2119 | .2090 | .2061 | .2033 | .2005 | .1977 | .1949 | .1922 | .1894 | .1867 |
| 0.9 | .1841 | .1814 | .1788 | .1762 | .1736 | .1711 | .1685 | .1660 | .1635 | .1611 |
| 1.0 | .1587 | .1562 | .1539 | .1515 | .1492 | .1469 | .1446 | .1423 | .1401 | .1379 |
| 1.1 | .1357 | .1335 | .1314 | .1292 | .1271 | .1251 | .1230 | .1210 | .1190 | .1170 |
| 1.2 | .1151 | .1131 | .1112 | .1093 | .1075 | .1056 | .1038 | .1020 | .1003 | .0985 |
| 1.3 | .0968 | .0951 | .0934 | .0918 | .0901 | .0885 | .0869 | .0853 | .0838 | .0823 |
| 1.4 | .0808 | .0793 | .0778 | .0764 | .0749 | .0735 | .0721 | .0708 | .0694 | .0681 |
| 1.5 | .0668 | .0655 | .0643 | .0630 | .0618 | .0606 | .0594 | .0582 | .0571 | .0559 |
| 1.6 | .0548 | .0537 | .0526 | .0516 | .0505 | .0495 | .0485 | .0475 | .0465 | .0455 |
| 1.7 | .0446 | .0436 | .0427 | .0418 | .0409 | .0401 | .0392 | .0384 | .0375 | .0367 |
| 1.8 | .0359 | .0351 | .0344 | .0336 | .0329 | .0322 | .0314 | .0307 | .0301 | .0294 |
| 1.9 | .0287 | .0281 | .0274 | .0268 | .0262 | .0256 | .0250 | .0244 | .0239 | .0233 |
| 2.0 | .0228 | .0222 | .0217 | .0212 | .0207 | .0202 | .0197 | .0192 | .0188 | .0183 |
| 2.1 | .0179 | .0174 | .0170 | .0166 | .0162 | .0158 | .0154 | .0150 | .0146 | .0143 |
| 2.2 | .0139 | .0136 | .0132 | .0129 | .0125 | .0122 | .0119 | .0116 | .0113 | .0110 |
| 2.3 | .0107 | .0104 | .0102 | .0099 | .0096 | .0094 | .0091 | .0089 | .0087 | .0084 |
| 2.4 | .0082 | .0080 | .0078 | .0075 | .0073 | .0071 | .0069 | .0068 | .0066 | .0064 |
| 2.5 | .0062 | .0060 | .0059 | .0057 | .0055 | .0054 | .0052 | .0051 | .0049 | .0048 |
| 2.6 | .0047 | .0045 | .0044 | .0043 | .0041 | .0040 | .0039 | .0038 | .0037 | .0036 |
| 2.7 | .0035 | .0034 | .0033 | .0032 | .0031 | .0030 | .0029 | .0028 | .0027 | .0026 |
| 2.8 | .0026 | .0025 | .0024 | .0023 | .0023 | .0022 | .0021 | .0021 | .0020 | .0019 |
| 2.9 | .0019 | .0018 | .0018 | .0017 | .0016 | .0016 | .0015 | .0015 | .0014 | .0014 |
| 3.0 | .00135 | |||||||||
| 3.5 | .000233 | |||||||||
| 4.0 | .0000317 | |||||||||
| 4.5 | .00000340 | |||||||||
| 5.0 | .000000287 | |||||||||
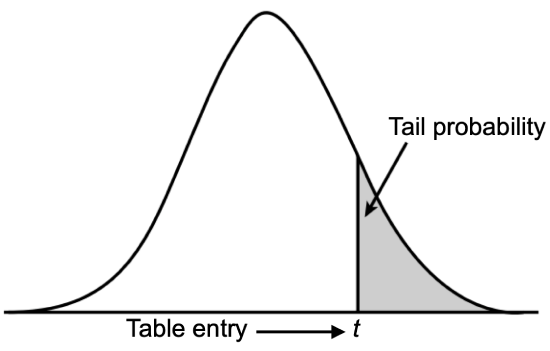
Student's t Distribution
The table shows the value of |t| that corresponds to the given one-tailed probabilities at varying degrees of freedom (df) (image modified from z-table.com).
| df | Confidence Level (Two-Tailed) | |||||
|---|---|---|---|---|---|---|
| 80% | 90% | 95% | 98% | 99% | 99.8% | |
| One-Tailed Probability | ||||||
| 0.10 | 0.05 | 0.025 | 0.01 | 0.005 | 0.001 | |
| 1 | 3.078 | 6.314 | 12.706 | 31.821 | 63.657 | 318.309 |
| 2 | 1.886 | 2.920 | 4.303 | 6.965 | 9.925 | 22.327 |
| 3 | 1.638 | 2.353 | 3.182 | 4.541 | 5.841 | 10.215 |
| 4 | 1.533 | 2.132 | 2.776 | 3.747 | 4.604 | 7.173 |
| 5 | 1.476 | 2.015 | 2.571 | 3.365 | 4.032 | 5.893 |
| 6 | 1.440 | 1.943 | 2.447 | 3.143 | 3.707 | 5.208 |
| 7 | 1.415 | 1.895 | 2.365 | 2.998 | 3.499 | 4.785 |
| 8 | 1.397 | 1.860 | 2.306 | 2.896 | 3.355 | 4.501 |
| 9 | 1.383 | 1.833 | 2.262 | 2.821 | 3.250 | 4.297 |
| 10 | 1.372 | 1.812 | 2.228 | 2.764 | 3.169 | 4.144 |
| 11 | 1.363 | 1.796 | 2.201 | 2.718 | 3.106 | 4.025 |
| 12 | 1.356 | 1.782 | 2.179 | 2.681 | 3.055 | 3.930 |
| 13 | 1.350 | 1.771 | 2.160 | 2.650 | 3.012 | 3.852 |
| 14 | 1.345 | 1.761 | 2.145 | 2.624 | 2.977 | 3.787 |
| 15 | 1.341 | 1.753 | 2.131 | 2.602 | 2.947 | 3.733 |
| 16 | 1.337 | 1.746 | 2.120 | 2.583 | 2.921 | 3.686 |
| 17 | 1.333 | 1.740 | 2.110 | 2.567 | 2.898 | 3.646 |
| 18 | 1.330 | 1.734 | 2.101 | 2.552 | 2.878 | 3.610 |
| 19 | 1.328 | 1.729 | 2.093 | 2.539 | 2.861 | 3.579 |
| 20 | 1.325 | 1.725 | 2.086 | 2.528 | 2.845 | 3.552 |
| 21 | 1.323 | 1.721 | 2.080 | 2.518 | 2.831 | 3.527 |
| 22 | 1.321 | 1.717 | 2.074 | 2.508 | 2.819 | 3.505 |
| 23 | 1.319 | 1.714 | 2.069 | 2.500 | 2.807 | 3.485 |
| 24 | 1.318 | 1.711 | 2.064 | 2.492 | 2.797 | 3.467 |
| 25 | 1.316 | 1.708 | 2.060 | 2.485 | 2.787 | 3.450 |
| 26 | 1.315 | 1.706 | 2.056 | 2.479 | 2.779 | 3.435 |
| 27 | 1.314 | 1.703 | 2.052 | 2.473 | 2.771 | 3.421 |
| 28 | 1.313 | 1.701 | 2.048 | 2.467 | 2.763 | 3.408 |
| 29 | 1.311 | 1.699 | 2.045 | 2.462 | 2.756 | 3.396 |
| 30 | 1.310 | 1.697 | 2.042 | 2.457 | 2.750 | 3.385 |
| 40 | 1.303 | 1.684 | 2.021 | 2.423 | 2.704 | 3.307 |
| 50 | 1.299 | 1.676 | 2.009 | 2.403 | 2.678 | 3.261 |
| 60 | 1.296 | 1.671 | 2.000 | 2.390 | 2.660 | 3.232 |
| 80 | 1.292 | 1.664 | 1.990 | 2.374 | 2.639 | 3.195 |
| 100 | 1.290 | 1.660 | 1.984 | 2.364 | 2.626 | 3.174 |
| ∞ | 1.282 | 1.645 | 1.960 | 2.326 | 2.576 | 3.090 |
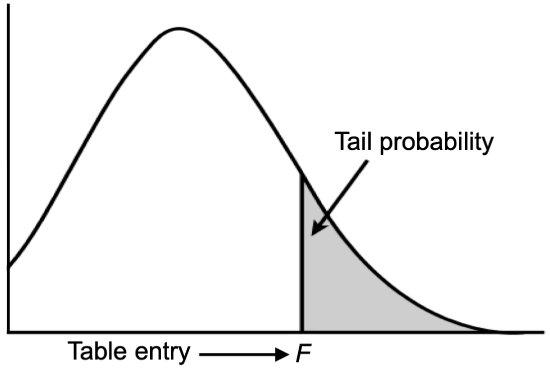
F Distribution
The table shows the value of F that corresponds to the given right-tailed probabilities at varying degrees of freedom (df1, df2) (image modified from z-table.com).
| df2 | α = .05 | |||||||||
|---|---|---|---|---|---|---|---|---|---|---|
| df1 | ||||||||||
| 1 | 2 | 3 | 4 | 5 | 6 | 8 | 12 | 24 | ∞ | |
| 1 | 161.45 | 199.50 | 215.71 | 224.58 | 230.16 | 233.99 | 238.88 | 243.91 | 249.05 | 254.31 |
| 2 | 18.51 | 19.00 | 19.16 | 19.25 | 19.30 | 19.33 | 19.37 | 19.41 | 19.45 | 19.50 |
| 3 | 10.13 | 9.55 | 9.28 | 9.12 | 9.01 | 8.94 | 8.85 | 8.74 | 8.64 | 8.53 |
| 4 | 7.71 | 6.94 | 6.59 | 6.39 | 6.26 | 6.16 | 6.04 | 5.91 | 5.77 | 5.63 |
| 5 | 6.61 | 5.79 | 5.41 | 5.19 | 5.05 | 4.95 | 4.82 | 4.68 | 4.53 | 4.37 |
| 6 | 5.99 | 5.14 | 4.76 | 4.53 | 4.39 | 4.28 | 4.15 | 4.00 | 3.84 | 3.67 |
| 7 | 5.59 | 4.74 | 4.35 | 4.12 | 3.97 | 3.87 | 3.73 | 3.57 | 3.41 | 3.23 |
| 8 | 5.32 | 4.46 | 4.07 | 3.84 | 3.69 | 3.58 | 3.44 | 3.28 | 3.12 | 2.93 |
| 9 | 5.12 | 4.26 | 3.86 | 3.63 | 3.48 | 3.37 | 3.23 | 3.07 | 2.90 | 2.71 |
| 10 | 4.96 | 4.10 | 3.71 | 3.48 | 3.33 | 3.22 | 3.07 | 2.91 | 2.74 | 2.54 |
| 11 | 4.84 | 3.98 | 3.59 | 3.36 | 3.20 | 3.09 | 2.95 | 2.79 | 2.61 | 2.40 |
| 12 | 4.75 | 3.89 | 3.49 | 3.26 | 3.11 | 3.00 | 2.85 | 2.69 | 2.51 | 2.30 |
| 13 | 4.67 | 3.81 | 3.41 | 3.18 | 3.03 | 2.92 | 2.77 | 2.60 | 2.42 | 2.21 |
| 14 | 4.60 | 3.74 | 3.34 | 3.11 | 2.96 | 2.85 | 2.70 | 2.53 | 2.35 | 2.13 |
| 15 | 4.54 | 3.68 | 3.29 | 3.06 | 2.90 | 2.79 | 2.64 | 2.48 | 2.29 | 2.07 |
| 16 | 4.49 | 3.63 | 3.24 | 3.01 | 2.85 | 2.74 | 2.59 | 2.42 | 2.24 | 2.01 |
| 17 | 4.45 | 3.59 | 3.20 | 2.96 | 2.81 | 2.70 | 2.55 | 2.38 | 2.19 | 1.96 |
| 18 | 4.41 | 3.55 | 3.16 | 2.93 | 2.77 | 2.66 | 2.51 | 2.34 | 2.15 | 1.92 |
| 19 | 4.38 | 3.52 | 3.13 | 2.90 | 2.74 | 2.63 | 2.48 | 2.31 | 2.11 | 1.88 |
| 20 | 4.35 | 3.49 | 3.10 | 2.87 | 2.71 | 2.60 | 2.45 | 2.28 | 2.08 | 1.84 |
| 21 | 4.32 | 3.47 | 3.07 | 2.84 | 2.68 | 2.57 | 2.42 | 2.25 | 2.05 | 1.81 |
| 22 | 4.30 | 3.44 | 3.05 | 2.82 | 2.66 | 2.55 | 2.40 | 2.23 | 2.03 | 1.78 |
| 23 | 4.28 | 3.42 | 3.03 | 2.80 | 2.64 | 2.53 | 2.37 | 2.20 | 2.01 | 1.76 |
| 24 | 4.26 | 3.40 | 3.01 | 2.78 | 2.62 | 2.51 | 2.36 | 2.18 | 1.98 | 1.73 |
| 25 | 4.24 | 3.39 | 2.99 | 2.76 | 2.60 | 2.49 | 2.34 | 2.16 | 1.96 | 1.71 |
| 26 | 4.23 | 3.37 | 2.98 | 2.74 | 2.59 | 2.47 | 2.32 | 2.15 | 1.95 | 1.69 |
| 27 | 4.21 | 3.35 | 2.96 | 2.73 | 2.57 | 2.46 | 2.31 | 2.13 | 1.93 | 1.67 |
| 28 | 4.20 | 3.34 | 2.95 | 2.71 | 2.56 | 2.45 | 2.29 | 2.12 | 1.91 | 1.65 |
| 29 | 4.18 | 3.33 | 2.93 | 2.70 | 2.55 | 2.43 | 2.28 | 2.10 | 1.90 | 1.64 |
| 30 | 4.17 | 3.32 | 2.92 | 2.69 | 2.53 | 2.42 | 2.27 | 2.09 | 1.89 | 1.62 |
| 40 | 4.08 | 3.23 | 2.84 | 2.61 | 2.45 | 2.34 | 2.18 | 2.00 | 1.79 | 1.51 |
| 60 | 4.00 | 3.15 | 2.76 | 2.53 | 2.37 | 2.25 | 2.10 | 1.92 | 1.70 | 1.39 |
| 120 | 3.92 | 3.07 | 2.68 | 2.45 | 2.29 | 2.18 | 2.02 | 1.83 | 1.61 | 1.25 |
| ∞ | 3.84 | 3.00 | 2.60 | 2.37 | 2.21 | 2.10 | 1.94 | 1.75 | 1.52 | 1.00 |
| df2 | α = .01 | |||||||||
|---|---|---|---|---|---|---|---|---|---|---|
| df1 | ||||||||||
| 1 | 2 | 3 | 4 | 5 | 6 | 8 | 12 | 24 | ∞ | |
| 1 | 4052.2 | 4999.5 | 5403.4 | 5624.6 | 5763.7 | 5859.0 | 5981.1 | 6106.3 | 6234.6 | 6365.9 |
| 2 | 98.50 | 99.00 | 99.17 | 99.25 | 99.30 | 99.33 | 99.37 | 99.42 | 99.46 | 99.50 |
| 3 | 34.12 | 30.82 | 29.46 | 28.71 | 28.24 | 27.91 | 27.49 | 27.05 | 26.60 | 26.13 |
| 4 | 21.20 | 18.00 | 16.69 | 15.98 | 15.52 | 15.21 | 14.80 | 14.37 | 13.93 | 13.46 |
| 5 | 16.26 | 13.27 | 12.06 | 11.39 | 10.97 | 10.67 | 10.29 | 9.89 | 9.47 | 9.02 |
| 6 | 13.75 | 10.93 | 9.78 | 9.15 | 8.75 | 8.47 | 8.10 | 7.72 | 7.31 | 6.88 |
| 7 | 12.25 | 9.55 | 8.45 | 7.85 | 7.46 | 7.19 | 6.84 | 6.47 | 6.07 | 5.65 |
| 8 | 11.26 | 8.65 | 7.59 | 7.01 | 6.63 | 6.37 | 6.03 | 5.67 | 5.28 | 4.86 |
| 9 | 10.56 | 8.02 | 6.99 | 6.42 | 6.06 | 5.80 | 5.47 | 5.11 | 4.73 | 4.31 |
| 10 | 10.04 | 7.56 | 6.55 | 5.99 | 5.64 | 5.39 | 5.06 | 4.71 | 4.33 | 3.91 |
| 11 | 9.65 | 7.21 | 6.22 | 5.67 | 5.32 | 5.07 | 4.74 | 4.40 | 4.02 | 3.60 |
| 12 | 9.33 | 6.93 | 5.95 | 5.41 | 5.06 | 4.82 | 4.50 | 4.16 | 3.78 | 3.36 |
| 13 | 9.07 | 6.70 | 5.74 | 5.21 | 4.86 | 4.62 | 4.30 | 3.96 | 3.59 | 3.17 |
| 14 | 8.86 | 6.52 | 5.56 | 5.04 | 4.70 | 4.46 | 4.14 | 3.80 | 3.43 | 3.00 |
| 15 | 8.68 | 6.36 | 5.42 | 4.89 | 4.56 | 4.32 | 4.00 | 3.67 | 3.29 | 2.87 |
| 16 | 8.53 | 6.23 | 5.29 | 4.77 | 4.44 | 4.20 | 3.89 | 3.55 | 3.18 | 2.75 |
| 17 | 8.40 | 6.11 | 5.19 | 4.67 | 4.34 | 4.10 | 3.79 | 3.46 | 3.08 | 2.65 |
| 18 | 8.29 | 6.01 | 5.09 | 4.58 | 4.25 | 4.02 | 3.71 | 3.37 | 3.00 | 2.57 |
| 19 | 8.19 | 5.93 | 5.01 | 4.50 | 4.17 | 3.94 | 3.63 | 3.30 | 2.93 | 2.49 |
| 20 | 8.10 | 5.85 | 4.94 | 4.43 | 4.10 | 3.87 | 3.56 | 3.23 | 2.86 | 2.42 |
| 21 | 8.02 | 5.78 | 4.87 | 4.37 | 4.04 | 3.81 | 3.51 | 3.17 | 2.80 | 2.36 |
| 22 | 7.95 | 5.72 | 4.82 | 4.31 | 3.99 | 3.76 | 3.45 | 3.12 | 2.75 | 2.31 |
| 23 | 7.88 | 5.66 | 4.77 | 4.26 | 3.94 | 3.71 | 3.41 | 3.07 | 2.70 | 2.26 |
| 24 | 7.82 | 5.61 | 4.72 | 4.22 | 3.90 | 3.67 | 3.36 | 3.03 | 2.66 | 2.21 |
| 25 | 7.77 | 5.57 | 4.68 | 4.18 | 3.86 | 3.63 | 3.32 | 2.99 | 2.62 | 2.17 |
| 26 | 7.72 | 5.53 | 4.64 | 4.14 | 3.82 | 3.59 | 3.29 | 2.96 | 2.59 | 2.13 |
| 27 | 7.68 | 5.49 | 4.60 | 4.11 | 3.79 | 3.56 | 3.26 | 2.93 | 2.55 | 2.10 |
| 28 | 7.64 | 5.45 | 4.57 | 4.07 | 3.75 | 3.53 | 3.23 | 2.90 | 2.52 | 2.06 |
| 29 | 7.60 | 5.42 | 4.54 | 4.05 | 3.73 | 3.50 | 3.20 | 2.87 | 2.50 | 2.03 |
| 30 | 7.56 | 5.39 | 4.51 | 4.02 | 3.70 | 3.47 | 3.17 | 2.84 | 2.47 | 2.01 |
| 40 | 7.31 | 5.18 | 4.31 | 3.83 | 3.51 | 3.29 | 2.99 | 2.67 | 2.29 | 1.81 |
| 60 | 7.08 | 4.98 | 4.13 | 3.65 | 3.34 | 3.12 | 2.82 | 2.50 | 2.12 | 1.60 |
| 120 | 6.85 | 4.79 | 3.95 | 3.48 | 3.17 | 2.96 | 2.66 | 2.34 | 1.95 | 1.38 |
| ∞ | 6.64 | 4.61 | 3.78 | 3.32 | 3.02 | 2.80 | 2.51 | 2.19 | 1.79 | 1.00 |
| df2 | α = .001 | |||||||||
|---|---|---|---|---|---|---|---|---|---|---|
| df1 | ||||||||||
| 1 | 2 | 3 | 4 | 5 | 6 | 8 | 12 | 24 | ∞ | |
| 1 | 405284 | 500000 | 540379 | 562500 | 576405 | 585937 | 598144 | 610668 | 623497 | 636619 |
| 2 | 998.50 | 999.00 | 999.17 | 999.25 | 999.30 | 999.33 | 999.37 | 999.42 | 999.46 | 999.50 |
| 3 | 167.03 | 148.50 | 141.11 | 137.10 | 134.58 | 132.85 | 130.62 | 128.32 | 125.93 | 123.50 |
| 4 | 74.14 | 61.25 | 56.18 | 53.44 | 51.71 | 50.53 | 49.00 | 47.41 | 45.77 | 44.05 |
| 5 | 47.18 | 37.12 | 33.20 | 31.09 | 29.75 | 28.83 | 27.65 | 26.42 | 25.13 | 23.78 |
| 6 | 35.51 | 27.00 | 23.70 | 21.92 | 20.80 | 20.03 | 19.03 | 17.99 | 16.90 | 15.75 |
| 7 | 29.25 | 21.69 | 18.77 | 17.20 | 16.21 | 15.52 | 14.63 | 13.71 | 12.73 | 11.69 |
| 8 | 25.41 | 18.49 | 15.83 | 14.39 | 13.48 | 12.86 | 12.05 | 11.19 | 10.30 | 9.34 |
| 9 | 22.86 | 16.39 | 13.90 | 12.56 | 11.71 | 11.13 | 10.37 | 9.57 | 8.72 | 7.81 |
| 10 | 21.04 | 14.91 | 12.55 | 11.28 | 10.48 | 9.93 | 9.20 | 8.45 | 7.64 | 6.76 |
| 11 | 19.69 | 13.81 | 11.56 | 10.35 | 9.58 | 9.05 | 8.35 | 7.63 | 6.85 | 6.00 |
| 12 | 18.64 | 12.97 | 10.80 | 9.63 | 8.89 | 8.38 | 7.71 | 7.00 | 6.25 | 5.42 |
| 13 | 17.82 | 12.31 | 10.21 | 9.07 | 8.35 | 7.86 | 7.21 | 6.52 | 5.78 | 4.97 |
| 14 | 17.14 | 11.78 | 9.73 | 8.62 | 7.92 | 7.44 | 6.80 | 6.13 | 5.41 | 4.60 |
| 15 | 16.59 | 11.34 | 9.34 | 8.25 | 7.57 | 7.09 | 6.47 | 5.81 | 5.10 | 4.31 |
| 16 | 16.12 | 10.97 | 9.01 | 7.94 | 7.27 | 6.80 | 6.19 | 5.55 | 4.85 | 4.06 |
| 17 | 15.72 | 10.66 | 8.73 | 7.68 | 7.02 | 6.56 | 5.96 | 5.32 | 4.63 | 3.85 |
| 18 | 15.38 | 10.39 | 8.49 | 7.46 | 6.81 | 6.35 | 5.76 | 5.13 | 4.45 | 3.67 |
| 19 | 15.08 | 10.16 | 8.28 | 7.27 | 6.62 | 6.18 | 5.59 | 4.97 | 4.29 | 3.52 |
| 20 | 14.82 | 9.95 | 8.10 | 7.10 | 6.46 | 6.02 | 5.44 | 4.82 | 4.15 | 3.38 |
| 21 | 14.59 | 9.77 | 7.94 | 6.95 | 6.32 | 5.88 | 5.31 | 4.70 | 4.03 | 3.26 |
| 22 | 14.38 | 9.61 | 7.80 | 6.81 | 6.19 | 5.76 | 5.19 | 4.58 | 3.92 | 3.15 |
| 23 | 14.20 | 9.47 | 7.67 | 6.70 | 6.08 | 5.65 | 5.09 | 4.48 | 3.82 | 3.05 |
| 24 | 14.03 | 9.34 | 7.55 | 6.59 | 5.98 | 5.55 | 4.99 | 4.39 | 3.74 | 2.97 |
| 25 | 13.88 | 9.22 | 7.45 | 6.49 | 5.89 | 5.46 | 4.91 | 4.31 | 3.66 | 2.89 |
| 26 | 13.74 | 9.12 | 7.36 | 6.41 | 5.80 | 5.38 | 4.83 | 4.24 | 3.59 | 2.82 |
| 27 | 13.61 | 9.02 | 7.27 | 6.33 | 5.73 | 5.31 | 4.76 | 4.17 | 3.52 | 2.75 |
| 28 | 13.50 | 8.93 | 7.19 | 6.25 | 5.66 | 5.24 | 4.69 | 4.11 | 3.46 | 2.70 |
| 29 | 13.39 | 8.85 | 7.12 | 6.19 | 5.59 | 5.18 | 4.64 | 4.05 | 3.41 | 2.64 |
| 30 | 13.29 | 8.77 | 7.05 | 6.12 | 5.53 | 5.12 | 4.58 | 4.00 | 3.36 | 2.59 |
| 40 | 12.61 | 8.25 | 6.59 | 5.70 | 5.13 | 4.73 | 4.21 | 3.64 | 3.01 | 2.23 |
| 60 | 11.97 | 7.77 | 6.17 | 5.31 | 4.76 | 4.37 | 3.86 | 3.32 | 2.69 | 1.90 |
| 120 | 11.38 | 7.32 | 5.78 | 4.95 | 4.42 | 4.04 | 3.55 | 3.02 | 2.40 | 1.56 |
| ∞ | 10.83 | 6.91 | 5.42 | 4.62 | 4.10 | 3.74 | 3.27 | 2.74 | 2.13 | 1.00 |