
21.4: Tracking and collecting data
- Page ID
- 43165

\( \newcommand{\vecs}[1]{\overset { \scriptstyle \rightharpoonup} {\mathbf{#1}} } \)
\( \newcommand{\vecd}[1]{\overset{-\!-\!\rightharpoonup}{\vphantom{a}\smash {#1}}} \)
\( \newcommand{\dsum}{\displaystyle\sum\limits} \)
\( \newcommand{\dint}{\displaystyle\int\limits} \)
\( \newcommand{\dlim}{\displaystyle\lim\limits} \)
\( \newcommand{\id}{\mathrm{id}}\) \( \newcommand{\Span}{\mathrm{span}}\)
( \newcommand{\kernel}{\mathrm{null}\,}\) \( \newcommand{\range}{\mathrm{range}\,}\)
\( \newcommand{\RealPart}{\mathrm{Re}}\) \( \newcommand{\ImaginaryPart}{\mathrm{Im}}\)
\( \newcommand{\Argument}{\mathrm{Arg}}\) \( \newcommand{\norm}[1]{\| #1 \|}\)
\( \newcommand{\inner}[2]{\langle #1, #2 \rangle}\)
\( \newcommand{\Span}{\mathrm{span}}\)
\( \newcommand{\id}{\mathrm{id}}\)
\( \newcommand{\Span}{\mathrm{span}}\)
\( \newcommand{\kernel}{\mathrm{null}\,}\)
\( \newcommand{\range}{\mathrm{range}\,}\)
\( \newcommand{\RealPart}{\mathrm{Re}}\)
\( \newcommand{\ImaginaryPart}{\mathrm{Im}}\)
\( \newcommand{\Argument}{\mathrm{Arg}}\)
\( \newcommand{\norm}[1]{\| #1 \|}\)
\( \newcommand{\inner}[2]{\langle #1, #2 \rangle}\)
\( \newcommand{\Span}{\mathrm{span}}\) \( \newcommand{\AA}{\unicode[.8,0]{x212B}}\)
\( \newcommand{\vectorA}[1]{\vec{#1}} % arrow\)
\( \newcommand{\vectorAt}[1]{\vec{\text{#1}}} % arrow\)
\( \newcommand{\vectorB}[1]{\overset { \scriptstyle \rightharpoonup} {\mathbf{#1}} } \)
\( \newcommand{\vectorC}[1]{\textbf{#1}} \)
\( \newcommand{\vectorD}[1]{\overrightarrow{#1}} \)
\( \newcommand{\vectorDt}[1]{\overrightarrow{\text{#1}}} \)
\( \newcommand{\vectE}[1]{\overset{-\!-\!\rightharpoonup}{\vphantom{a}\smash{\mathbf {#1}}}} \)
\( \newcommand{\vecs}[1]{\overset { \scriptstyle \rightharpoonup} {\mathbf{#1}} } \)
\(\newcommand{\longvect}{\overrightarrow}\)
\( \newcommand{\vecd}[1]{\overset{-\!-\!\rightharpoonup}{\vphantom{a}\smash {#1}}} \)
\(\newcommand{\avec}{\mathbf a}\) \(\newcommand{\bvec}{\mathbf b}\) \(\newcommand{\cvec}{\mathbf c}\) \(\newcommand{\dvec}{\mathbf d}\) \(\newcommand{\dtil}{\widetilde{\mathbf d}}\) \(\newcommand{\evec}{\mathbf e}\) \(\newcommand{\fvec}{\mathbf f}\) \(\newcommand{\nvec}{\mathbf n}\) \(\newcommand{\pvec}{\mathbf p}\) \(\newcommand{\qvec}{\mathbf q}\) \(\newcommand{\svec}{\mathbf s}\) \(\newcommand{\tvec}{\mathbf t}\) \(\newcommand{\uvec}{\mathbf u}\) \(\newcommand{\vvec}{\mathbf v}\) \(\newcommand{\wvec}{\mathbf w}\) \(\newcommand{\xvec}{\mathbf x}\) \(\newcommand{\yvec}{\mathbf y}\) \(\newcommand{\zvec}{\mathbf z}\) \(\newcommand{\rvec}{\mathbf r}\) \(\newcommand{\mvec}{\mathbf m}\) \(\newcommand{\zerovec}{\mathbf 0}\) \(\newcommand{\onevec}{\mathbf 1}\) \(\newcommand{\real}{\mathbb R}\) \(\newcommand{\twovec}[2]{\left[\begin{array}{r}#1 \\ #2 \end{array}\right]}\) \(\newcommand{\ctwovec}[2]{\left[\begin{array}{c}#1 \\ #2 \end{array}\right]}\) \(\newcommand{\threevec}[3]{\left[\begin{array}{r}#1 \\ #2 \\ #3 \end{array}\right]}\) \(\newcommand{\cthreevec}[3]{\left[\begin{array}{c}#1 \\ #2 \\ #3 \end{array}\right]}\) \(\newcommand{\fourvec}[4]{\left[\begin{array}{r}#1 \\ #2 \\ #3 \\ #4 \end{array}\right]}\) \(\newcommand{\cfourvec}[4]{\left[\begin{array}{c}#1 \\ #2 \\ #3 \\ #4 \end{array}\right]}\) \(\newcommand{\fivevec}[5]{\left[\begin{array}{r}#1 \\ #2 \\ #3 \\ #4 \\ #5 \\ \end{array}\right]}\) \(\newcommand{\cfivevec}[5]{\left[\begin{array}{c}#1 \\ #2 \\ #3 \\ #4 \\ #5 \\ \end{array}\right]}\) \(\newcommand{\mattwo}[4]{\left[\begin{array}{rr}#1 \amp #2 \\ #3 \amp #4 \\ \end{array}\right]}\) \(\newcommand{\laspan}[1]{\text{Span}\{#1\}}\) \(\newcommand{\bcal}{\cal B}\) \(\newcommand{\ccal}{\cal C}\) \(\newcommand{\scal}{\cal S}\) \(\newcommand{\wcal}{\cal W}\) \(\newcommand{\ecal}{\cal E}\) \(\newcommand{\coords}[2]{\left\{#1\right\}_{#2}}\) \(\newcommand{\gray}[1]{\color{gray}{#1}}\) \(\newcommand{\lgray}[1]{\color{lightgray}{#1}}\) \(\newcommand{\rank}{\operatorname{rank}}\) \(\newcommand{\row}{\text{Row}}\) \(\newcommand{\col}{\text{Col}}\) \(\renewcommand{\row}{\text{Row}}\) \(\newcommand{\nul}{\text{Nul}}\) \(\newcommand{\var}{\text{Var}}\) \(\newcommand{\corr}{\text{corr}}\) \(\newcommand{\len}[1]{\left|#1\right|}\) \(\newcommand{\bbar}{\overline{\bvec}}\) \(\newcommand{\bhat}{\widehat{\bvec}}\) \(\newcommand{\bperp}{\bvec^\perp}\) \(\newcommand{\xhat}{\widehat{\xvec}}\) \(\newcommand{\vhat}{\widehat{\vvec}}\) \(\newcommand{\uhat}{\widehat{\uvec}}\) \(\newcommand{\what}{\widehat{\wvec}}\) \(\newcommand{\Sighat}{\widehat{\Sigma}}\) \(\newcommand{\lt}{<}\) \(\newcommand{\gt}{>}\) \(\newcommand{\amp}{&}\) \(\definecolor{fillinmathshade}{gray}{0.9}\)A key problem with tracking users on websites used to be that it was impossible to track individual users - only individual browsers, or devices, since this is done through cookies. So, if Joe visits the website from Chrome on his home computer and Safari on his work laptop, the website will think he’s two different users. If Susan visits the site from the home computer, also using Chrome, the website will think she’s the same user as Joe, because the cookie set when Joe visited the site will still be there.
Email opens aren’t tracked with cookies. Instead, when the images in the email load, a tiny 1×1 pixel also loads and tracks open rate. This means that if the user is blocking images, their activity will not be tracked.
To track if those who did open your email then visited your page, or eventually converted, links within the email include utm tags. UTM tags are codes in the url that enable your analytics software to track where a user has come from.
In this link: www.redandyellow.co.za/5-way...ium=email&utm_ campaign=AugNewsletter
The campaign tracking tag appended on the end of the URL is: ?utm_source=newsletter&utm_medium=email&utm_campaign=AugNewsletter
An additional concern was the decline of cookies. Most modern browsers allow users to block them. With growing consumer privacy concerns, and laws like the EU Privacy Directive, which requires all European websites to disclose their cookie usage, cookies began to fall out of favour, making tracking more difficult.
Google’s Universal Analytics changed all that. Because of Google’s dominance in the search engine market, we will focus on them for this section.
Universal analytics
Google’s universal analytics allows you to track visitors (that means real people) rather than simply sessions. By creating a unique identifier for each customer, universal analytics means you can track the user’s full journey with the brand, regardless of the device or browser they use. You can track Joe on his home computer, work laptop, mobile phone during his lunch break, and even when he swipes his loyalty card at the point of sale allowing you to combine offline and online information about users.
Crucially, however, tracking Joe across devices requires both universal analytics and authentication on the site across devices, in other words, Joe has to be logged in to your website or online tool on his desktop, work laptop and mobile phone in order to be tracked this way. If he doesn’t log in, we won’t know he’s the same person. Users who use Gmail are easy for Google to track because they’ll be logged in across devices.
You can see:
- How visitors behave depending on the device they use (browsing for quick ideas on their smartphone, but checking out through the eCommerce portal on their desktop).
- How visitor behaviour changes the longer they are a fan of the brand, do they come back more often, for longer, or less often but with a clearer purpose?
- How often they’re really interacting with your brand.
- What their lifetime value and engagement is.
Another useful feature of universal analytics is that it allows you to import data from other sources into Google Analytics, for example, CRM information or data from a point-of-sale cash register. This gives a much broader view of the customers and lets you see a more direct link between your online efforts and real-world behaviour.
How does universal analytics work?
Universal analytics has three versions of the tracking code that developers can implement, helping them track users on:
- Websites
- Mobile apps
- Other digital devices such as game consoles and even information kiosks.
It collects information from three sources to provide the information that you can access from your Google Analytics account:
- The HTTP request of the user: This contains details about the browser and the computer making the request, including language, hostname, and referrer.
What kind of privacy concerns might a user have about the data you’re collecting about them?
- Browser and system information: This includes support for Java and Flash and screen resolution.
- First-party cookies: Analytics sets and read these cookies to obtain user session and ad campaign information.
This information is sent to the Google Analytics servers as a list of parameters attached to a one-pixel GIF image request.
You don’t need to know the technical details of how tracking works, but if you are interested, you can read about Google Analytics tracking here: developers. google.com/analytics/resources/concepts/gaConceptsTrackingOverview
How to set up Google Analytics
You will need to make adjustments to your Analytics account so that you can get the most out of tracking your users. You can learn a little more about that here: moz.com/blog/absolutebeginners-guide-togoogle-analytics.
First, you need a primary Google account, used for services such as Gmail or YouTube. You can use this to set up your Analytics account. This should be set up using a Google account that will always be available for your business.
Next, go to www.google.com/analytics and follow the steps to sign up. You can set up multiple accounts here if you want to track a website, an app, or multiple websites and apps.
After the sign-up process, you will be issued a Google Analytics tracking ID. This will be UA followed by a series of numbers. You need to add this code to the HTML file of your website, before the </head> tag, on each of your pages.
Now Google is tracking every visitor to your website!
Try it now – go to a random website, such as www.redandyellow. co.za, and right click on it, then click ’View page source’ to view the HTML code for the site. Do a search for ’UA-‘ to view the tracking code for that site. The tracking code for the website above is UA-43748615-1.
Google Analytics is, obviously, not the only analytics package available. Other packages exist for detailed tracking of social media accounts, emails, and website data. Website analysis should always account for any campaigns being run. For example, generating high traffic volumes by employing various digital marketing tactics such as SEO, PPC, and email marketing can be a pointless and costly exercise if visitors are leaving your site without achieving one or more of your website’s goals. Conversion optimisation aims to convert as many of a website’s visitors as possible into active customers.
Gathering data
Google Analytics can measure almost anything about the customers that visit your website. To gather the kind of data that can help you optimise your site, you’ll need to know a little about where to look. When you log into your analytics account, you will see seven main menu items on the left. They are:
Read more about this in the Conversion optimisation chapter.
Views
The Views button lets you switch between various pictures of the data.

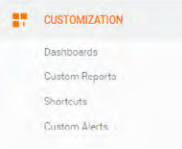
Customization
The Customization tab lets you create dashboards that give you an overview of different data elements, custom reports, shortcuts, or custom alerts.
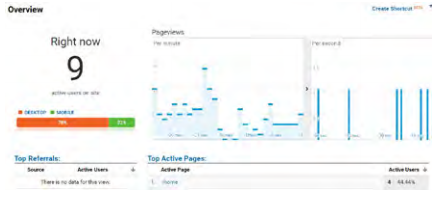
Real time
Real time allows you to monitor activity as it happens on your website. Data updates continuously so that you can see how many users are on your site right now, where they are from, the keywords and sites that referred them, which pages they are viewing, and what conversions are happening.
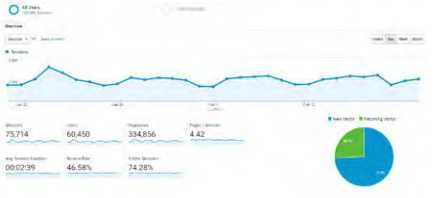
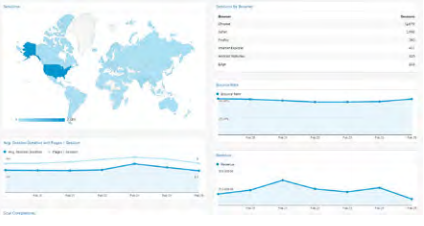
Audience
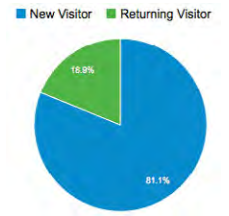
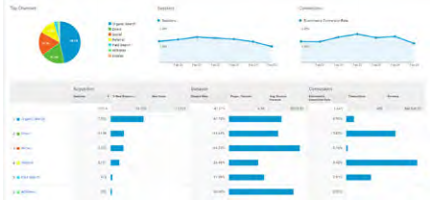
The audience section helps you understand the characteristics of your audience, including their demographics, interests, behaviour (level of engagement). The mix of new and returning users and how their behaviour differs, and the browsers, networks and mobile devices they are using to access your site.
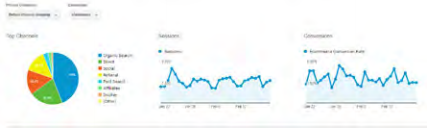
Acquisition
Acquisition lets you compare traffic from search, referrals, email, and marketing campaigns. It shows you which sources drive the most traffic to your site.
Behaviour
This section shows how users interact with your content, how the content performs, its searchability and its interactivity. You can see how fast your pages load, how successful users are when searching the site, how any interactive elements on your site are being used, popular content, which pages drive revenue, and more.
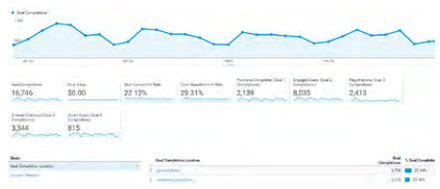
Conversions
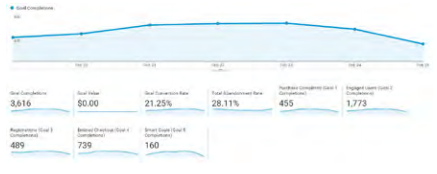
Conversions does exactly what it says on the box, it shows you how users are converting on your site. You can look at:
- The Goals tab, which shows how well your site meets business objectives
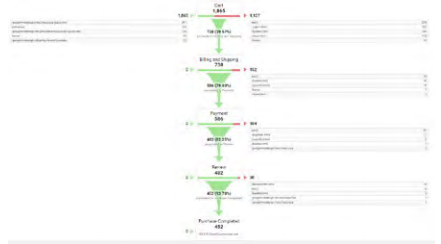
- The eCommerce tab, which shows what your visitors buy and can link it to other data to show what drives your revenue
- Multi-channel funnels, which shows how your channels work together to generate sales and conversions (for example, if a customer sees a display ad about your brand, visits your site to do research, and later does a search for a specific product before converting)
- Attribution, which shows you how traffic from various channels converts.
You can play around on Google’s Analytics site using their free demo account, here: https:// analytics.google. com/analytics/web/ demoAccount.
The type of information captured
By now, you should know the difference between objectives, goals, KPIs, and targets. KPIs are what you’ll be focusing on when you measure data that has been captured.
KPIs are the metrics that help you understand how well you are meeting your objectives. A metric is a defined unit of measurement. Definitions can vary between various web analytics vendors depending on their approach to gathering data, but the standard definitions are provided here.
Web analytics metrics are divided into:
- Counts: These are the raw figures that will be used for analysis.
- Ratios: These are interpretations of the data that is counted.
Metrics can be applied to three different groupings:
- Aggregate: All traffic to the website for a defined period of time.
- Segmented: A subset of all traffic according to a specific filter, such as by campaign (PPC) or visitor type (new visitor vs. returning visitor).
- Individual: The activity of a single visitor for a defined period of time.
Here are some of the key metrics you will need to get started on with website analytics.
Building-block terms
These are the most basic web metrics. They tell you how much traffic your website is receiving. For example, looking at returning visitors can tell you how well your website creates loyalty; a website needs to grow the number of visitors who come back. An exception may be a support website where repeat visitors could indicate that the website has not been successful in solving the visitor’s problem. Each website needs to be analysed based on its purpose.
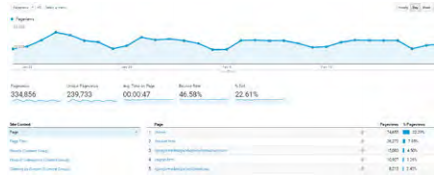
- Traffic: The number of users that visit a website
- Page: Unit of content (so downloads and Flash files can be defined as pages).
- Page views: The number of times a page was successfully requested.
- Session: An interaction by an individual with a website consisting of one or more page views within a specified period of time.
- Unique visitors: The number of individual users visiting the website one or more times within a set period of time. Each individual is counted only once.
- New visitor: A unique visitor who visits the website for the first time ever in the period of time being analysed.
New visitors show that you are reaching new audiences and markets, while returning visitors are an indicator of brand loyalty. Most websites should aim for a healthy balance between the two.
- Returning visitor: A unique visitor who makes two or more visits (on the same device and browser) within the time period being analysed.
Visit characteristics
These are some of the metrics that tell you how visitors reach your website, and how they move through the website. The way that a visitor navigates a website is called a click path. Looking at the referrers, both external and internal, allows you to gauge the click path that visitors take.
- Entry page: The first page of a visit.
- Landing page: The page intended to identify the beginning of the user experience resulting from a defined marketing effort.
- Exit page: The last page of a visit.
- Visit duration: The length of time in a session.
- Referrer: The URL that originally generated the request for the current page.
- Internal referrer: A URL that is part of the same website.
- External referrer: A URL that is outside of the website.
- Search referrer: A URL that is generated by a search function.
- Visit referrer: A URL that originated from a particular visit.
- Original referrer: A URL that sent a new visitor to the website.
- Clickthrough: The number of times a link was clicked by a visitor.
- Clickthrough rate: The number of times a link was clicked divided by the number of times it was seen (impressions).
- Page views per visit: The number of page views in a reporting period divided by the number of visits in that same period to get an average of how many pages being viewed per visit.
Content characteristics
When a visitor views a page, they have two options: leave the website, or view another page on the website. These metrics tell you how visitors react to your content. Bounce rate can be one of the most important metrics that you measure. There are a few exceptions, but a high bounce rate usually means high dissatisfaction with a web page.
A high bounce rate is not always bad. On a blog, for example, most users click through from a search to read one article and, having satisfied their curiosity, leave without visiting any other pages.
- Page exit ratio: Number of exits from a page divided by total number of page views of that page
- Single page visits: Visits that consist of one page, even if that page was viewed a number of times
- Bounces (or single page view visits): Visits consisting of a single page view
- Bounce rate: Single page view visits divided by entry pages.
- Conversion metrics: These metrics give insight into whether you are achieving your analytics goals (and through those, you overall website objectives).
- Event: A recorded action that has a specific time assigned to it by the browser or the server.
- Conversion: A visitor completing a target action.
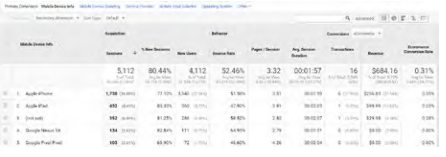
Mobile metrics
When it comes to mobile data, there are no special, new or different metrics to use. However, you will probably be focusing your attention on some key aspects that are particularly relevant here namely, technologies and the user experience.
Why do you think Google Analytics has a separate category for tablets, rather than including them under mobile devices?
- Device category: Whether the visit came from a desktop, mobile or tablet device
- Mobile device info: The specific brand and make of the mobile device
- Mobile input selector: The main input method for the device (such as touchscreen, click wheel, stylus)
- Operating system: The OS that the device uses to run, sch as iOS or Android.
Now that you know what tracking is, you can use your objectives and KPIs to define what metrics you’ll be tracking. You’ll then need to analyse these results, and take appropriate actions. Then the testing begins again!