3.2: Income Statements for Manufacturing Companies
- Page ID
- 67590
\( \newcommand{\vecs}[1]{\overset { \scriptstyle \rightharpoonup} {\mathbf{#1}} } \)
\( \newcommand{\vecd}[1]{\overset{-\!-\!\rightharpoonup}{\vphantom{a}\smash {#1}}} \)
\( \newcommand{\id}{\mathrm{id}}\) \( \newcommand{\Span}{\mathrm{span}}\)
( \newcommand{\kernel}{\mathrm{null}\,}\) \( \newcommand{\range}{\mathrm{range}\,}\)
\( \newcommand{\RealPart}{\mathrm{Re}}\) \( \newcommand{\ImaginaryPart}{\mathrm{Im}}\)
\( \newcommand{\Argument}{\mathrm{Arg}}\) \( \newcommand{\norm}[1]{\| #1 \|}\)
\( \newcommand{\inner}[2]{\langle #1, #2 \rangle}\)
\( \newcommand{\Span}{\mathrm{span}}\)
\( \newcommand{\id}{\mathrm{id}}\)
\( \newcommand{\Span}{\mathrm{span}}\)
\( \newcommand{\kernel}{\mathrm{null}\,}\)
\( \newcommand{\range}{\mathrm{range}\,}\)
\( \newcommand{\RealPart}{\mathrm{Re}}\)
\( \newcommand{\ImaginaryPart}{\mathrm{Im}}\)
\( \newcommand{\Argument}{\mathrm{Arg}}\)
\( \newcommand{\norm}[1]{\| #1 \|}\)
\( \newcommand{\inner}[2]{\langle #1, #2 \rangle}\)
\( \newcommand{\Span}{\mathrm{span}}\) \( \newcommand{\AA}{\unicode[.8,0]{x212B}}\)
\( \newcommand{\vectorA}[1]{\vec{#1}} % arrow\)
\( \newcommand{\vectorAt}[1]{\vec{\text{#1}}} % arrow\)
\( \newcommand{\vectorB}[1]{\overset { \scriptstyle \rightharpoonup} {\mathbf{#1}} } \)
\( \newcommand{\vectorC}[1]{\textbf{#1}} \)
\( \newcommand{\vectorD}[1]{\overrightarrow{#1}} \)
\( \newcommand{\vectorDt}[1]{\overrightarrow{\text{#1}}} \)
\( \newcommand{\vectE}[1]{\overset{-\!-\!\rightharpoonup}{\vphantom{a}\smash{\mathbf {#1}}}} \)
\( \newcommand{\vecs}[1]{\overset { \scriptstyle \rightharpoonup} {\mathbf{#1}} } \)
\( \newcommand{\vecd}[1]{\overset{-\!-\!\rightharpoonup}{\vphantom{a}\smash {#1}}} \)
Learning Objectives
- Describe how to prepare an income statement for a manufacturing company.
Exercise \(\PageIndex{1}\)
Companies that provide services, such as Ernst & Young (accounting) and Accenture LLP (consulting), do not sell goods and therefore have no inventory. The accounting process and income statement for service companies are relatively simple. Merchandising companies (also called retail companies) like Macy’s and Home Depot buy and sell goods but typically do not manufacture goods. Since merchandising companies must account for the purchase and sale of goods, their accounting systems are more complex than those of service companies. Manufacturing companies, such as Johnson & Johnson and Honda Motor Company, produce and sell goods. Such companies require an accounting system that goes well beyond accounting solely for the purchase and sale of goods. Why are accounting systems more complex for manufacturing companies?
- Answer
-
Accounting systems are more complex for manufacturing companies because they need a system that tracks manufacturing costs throughout the production process to the point at which goods are sold. Since income statements for manufacturing companies tend to be more complex than for service or merchandising companies, we devote this section to income statements for manufacturing companies. Understanding income statements in a manufacturing setting begins with the inventory cost flow equation.
Inventory Cost Flow Equation
Exercise \(\PageIndex{2}\)
How do companies use the cost flow equation to calculate unknown balances?
- Answer
-
We can use the basic cost flow equation to calculate unknown balances for just about any balance sheet account (e.g., cash, accounts receivable, and inventory). The equation is as follows: Beginning balance (BB) + Transfers in (TI) – Ending balance (EB) = Transfers out (TO)
We will apply this equation to the three inventory asset accounts discussed earlier (raw materials, work in process, and finished goods) to calculate the cost of raw materials used in production, cost of goods manufactured, and cost of goods sold.
Raw materials used in production shows the cost of direct and indirect materials placed into the production process. Cost of goods manufactured represents the cost of goods completed and transferred out of work-in-process (WIP) inventory into finished goods inventory. Cost of goods sold represents the cost of goods that are sold and transferred out of finished goods inventory into cost of goods sold.
Accountants need all these amounts—raw materials placed in production, cost of goods manufactured, and cost of goods sold—to prepare an income statement for a manufacturing company. We describe how to calculate these amounts using three formal schedules in the following order:
- Schedule of raw materials placed in production
- Schedule of cost of goods manufactured
- Schedule of cost of goods sold
Exercise \(\PageIndex{3}\)
The basic cost flow equation can be used in three supporting schedules to help us determine the cost of goods sold amount on the income statement for manufacturing companies. What information is included in these schedules, and what do they look like for Custom Furniture Company?
- Answer
-
Figure 3.2.1 shows these three schedules for Custom Furniture Company for the month of May. As you review these schedules, note that each schedule provides information required for the next schedule, as indicated by the arrows. Remember the inventory cost flow equation is used for each schedule. This is why you see abbreviations for each element of the equation: beginning balance (BB), transfers in (TI), ending balance (EB), and transfers out (TO).
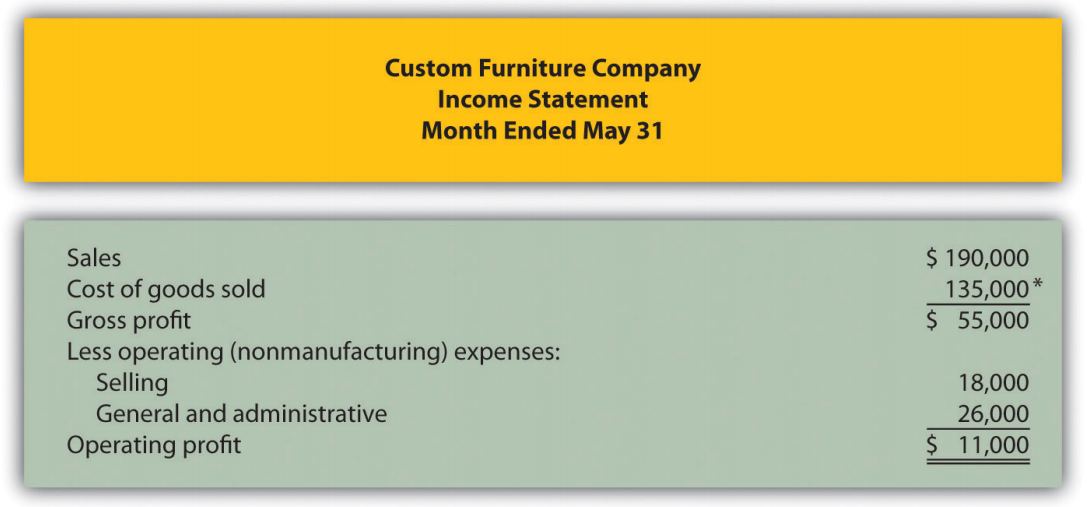
The goal of going through the process shown in Figure 3.2.1 is to arrive at a cost of goods sold amount, which is presented on the income statement. Custom Furniture Company’s income statement for the month ended May 31 is shown in Figure 3.2.2. As you review Figure 3.2.1 and Figure 3.2.2, look back at Figure 3.1.1 to see how costs flow through the three inventory accounts and the cost of goods sold account.
Later, we will provide the detailed information necessary to prepare the schedules and income statement presented in Figure 3.2.1 and Figure 3.2.2. At this point, your job is to understand how we use the inventory cost flow equation to calculate raw materials placed in production, cost of goods manufactured, and cost of goods sold. (Note: Companies using a perpetual inventory system do not necessarily prepare these formal schedules because perpetual systems update records immediately when inventory is transferred from one inventory account to another. However, these companies take a physical count periodically to ensure the accuracy of inventory accounts and use the cost flow equation and similar schedules to ensure their perpetual system balances are accurate.
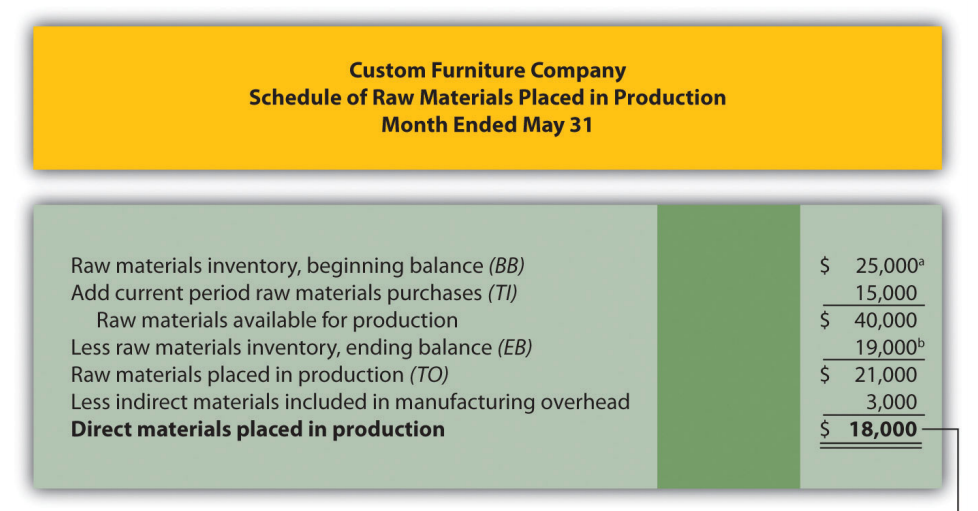

Figure \(\PageIndex{1}\): Income Statement Schedules for Custom Furniture Company
a From the company’s balance sheet at April 30 (April 30 ending balance is the same as May 1 beginning balance).
b From the company’s balance sheet on May 31.
c This is actual manufacturing overhead for the period and includes indirect materials, indirect labor, factory rent, factory utilities, and other factory-related expenses for the month. Later, we will look at an alternative approach to recording manufacturing overhead called normal costing.