
13.1: Introduction
- Page ID
- 24549
\( \newcommand{\vecs}[1]{\overset { \scriptstyle \rightharpoonup} {\mathbf{#1}} } \)
\( \newcommand{\vecd}[1]{\overset{-\!-\!\rightharpoonup}{\vphantom{a}\smash {#1}}} \)
\( \newcommand{\id}{\mathrm{id}}\) \( \newcommand{\Span}{\mathrm{span}}\)
( \newcommand{\kernel}{\mathrm{null}\,}\) \( \newcommand{\range}{\mathrm{range}\,}\)
\( \newcommand{\RealPart}{\mathrm{Re}}\) \( \newcommand{\ImaginaryPart}{\mathrm{Im}}\)
\( \newcommand{\Argument}{\mathrm{Arg}}\) \( \newcommand{\norm}[1]{\| #1 \|}\)
\( \newcommand{\inner}[2]{\langle #1, #2 \rangle}\)
\( \newcommand{\Span}{\mathrm{span}}\)
\( \newcommand{\id}{\mathrm{id}}\)
\( \newcommand{\Span}{\mathrm{span}}\)
\( \newcommand{\kernel}{\mathrm{null}\,}\)
\( \newcommand{\range}{\mathrm{range}\,}\)
\( \newcommand{\RealPart}{\mathrm{Re}}\)
\( \newcommand{\ImaginaryPart}{\mathrm{Im}}\)
\( \newcommand{\Argument}{\mathrm{Arg}}\)
\( \newcommand{\norm}[1]{\| #1 \|}\)
\( \newcommand{\inner}[2]{\langle #1, #2 \rangle}\)
\( \newcommand{\Span}{\mathrm{span}}\) \( \newcommand{\AA}{\unicode[.8,0]{x212B}}\)
\( \newcommand{\vectorA}[1]{\vec{#1}} % arrow\)
\( \newcommand{\vectorAt}[1]{\vec{\text{#1}}} % arrow\)
\( \newcommand{\vectorB}[1]{\overset { \scriptstyle \rightharpoonup} {\mathbf{#1}} } \)
\( \newcommand{\vectorC}[1]{\textbf{#1}} \)
\( \newcommand{\vectorD}[1]{\overrightarrow{#1}} \)
\( \newcommand{\vectorDt}[1]{\overrightarrow{\text{#1}}} \)
\( \newcommand{\vectE}[1]{\overset{-\!-\!\rightharpoonup}{\vphantom{a}\smash{\mathbf {#1}}}} \)
\( \newcommand{\vecs}[1]{\overset { \scriptstyle \rightharpoonup} {\mathbf{#1}} } \)
\( \newcommand{\vecd}[1]{\overset{-\!-\!\rightharpoonup}{\vphantom{a}\smash {#1}}} \)
\(\newcommand{\avec}{\mathbf a}\) \(\newcommand{\bvec}{\mathbf b}\) \(\newcommand{\cvec}{\mathbf c}\) \(\newcommand{\dvec}{\mathbf d}\) \(\newcommand{\dtil}{\widetilde{\mathbf d}}\) \(\newcommand{\evec}{\mathbf e}\) \(\newcommand{\fvec}{\mathbf f}\) \(\newcommand{\nvec}{\mathbf n}\) \(\newcommand{\pvec}{\mathbf p}\) \(\newcommand{\qvec}{\mathbf q}\) \(\newcommand{\svec}{\mathbf s}\) \(\newcommand{\tvec}{\mathbf t}\) \(\newcommand{\uvec}{\mathbf u}\) \(\newcommand{\vvec}{\mathbf v}\) \(\newcommand{\wvec}{\mathbf w}\) \(\newcommand{\xvec}{\mathbf x}\) \(\newcommand{\yvec}{\mathbf y}\) \(\newcommand{\zvec}{\mathbf z}\) \(\newcommand{\rvec}{\mathbf r}\) \(\newcommand{\mvec}{\mathbf m}\) \(\newcommand{\zerovec}{\mathbf 0}\) \(\newcommand{\onevec}{\mathbf 1}\) \(\newcommand{\real}{\mathbb R}\) \(\newcommand{\twovec}[2]{\left[\begin{array}{r}#1 \\ #2 \end{array}\right]}\) \(\newcommand{\ctwovec}[2]{\left[\begin{array}{c}#1 \\ #2 \end{array}\right]}\) \(\newcommand{\threevec}[3]{\left[\begin{array}{r}#1 \\ #2 \\ #3 \end{array}\right]}\) \(\newcommand{\cthreevec}[3]{\left[\begin{array}{c}#1 \\ #2 \\ #3 \end{array}\right]}\) \(\newcommand{\fourvec}[4]{\left[\begin{array}{r}#1 \\ #2 \\ #3 \\ #4 \end{array}\right]}\) \(\newcommand{\cfourvec}[4]{\left[\begin{array}{c}#1 \\ #2 \\ #3 \\ #4 \end{array}\right]}\) \(\newcommand{\fivevec}[5]{\left[\begin{array}{r}#1 \\ #2 \\ #3 \\ #4 \\ #5 \\ \end{array}\right]}\) \(\newcommand{\cfivevec}[5]{\left[\begin{array}{c}#1 \\ #2 \\ #3 \\ #4 \\ #5 \\ \end{array}\right]}\) \(\newcommand{\mattwo}[4]{\left[\begin{array}{rr}#1 \amp #2 \\ #3 \amp #4 \\ \end{array}\right]}\) \(\newcommand{\laspan}[1]{\text{Span}\{#1\}}\) \(\newcommand{\bcal}{\cal B}\) \(\newcommand{\ccal}{\cal C}\) \(\newcommand{\scal}{\cal S}\) \(\newcommand{\wcal}{\cal W}\) \(\newcommand{\ecal}{\cal E}\) \(\newcommand{\coords}[2]{\left\{#1\right\}_{#2}}\) \(\newcommand{\gray}[1]{\color{gray}{#1}}\) \(\newcommand{\lgray}[1]{\color{lightgray}{#1}}\) \(\newcommand{\rank}{\operatorname{rank}}\) \(\newcommand{\row}{\text{Row}}\) \(\newcommand{\col}{\text{Col}}\) \(\renewcommand{\row}{\text{Row}}\) \(\newcommand{\nul}{\text{Nul}}\) \(\newcommand{\var}{\text{Var}}\) \(\newcommand{\corr}{\text{corr}}\) \(\newcommand{\len}[1]{\left|#1\right|}\) \(\newcommand{\bbar}{\overline{\bvec}}\) \(\newcommand{\bhat}{\widehat{\bvec}}\) \(\newcommand{\bperp}{\bvec^\perp}\) \(\newcommand{\xhat}{\widehat{\xvec}}\) \(\newcommand{\vhat}{\widehat{\vvec}}\) \(\newcommand{\uhat}{\widehat{\uvec}}\) \(\newcommand{\what}{\widehat{\wvec}}\) \(\newcommand{\Sighat}{\widehat{\Sigma}}\) \(\newcommand{\lt}{<}\) \(\newcommand{\gt}{>}\) \(\newcommand{\amp}{&}\) \(\definecolor{fillinmathshade}{gray}{0.9}\)Historically, fires were the most damaging cause of loss. In “Shaped by Risk: The Fire Insurance Industry in America 1790–1920” by Dalit Baranoff, the author describes the major conflagrations in the United States that engulfed parts of cities such as Chicago in 1871.Dalit Baranoff, “Shaped by Risk: Fire Insurance in America 1790–1920,” Ph.D. dissertation, Johns Hopkins University, 2003. Losses from fire cost society dearly. The cost for firefighting in the 2003 southern California fires alone was estimated to be $2 billion in insured losses.Mark E. Ruguet, “Fire Fight Est. $67 M, Total $2 B,” National Underwriter Online News Service, November 3, 2003. The Rhode Island Station Club fire that took so many lives and the Chicago E2 Club panic led to improved fire codes. It has always been the case that major fire catastrophes prompted improved fire codes. Even though, statistically, nightclub fires account for only 0.3 percent of all fires, their fatality rate is disproportionately high.David R. Blossom, “Club Fires Spur Major Changes In Fire Codes,” National Underwriter, January 20, 2005, www.propertyandcasualtyinsurancenews.com/cms/NUPC/Weekly%20Issues/Issues/2005/03/p03club_fires?searchfor=club%20fires (accessed March 20, 2009). In February 2009, Australia experienced the country’s highest ever loss of life from bushfires when over 1.1 million acres across eastern Victoria burned for days. At least 210 people were reported killed and over 500 more were treated for injuries. An estimated 7,500 residents were rendered homeless, with over 2,000 homes burned in the bushfires. A combination of intense, dry heat, lighting, and arson has been posited as the catalyst for this national disaster. While the complete toll of the tragedy cannot be quantified, insurers anticipate $2 billion in losses, and the Australian government has pledged aid to the victims.See Victoria Police, “Bushfires Death Toll,” February 24, 2009, http://www.police.vic.gov.au/content.asp?Document_ID=19190 (accessed February 26, 2009); Cheryl Critchley, “Hospitals Stretched as 500 Treated for Burns,” Daily Telegraph, February 10, 2009, http://www.news.com.au/dailytelegraph/story/0,22049,25031406-5001021,00.html (accessed February 26, 2009); John Huxley, “Horrific, but Not the Worst We’ve Suffered,” Sydney Morning Herald, February 11, 2009, http://www.smh.com.au/national/horrific-but-not-the-worst-weve-suffered-20090210-83ib.html (accessed February 26, 2009); Erin Cassar, “Doctors Treating Bushfire Burns Victims Around the Clock,” ABC News, February 9, 2009, http://www.abc.net.au/news/stories/2009/02/09/2486698.htm (accessed February 26, 2009).
As you saw in previous chapters, fires are not the only cause of catastrophes. Catastrophes are caused by weather, geology, and humans. The last quarter of 2005 broke all records in weather-related catastrophes in the United States, with hurricanes Katrina, Rita, and Wilma responsible for combined insured losses in excess of $42 billion by some estimates. The economic losses are estimated to exceed $150 billion. Much of the uninsured losses were driven by floods from water surges in the Gulf Coast and the subsequent breaches of New Orleans levees. Katrina has been described as “by far the most devastating catastrophe ever to hit the insurance industry, with insured losses at $34.4 billion and counting—surpassing 1992’s Hurricane Andrew.”Sam Friedman, “Katrina Leads Pack of Record Hurricanes Worst Disaster Ever Combines with Rita, Wilma to Cause $45.2 Billion in Losses,” National Underwriter, January 10, 2006, accessed March 20, 2009, www.propertyandcasualtyinsurancenews.com/cms/NUPC/Weekly%20Issues/Issues/2005/48/2005%20Top%2010%20Stories/P48-2005-TOP10-Hurricanes?searchfor=worst%20disaster%20ever;. As noted in "11: Property Risk Management", because of Katrina and Rita, Louisiana homeowners 2005 insurance claim payments are estimated to be as high as all homeowners premiums paid in the previous twenty-five years. In Mississippi, the claims are estimated to be as high as the sum of all premiums for the preceding seventeen years.“Record Homeowners Insurance Claim Payments from 2005 Hurricanes Equal to 25 Years of Louisiana Homeowners Premiums, Says I.I.I. $12.4 Billion in Homeowners Insurance Claims to Be Paid in Louisiana Alone; Homeowners Insurers Will Begin Reassessment of Risk in State,” Insurance Information Institute (III). January 5, 2006, accessed March 20, 2009, www.iii.org/media/updates/press.748181/.
The Insurance Services Office (ISO) defines catastrophe as an event in which losses total at least $25 million. As you have learned, large losses lead to availability and affordability problems. The industry may even decide to pull out of a specific market and not renew policies; the state governments, however, may prevent this action. In the case of the Colorado fires, the state senate passed a bill prohibiting insurers from refusing to issue fire insurance policies within a wildfire disaster area.Joanne Wojcik, “Colorado Bill Would Bar Nonrenewals in Wildfire Areas,” Business Insurance, July 11, 2002. Regulatory protection appeared to be necessary.
If disaster struck your home, no doubt you would be devastated. Lesser risks, too, can be distressing. For example, if a friend is hurt while visiting your home, who will pay her medical bills? As your invitee, she might be forced, through her health insurer, to sue you. These and many other pure risks associated with your home are very real. A partial listing of home risks is shown in Table 13.1. They need to be managed carefully. One of the most important risk management tools to finance such losses is the homeowners policy. We will discuss this coverage in detail. The policy includes both property and liability coverages.
|
The chapter includes discussion of the following:
- Links
- Packaging coverages, homeowners policy forms, the Special Form (HO-3)
- Endorsements
- Other risks: flood and title risks
- Personal liability umbrella policies
- Shopping for homeowners insurance
Links
At this point in our study, we are drilling down into specific coverages. We first stay within the personal property/casualty line of the home coverage. The current policies combine both property and liability coverage in one package. In the next chapter, we will drill down into the automobile policy, which also combines liability and property coverage in a single packaged policy.
As part of our holistic risk management, we need to be assured that the place we call home is secure. Whether we buy our home or rent it, we care about its security and the safety of our possessions. We also want to safeguard our possessions from lawsuits by having some liability coverage within these policies. If we feel that the limits are not high enough, we can always obtain an umbrella policy—liability coverage for higher limits than is available in specific lines of insurance—which is discussed later in this chapter. How the risk management of our home fits into the big picture of a family holistic risk management portfolio is featured in Case 1 at the back of this textbook.
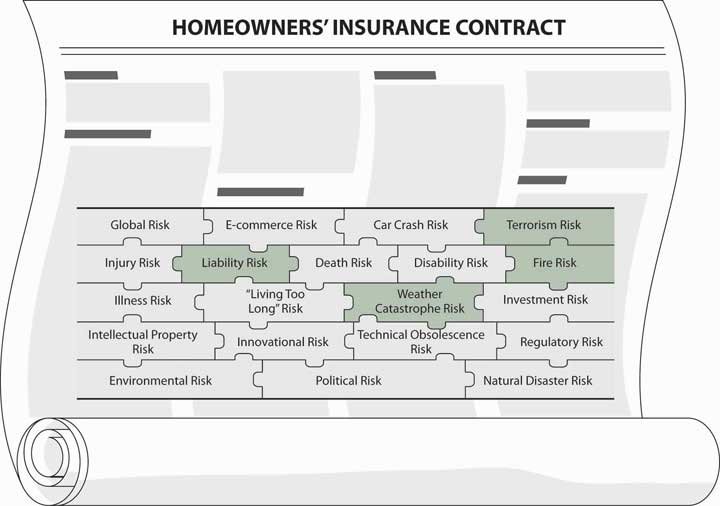
Your risk management decision will take specific factors regarding your home and external conditions into account, as you saw in "4: Evolving Risk Management - Fundamental Tools". Your specific homeowner pricing factors such as the type of material used for the siding of the house, distance from a fire station, age of the house, and location of the house are very critical. You may decide to use higher deductibles, lower limits, and fewer riders. How rating factors are used and the issue of redlining—the alleged practice of insurers charging higher premiums and providing less coverage for homeowners insurance in inner cities—is discussed in the box “Redlining: Urban Discrimination Myth or Reality?” The risks within your holistic risk management puzzle that homeowners insurance protects against are highlighted in Figure \(\PageIndex{1}\) below.
As you learned in "10: Structure and Analysis of Insurance Contracts" and "11: Property Risk Management", most of the homeowners policies are open peril: everything that is not specifically excluded is covered. Thus, the concepts you have learned until now are coming together in one specific type of coverage. To better complete our holistic risk management puzzle, we need to understand how to read and interpret an open peril policy such as the Homeowners Special Form (HO-3) discussed in this chapter.