
1.4: Financial Statement Analysis
- Page ID
- 9064
\( \newcommand{\vecs}[1]{\overset { \scriptstyle \rightharpoonup} {\mathbf{#1}} } \)
\( \newcommand{\vecd}[1]{\overset{-\!-\!\rightharpoonup}{\vphantom{a}\smash {#1}}} \)
\( \newcommand{\dsum}{\displaystyle\sum\limits} \)
\( \newcommand{\dint}{\displaystyle\int\limits} \)
\( \newcommand{\dlim}{\displaystyle\lim\limits} \)
\( \newcommand{\id}{\mathrm{id}}\) \( \newcommand{\Span}{\mathrm{span}}\)
( \newcommand{\kernel}{\mathrm{null}\,}\) \( \newcommand{\range}{\mathrm{range}\,}\)
\( \newcommand{\RealPart}{\mathrm{Re}}\) \( \newcommand{\ImaginaryPart}{\mathrm{Im}}\)
\( \newcommand{\Argument}{\mathrm{Arg}}\) \( \newcommand{\norm}[1]{\| #1 \|}\)
\( \newcommand{\inner}[2]{\langle #1, #2 \rangle}\)
\( \newcommand{\Span}{\mathrm{span}}\)
\( \newcommand{\id}{\mathrm{id}}\)
\( \newcommand{\Span}{\mathrm{span}}\)
\( \newcommand{\kernel}{\mathrm{null}\,}\)
\( \newcommand{\range}{\mathrm{range}\,}\)
\( \newcommand{\RealPart}{\mathrm{Re}}\)
\( \newcommand{\ImaginaryPart}{\mathrm{Im}}\)
\( \newcommand{\Argument}{\mathrm{Arg}}\)
\( \newcommand{\norm}[1]{\| #1 \|}\)
\( \newcommand{\inner}[2]{\langle #1, #2 \rangle}\)
\( \newcommand{\Span}{\mathrm{span}}\) \( \newcommand{\AA}{\unicode[.8,0]{x212B}}\)
\( \newcommand{\vectorA}[1]{\vec{#1}} % arrow\)
\( \newcommand{\vectorAt}[1]{\vec{\text{#1}}} % arrow\)
\( \newcommand{\vectorB}[1]{\overset { \scriptstyle \rightharpoonup} {\mathbf{#1}} } \)
\( \newcommand{\vectorC}[1]{\textbf{#1}} \)
\( \newcommand{\vectorD}[1]{\overrightarrow{#1}} \)
\( \newcommand{\vectorDt}[1]{\overrightarrow{\text{#1}}} \)
\( \newcommand{\vectE}[1]{\overset{-\!-\!\rightharpoonup}{\vphantom{a}\smash{\mathbf {#1}}}} \)
\( \newcommand{\vecs}[1]{\overset { \scriptstyle \rightharpoonup} {\mathbf{#1}} } \)
\( \newcommand{\vecd}[1]{\overset{-\!-\!\rightharpoonup}{\vphantom{a}\smash {#1}}} \)
\(\newcommand{\avec}{\mathbf a}\) \(\newcommand{\bvec}{\mathbf b}\) \(\newcommand{\cvec}{\mathbf c}\) \(\newcommand{\dvec}{\mathbf d}\) \(\newcommand{\dtil}{\widetilde{\mathbf d}}\) \(\newcommand{\evec}{\mathbf e}\) \(\newcommand{\fvec}{\mathbf f}\) \(\newcommand{\nvec}{\mathbf n}\) \(\newcommand{\pvec}{\mathbf p}\) \(\newcommand{\qvec}{\mathbf q}\) \(\newcommand{\svec}{\mathbf s}\) \(\newcommand{\tvec}{\mathbf t}\) \(\newcommand{\uvec}{\mathbf u}\) \(\newcommand{\vvec}{\mathbf v}\) \(\newcommand{\wvec}{\mathbf w}\) \(\newcommand{\xvec}{\mathbf x}\) \(\newcommand{\yvec}{\mathbf y}\) \(\newcommand{\zvec}{\mathbf z}\) \(\newcommand{\rvec}{\mathbf r}\) \(\newcommand{\mvec}{\mathbf m}\) \(\newcommand{\zerovec}{\mathbf 0}\) \(\newcommand{\onevec}{\mathbf 1}\) \(\newcommand{\real}{\mathbb R}\) \(\newcommand{\twovec}[2]{\left[\begin{array}{r}#1 \\ #2 \end{array}\right]}\) \(\newcommand{\ctwovec}[2]{\left[\begin{array}{c}#1 \\ #2 \end{array}\right]}\) \(\newcommand{\threevec}[3]{\left[\begin{array}{r}#1 \\ #2 \\ #3 \end{array}\right]}\) \(\newcommand{\cthreevec}[3]{\left[\begin{array}{c}#1 \\ #2 \\ #3 \end{array}\right]}\) \(\newcommand{\fourvec}[4]{\left[\begin{array}{r}#1 \\ #2 \\ #3 \\ #4 \end{array}\right]}\) \(\newcommand{\cfourvec}[4]{\left[\begin{array}{c}#1 \\ #2 \\ #3 \\ #4 \end{array}\right]}\) \(\newcommand{\fivevec}[5]{\left[\begin{array}{r}#1 \\ #2 \\ #3 \\ #4 \\ #5 \\ \end{array}\right]}\) \(\newcommand{\cfivevec}[5]{\left[\begin{array}{c}#1 \\ #2 \\ #3 \\ #4 \\ #5 \\ \end{array}\right]}\) \(\newcommand{\mattwo}[4]{\left[\begin{array}{rr}#1 \amp #2 \\ #3 \amp #4 \\ \end{array}\right]}\) \(\newcommand{\laspan}[1]{\text{Span}\{#1\}}\) \(\newcommand{\bcal}{\cal B}\) \(\newcommand{\ccal}{\cal C}\) \(\newcommand{\scal}{\cal S}\) \(\newcommand{\wcal}{\cal W}\) \(\newcommand{\ecal}{\cal E}\) \(\newcommand{\coords}[2]{\left\{#1\right\}_{#2}}\) \(\newcommand{\gray}[1]{\color{gray}{#1}}\) \(\newcommand{\lgray}[1]{\color{lightgray}{#1}}\) \(\newcommand{\rank}{\operatorname{rank}}\) \(\newcommand{\row}{\text{Row}}\) \(\newcommand{\col}{\text{Col}}\) \(\renewcommand{\row}{\text{Row}}\) \(\newcommand{\nul}{\text{Nul}}\) \(\newcommand{\var}{\text{Var}}\) \(\newcommand{\corr}{\text{corr}}\) \(\newcommand{\len}[1]{\left|#1\right|}\) \(\newcommand{\bbar}{\overline{\bvec}}\) \(\newcommand{\bhat}{\widehat{\bvec}}\) \(\newcommand{\bperp}{\bvec^\perp}\) \(\newcommand{\xhat}{\widehat{\xvec}}\) \(\newcommand{\vhat}{\widehat{\vvec}}\) \(\newcommand{\uhat}{\widehat{\uvec}}\) \(\newcommand{\what}{\widehat{\wvec}}\) \(\newcommand{\Sighat}{\widehat{\Sigma}}\) \(\newcommand{\lt}{<}\) \(\newcommand{\gt}{>}\) \(\newcommand{\amp}{&}\) \(\definecolor{fillinmathshade}{gray}{0.9}\)Financial statement analysis informs a wide variety of strategic management questions, including:
- What is this organization’s overall financial position? Is it liquid? Profitable? Solvent?
- How does this organization’s financial position compare to its peer organizations?
- How can this organization adjust its operations and policies to strengthen its financial position?
- How much debt or other long-term liabilities can this organization afford?
On March 22, 2014 the side of a hill near the town of Oso, Washington gave out after three days of relentless rainfall. A massive landslide followed, with mud and debris covering more than a square mile. Forty-three people were killed when their homes were engulfed by the slide.
In the days that followed more than 600 personnel participated in search and recovery operations. They rescued eight people from the mud and evacuated more than 100 others to safety. Most of the rescue personnel came from the four rural Snohomish County fire districts that surround Oso.
Minutes after hearing of the slide, staff at the Washington State Office of Financial Management (OFM) – the governor’s budget office – made two critical phone calls. Earlier that week they had reviewed some data on the financial health of local special districts across the state. They observed that rural fire districts in the counties north of greater Seattle were showing signs of acute fiscal stress. Those districts had seen huge growth in property tax collections during the real estate boom of the 2000’s. But since the real estate crisis of 2007-2009, those revenues had fallen precipitously. Many of those districts had laid off staff, cut back on specialized training, and back-filled shifts with volunteer firefighters.
So moments after hearing of the slide, OFM staff called the fire chiefs at two of the most financially-stressed Snohomish County fire districts. Their message to those chiefs was simple: send your people. OFM agreed to reimburse the districts from state or federal emergency management funds if needed. In turn, personnel from two of those districts were among the first on the scene, and were responsible for three of the eight life-saving rescues.
A few weeks later the chiefs of both those districts acknowledged that had OFM not called, they would not have sent their personnel. Both districts were so financially stressed that they could not have afforded the overtime wages and other expenses they’d have incurred to participate in the rescue operations.
Financial condition matters. It shapes how a public organization thinks about its mission and its capabilities. In the case of the Oso mudslide, it was the focal point for some life-saving decisions. That’s why all aspiring public servants need to know how to evaluate financial statements, and to measure, manage, and improve their organization’s financial position.
After reading this chapter, you should be able to:
- Compute and interpret ratios that describe liquidity, profitability, and solvency.
- Contrast how those ratios mean slightly different things across the government, non-profit, and for-profit sectors.
- Compute the “Ten Point Test” for governments.
- Understand the typical strategies organizations employ to improve their liquidity, profitability, and solvency.
- Contrast short-term solvency with long-term solvency, particularly for governments.
What is Financial Position?
Financial position is a public organization’s ability to accomplish its mission now and in the future. When stakeholders ask “how are we doing, financially?” the answer should reflect that organization’s financial position.
An organization’s financial position has three main components:
- Liquidity. Does the organization have liquid resources – especially cash – to cover its near-term liabilities? Can it convert its less liquid assets to cash to cover those liabilities?
- Profitability. Do the organization’s revenues cover its operating expenses?
- Solvency. Can the organization generate enough resources to cover its near-term and long-term liabilities?
Till Debt Do Us Part
Some say there are two types of non-profits: “Those that have debt, and those that don’t.” This is a powerful sentiment. It suggests that once a non-profit has taken on debt, none of its other stakeholders matter. If that organization encounters significant financial stress and cannot repay its creditor(s), then those creditors have a legal claim to its assets. In that circumstance, that organization’s board, clients, funders, and others will have little recourse, and the mission will suffer.
In the previous chapter you learned how to extract information about an organization’s financial position from its balance sheet. For example are most of its assets liquid (e.g., cash and marketable securities), or does it have assets that are more difficult to convert to cash (e.g., receivables, inventory, or prepaid expenses)?
The balance sheet also tells us a lot about solvency, namely if the organization has a lot of long-term liabilities (e.g., long-term debt or pension obligations). Long-term liabilities mean the organization will have to divert some of its resources to meet those liabilities, and that can mean fewer resources to invest in its mission. To be clear, there are times when an organization can and should take on long-term liabilities in pursuit of its mission. Sometimes it makes sense to borrow and invest in a new facility that allows the organization to effectively serve its clients. Pensions and retiree health care benefits are an important employee recruitment and retention tool, even though they result in a long-term liability.
To learn about profitability we typically look to the income statement. Recall that if an organization’s revenues exceed its expenses, then its net assets will grow. The income statement makes clear the organization’s major sources of revenues, which revenues are growing, and whether those revenues cover program and administrative expenses. On the income statement, we can also see depreciation, bad debt expenses, and other expenses that reduce net assets but don’t necessarily impact cash. These are all profitability concerns.
While financial ratios can provide us with useful metrics, always start off with a quick review of the financial statements. Ideally, the financial statements you are working with should report on the organization’s operating and financial position for at least two financial periods. Keep in mind that funding agencies and financial analysts often would need access to at least four if not five years of financial data.
What do the financial statements tell you about the organization’s financial position? Operating results? Cash flows? Review the financial statements and take note of the changes in assets, liabilities, revenues and expenses. Carefully review the notes to the financial statements as they will provide you with more detailed information regarding the organization’s financial position. For example, a note related to fixed assets will report fixed assets at historical cost, assets subject to depreciation, any additions or retired assets, annual depreciation expense as well as accumulated depreciation, and ending balance as reported in the balance sheet. A note for pledges receivable will report amounts due in one year (or current portion), amounts due more than one year but less than five years, and amounts due more than five years. The note will also detail bad debt expense and the discount factor used to find the present value of non-current pledges receivable. A review of the trends should inform your interpretation of the ratios.
A review of the Statement of Financial Position (or Balance Sheet) can be guided by the following questions:
- Assets: How have the assets changed? What proportion is current? How much is reported under cash and cash equivalents? How much is reported under property plant and equipment, net of depreciation? Were there any new investments in property plant and equipment (review notes related to fixed assets)? How much is reported under investments? What proportion of investments is restricted? Have investments changed significantly and was this the result of market gains and investment income, a capital campaign, or transfers from cash (review note on investments)? How much more or less is the organization reporting in receivables/prepaid expenses? Have changes in current assets had a negative or positive impact on cash flows (also review Cash Flow Statement)?
- Liabilities: How have the liabilities changed? What proportion of liabilities is the result of borrowing or financing activities? To assess long-term solvency, what proportion of liabilities are reported as long-term debt obligations? Are there any covenants or restrictions associated with these obligations? To assess short-term solvency, what proportion of liabilities are current? Of that, how much is in the form of a short-term loan or a line of credit? Are there any contingent liabilities reported in the notes to the financial statements?
- Net Assets: What proportion is reported as unrestricted? Of restricted net assets, what proportion is reported as permanently restricted?
Your review of the Income Statement can be guided by similar questions:
- Revenues: What are the major sources of revenues? Have there been significant changes in revenues? Of total revenues, what percent is unrestricted, restricted (i.e., temporarily versus permanently)? How much of the organization’s revenue is driven by earned income activities? Is the organization susceptible to changes in policy or funding priorities of a governmental agency?
- Expenses: How much did the organization spend on programs? How much did the organization spend on administration? Fundraising? Have there been significant changes in the level of spending? Have personnel costs changed? Are there other fixed costs that limit budget flexibility? How much did the organization report in depreciation and amortization?
Financial Statement Ratios
The purpose of accounting is to help organizations make better financial decisions. Financial statement analysis is the process of analyzing an organization’s financial statements to produce new information to inform those decisions. Public organizations make dozens of crucial decisions everyday: Should we expand a program? Should we lease or buy a new building? Should we move cash into longer-term investments? Should we take a new grant from a local government?
All of these decisions must be informed by financial statement analysis. An organization should not expand if its existing programs are not profitable. It should buy a new building only if it knows how its current rent and other operating expenses contribute or detract from its profitability. It should move cash into less liquid investments only if it knows how much liquid resources it needs to cover its operating expenses? And so on. To answer these questions with precision, we need good metrics that illustrate an organization’s liquidity, profitability, and solvency.
For those metrics, we turn to financial ratios (sometimes called financial statement ratios). Financial ratios are calculations derived from the financial statements. Each ratio illustrates one dimension of an organization’s overall financial health.
Analysts who evaluate public organizations’ financial statements employ dozens of different financial ratios. The first table lists a set of liquidity ratios. Liquidity ratios speak to the composition of an organization’s assets, and how quickly those assets can be deployed to cover the organization’s day-to-day expenses. The numerator in these ratios is a measure of liquid resources — either current assets or a specific type of current asset (cash and cash equivalents, receivables etc). The denominator in these ratios is either current liabilities or a measure of average daily cash expenses. For the latter, we take total expenses and remove expenses like depreciation, amortization, and bad debt expense that do not require an outflow of liquid resources. This adjusted for spending number is divided by 365 to produce a rough measure of average daily spending.
| Ratio | What it Tells Us | Non-Profit | Government | For-Profit/Hybrid |
|---|---|---|---|---|
| Current Ratio | Will near-term assets cover near-term liabilities?
Rule of Thumb: >2 |
(Current Assets)/(Current Liabilities) | (General Fund Current Assets)/(General Fund Current Liabilities) | (Current Assets)/(Current Liabilities) |
| Days of Liquid Net Assets | Will overall liquid resources cover typical operating expenses?
Rule of Thumb: >180 days |
((Unrestricted Net Assets-Fixed Asset,net depreciation))/(((Total Expenses-Depreciation-Bad Debt))⁄365) | ||
| Quick Ratio | Will the most liquid assets cover near-term liabilities?
Rule of Thumb: >1 |
(Cash & Cash Equivalents+Receivables )/(Current Liabilities) | (General Fund Cash +General Fund Investments )/(General Fund Liabilities-Deferred Revenue ) | (Cash & Cash Equivalents+Receivables )/(Current Liabilities) |
| Days of Cash on Hand | Is there enough cash to cover typical operating expenses?
Rule of Thumb: >90 days |
(Cash & Cash Equivalents )/(((Total Expenses-Depreciation-Bad Debt))⁄365) | ||
| Fund Balance OR Short-Run Financial Position | What resources are available to appropriate?
Rule of Thumb: >5% |
(Unassigned General Fund Bal.)/(General Fund Revenues) | ||
| Operating Cash Flow | Do cash flows from basic operations cover current liabilities?
Rule of Thumb: Positive |
(Cash Flow From Operations)/(Current Liabilities) |
Profitability ratios are derived from changes in net assets. Recall that net assets increase when revenues exceed expenditures. This is an intuitive measure of profitability. The operating margin speaks to profitability in the organization’s basic (i.e., unrestricted) operations. Net asset growth is a more inclusive measure of profitability across the entire organization. Net asset growth will include changes in temporarily restricted and permanently restricted net assets that are not included in the operating margin.
Margin (sometimes called the profit margin) is the price at which a good or service is sold, minus the unit cost. Industries like retail clothing have extraordinarily tight margins, meaning the price exceeds unit cost by just a percent or two. Low margin businesses must be “high volume,” meaning they must sell a lot of product to be profitable. Professional services like accounting, tax consulting, and equipment leasing are “high margin,” meaning the price charged exceeds the unit cost by a lot, sometimes by orders of magnitude. High margin industries tend to have barriers to entry. They require highly-trained professionals, expensive equipment, and other significant up-front investments.
Profitability measures are less salient for governments because governments need not be profitable to continue operating. Unlike a non-profit or for-profit, a government can bolster its financial position by raising taxes or fees. Most governments don’t have wide latitude to that effect, but they have more than other organizations. That’s why profitability measures for government are focused both on growth in net assets, but also on the share of total revenue that’s derived from revenue sources the government can control on its own, like general revenues and capital grants.
| Ratio | What it Tells Us | Non-Profit | Government | For-Profit/Hybrid |
|---|---|---|---|---|
| Operating Margin | Do typical operating revenues cover typical operating expenses?
Rule of Thumb: Positive |
(Change in Unrestricted Net Assets)/(Unrestricted Revenue) | (Net Revenue or Expense for Governmental Activities / Total Governmental Activities Expenses) X -1 | [(Revenue – Cost of Goods Sold)/Revenue] |
| Net Asset Growth/Net Sales Growth | Is profitability improving?
Rule of Thumb: Positive |
(Change in Net Assets/Change in Unrestricted Revenue) | Change in Governmental Activities Net Position /Beginning Governmental Activities Net Position | (Current Year Operating Margin/Prior Year Operating Margin) |
| Return on Assets | How well does management leverage assets to drive profitability?
Rule of Thumb: Positive |
(Change in Net Assets/Total Assets) | (Total Income/Net Assets) | |
| Own Source Revenue | How much does this government depend on other governments?
Rule of Thumb: < 10% |
Total Primary Government Operating Grants and Contributions / Total Primary Government Revenues | ||
| Inventory Turnover | How often is inventory sold during a year?
Rule of Thumb: > 1 |
(Cost of Goods Sold/Inventory) | ||
| Return on Equity | How profitable are shareholders’ investments?
Rule of Thumb: positive |
(Net Income/Owner’s Equity) |
The solvency measures speak to where the organization gets its resources. If it depends too much on unpredictable or volatile revenues from donors, that’s a potential solvency concern. The same is true of revenues from governments. Government revenues can disappear quickly if the government changes its own fiscal policies and priorities. Debt, although sometimes necessary, indicates a drain on future resources. All these factors can inhibit an organization’s ability to continue to serve its mission.
| Ratio | What it Tells Us | Non-Profit | Government | For-Profit/Hybrid |
|---|---|---|---|---|
| Debt to Assets | What percentage of this organization’s assets were financed with debt?
Rule of Thumb: <1 |
(Total Debt/Total Assets) | (Total Debt/Total Assets) | |
| Contributions Ratio | How much does this organization depend on donors?
Rule of Thumb: >10% but <75% |
(Contributions Revenue/Total Revenue) | ||
| Government Revenue Ratio | How much does this organization depend on government funding?
Rule of Thumb: <25% |
(Government Revenue/Total Revenue) | ||
| Near-Term Solvency | How well can this government meet its near-term obligations with annual revenues?
Rule of Thumb: < 150% |
[(Primary Govt Liabilities – Deferred Revenues)/Primary Government Revenues] |
||
| Debt Burden | How much more money can this government borrow?
Rule of Thumb: Depends |
Primary Government Non-Current Liabilities/Population | ||
| Coverage 1 | How easily can this government repay its debt as it comes due?
Rule of Thumb: < .25 |
(Governmental Funds Principal and Interest on Long-Term Debt/General Fund Expenditures) | ||
| Coverage 2 | How easily can this government’s enterprise activities repay their debt as it comes due?
Rule of Thumb: > .5 |
Enterprise Funds Operating Revenue/ Enterprise Funds Interest Expense | ||
| Capital Asset Condition | Is this government investing in its capital assets?
Rule of Thumb: positive |
(Ending Net Value of Primary Government Capital Assets – Beginning Net Value) / Beginning Net Value | ||
| Working Capital to Total Assets | Has this organization experienced an operating loss?
Rule of Thumb: positive |
(Current Assets – Current Liabilities)/ Total Assets |
||
| Total Equity | What is this organization’s long-run liquidity?
Rule of Thumb: > .5 |
(Owners’ Equity/Total Assets) |
The Internal Revenue Service (IRS) monitors the contributions ratio as part of its public support test for charitable organizations. According to this test, a non-profit must receive at least 10% of its support from contributions from the general public and/or from gross receipts from activities related to its tax-exempt purposes. Less than that suggests the public is not invested in that organization’s mission. By contrast, non-profit analysts also emphasize the tipping point where a non-profit depends too much on individual donors. Different analysts define the tipping point threshold differently, but most agree that 80% of total revenues from individual contributions is dangerously high. At that point, a non-profit’s ability to serve its mission is far too dependent on unpredictable individual donors, and not dependent enough on corporate, foundation, and government support.
For governments, the solvency ratios are focused entirely on debt and other long-term obligations. Governments can borrow money that won’t be paid back for decades. If careless, a government can take on too much leverage. That’s why these solvency ratios focus on how much money a government has borrowed in both its governmental and enterprise funds, and its ability to pay back that debt. The later is known as coverage. Bond investors, particularly for public utilities, often stipulate how much coverage a government must maintain at all times. Coverage ratios are usually expressed as operating revenues as a percentage of interest expenses.
In addition to financial health, financial statements can illuminate how efficiently a non-profit raises money and how much of its resources it devotes to its core mission. These effectiveness measures are related to, but separate from financial position. Fundraising efficiency shows the financial return a non-profit realizes for its investments in fundraising capacity.
The program expense ratio is one of the most closely-watched and controversial ratios in non-profit financial management. It tells us how much of a non-profit’s total expenses are invested in its programs and services, rather than administration, fundraising, and other overhead spending. Many analysts and non-profit monitors recommend a program service ratio of at least 80%.
| Fundraising Efficiency | What is the return on $1.00 in fundraising expenses?Rule of Thumb: > 1 |
(Total Contributions/Fundraising Expenses) |
| Program Expense Ratio | What proportion of total expenses are invested in programs and services versus administration and fundraising?Rule of Thumb: > .8 |
(Program Expenses/Total Expenses) |
These rules of thumb are derived from the rich academic literature and industry analysis of public organizations. To be clear, there is no legal or GAAP-based definition of “financially healthy,” or “strong financial position.” Every foundation, donor, or grantor defines these metrics differently. They’ll also vary across different type and size of organizations. The rules listed in this table are some of the common figures cited by across many analysts in the public and private sector.
Before going further let’s consider a few key points about financial statement ratios:
- Ratios are only part of the story. Ratios are useful because they help us quickly and efficiently focus our attention on the most critical parts of an organization’s financial position. In that sense they’re are a bit like watching on ESPN the thirty-second highlight recap of a football game (or whatever sporting event, if any, you find interesting). If we want to know which team won, and who made some big plays, we’ll watch the highlight reel. If we want to know the full story – the coaches’ overall game plan, which players played well throughout the game, when a key mistake changed the course of the game, etc. – we need to watch a lot more than just the highlights. Ratios are the same way. They’re fast, interesting, and important. If we want a quick overview and not much more, they’re useful. If we don’t have the time to dig deeper into an organization’s operations, or if it’s not appropriate for us to dig deeper, then they’re the best tool we have. But they’re never the whole story. Always keep this limitation in mind.
- Always interpret ratios in context. Ratios are useful because they help identify trends in an organization’s financial behavior. Is its profitability improving? How has its overall liquidity changed over time? Are its revenues growing? And so on. But on their own, ratios don’t tell us anything about trends. To reveal a trend, we must put a ratio in context. We need to compare it to that same ratio for that same organization over time. For that reason we often need multiple years of financial data. It’s also essential to put ratios in an industry context. Sometimes, a broader financial trend will affect many organizations in similar ways. A decline in corporate giving will mean lower donor revenues for many non-profits. Increases in overall health care costs will impact all organizations’ income statements. Reductions in certain federal and state grants will affect particular types of non-profits in similar ways. To understand these trends we need to compare an organizations’ financial ratios to the ratios of organizations in similar industries. It’s useful, for instance, to compare human services-focused non-profits with less than $2 million in assets to other small, human-service focused non-profits in the same region with less than $2 million in assets. We should compare fee-for-service revenue-based non-profits to other fee-for-service revenue-based non-profits to other fee-for-service revenue-based non-profits. Large non-profits with a national or international mission should be compared to each other. There are clear rules about defining comparable organizations. The only rule is that without context, an analysis doesn’t tell us much.
- Financial statement analysis raises questions. A good financial statement analysis will almost always reveal some contradictory trends. Why does this organization’s profitability look strong but the current ratio is well below the rule of thumb? Why is this organization less liquid than its peers? Why does this organization not have debt, and is far more liquid, than similar organizations? A good financial statement analysis raises many of these types granular questions about the organization’s financial assumptions, program operations, and overall effectiveness. Sometimes these follow-up questions can be answered from other publicly-available information, such as the notes to the financial statements or the annual report. Sometimes they can’t. If your analysis concludes with many unanswered questions, that does not mean your analysis is bad. It simply means there are limits to what we can learn from financial statements alone.
- Ratios are retrospective. Most organizations release their financial statements three to six months after the close of their fiscal year. Analysis based on those statements is relying on information that is at least 12 to 18 months old. A lot can happen in 18 months. Always keep this in mind when doing financial statement analysis.
Financial analysts in the for-profit sector focus on financial trends within the industry sectors defined by the North American Industry Classification System or NAICS. These codes identify businesses by key aspects of their operations. For instance, according to recent estimates, there are just over 72,000 businesses in the US within NAICS code 152101 – “Single-family home remodeling, additions, and repairs.” The National Center for Charitable Statistics has developed an analog classification scheme for non-profits known as the National Taxonomy of Exempt Entities (NTEE). NTEE is not as precise or specific as the NAICS, but it is a useful way to think about sub-sectors within the non-profit sector.
Non-Profit Financial Ratios – An Illustration
To see these ratios in action let’s return to Treehouse. The table below shows its computations for the key financial ratios from its FY15 financial statements. All the information for these computations is taken from Treehouse’s basic financial statements included in the previous chapter.
We can summarize Treehouse’s financial position as strong. Each of its ratios are at or better than their benchmarks. It’s profitable, it has a robust and effective fundraising operation that produces 70% of its total revenues, it does not have debt, and it depends minimally on government revenues. [1] These are all markers of a strong financial position. Its contributions ratio suggests that going forward it should seek to diversify some of its revenues away from donations. Perhaps not surprisingly, its program service ratio is .79, almost exactly the .8 rule of thumb.
Treehouse is also quite liquid. Its current ratio suggests its current assets could cover its current liabilities almost 15 times over, and its quick ratio suggests its most liquid resources alone could cover those liabilities more than 11 times over. It also has just above the recommended days of liquid net assets and days of cash on hand. So in other words, it does not keep a startling amount of cash, but it is highly liquid. Nonprofits that depend on pledges often see precisely this dynamic. If an organization depends on pledges then it will in turn book a lot of pledges receivable that will roll in throughout the year. Those receivables are liquid resources, but they’re not necessarily cash, that’s available to spend. And since most of Treehouse’s expenses are for salaries and other near-term spending, it carries few if any current liabilities. That combination of high receivables and low current liabilities can make Treehouse look more liquid than it is, especially given its modest cash holdings.
| Ratio | Computation | Computation for Treehouse |
|---|---|---|
| Liquidity Ratios | ||
| Current Ratio | (Current Assets)/(Current Liabilities) | ($6,997,996)/($467,461) = 14.97 |
| Days of Liquid Net Assets | ((Unrestricted Net Assets-Fixed Asset,net depreciation))/(((Total Expenses-Depreciation-Bad Debt))⁄365) | (($5,255,411-$0))/((($9,381,598-$198,775-$0)/365) = 208.89 |
| Quick Ratio | (Cash & Cash Equivalents+Receivables )/(Current Liabilities) | (($2,713,337+($2,056,445+$193,357+$252,784))/($467,461) = 11.16 |
| Days of Cash on Hand | (Cash & Cash Equivalents )/(((Total Expenses-Depreciation-Bad Debt))⁄365) | ($2,713,337)/(($9,381,598-$198,775-$0)/365) = 107.85 |
| Profitability Ratios | ||
| Operating Margin | (Change in Unrestricted Net Assets)/(Unrestricted Revenue) | ($706,007)/($10,153,840) = 0.07 |
| Net Asset Growth | (Change in Net Assets)/(Change in Unrestricted Revenue) | ($1,057,657)/($706,007) = 1.50 |
| Return on Assets | (Change in Net Assets)/(Total Assets) | ($1,057,657)/($12,614,410) = 0.08 |
| Solvency Ratios | ||
| Debt to Assets | (Total Debt)/(Total Assets) | ($0)/($12,614,410) = 0 |
| Contributions Ratio | (Contributions Revenue/Total Revenue) | ($7,484,460)/($10,625,911) = 0.70 |
| Government Revenue Ratio | (Government Revenue/Total Revenue) | ($1,261,618)/($10,625,911) = 0.12 |
| Effectiveness Ratios | ||
| Fundraising Efficiency | (Total Contributions/Fundraising Expenses) | ($7,484,460)/($1,438,030) = 5.20 |
| Program Service Ratio | (Program Expenses/Total Expenses) | ($7,447,627)/($9,381,598) = 0.79 |
The “Ten Point Test” – An Illustration
Throughout the past few decades, analysts have developed a popular framework to evaluate local governments’ financial condition. It’s known as the “Ten Point Test.” It’s comprised of ten key ratios that, when taken together, summarize a government’s liquidity, profitability, and solvency. In the Ten Point Test framework a government earns “points” based on how its ratios compare to its peer governments. If its ratios are consistently better than its peers it earns a higher score. If its ratios are consistently worse than its peers, it’s scores are lower and in some instance negative.
To see the Test at work let’s return to Overland Park, KS. The table below shows the Ten Point Test ratios and their computations based on its FY2015 financial statements. To compute these ratios yourself refer back to OP’s basic financial statements included in the previous chapter.[2]
| Ratio | Computation | Computation for Overland Park, KS |
| Liquidity | ||
| Short-Run Financial Position | (Unassigned General Fund Balance)/(General Fund Revenues) | ($41,202,961)/($142,624,791) = 0.29 = 29% |
| Liquidity | (General Fund Cash + General Fund Investments )/(General Fund Liabilities) | ($60,313,574)/($7,064,270) = 8.54 = 854% |
| Profitability | ||
| Net Asset Growth | Change in Governmental Activities Net Position /Beginning Governmental Activities Net Position | $14,616,936/$960,524,629 = 0.02 = 2% |
| Operating Margin | (Net (Expense) Revenue for Governmental Activities/Total Governmental Activities Expenses) X -1 | (-$125,846,359/$205,896,739)(-1) = 0.61 = 61% |
| Own-Source Revenues | Primary Government Operating Grants / (Total Primary Government Revenues) | $14,115,047/($60,993,230+$14,115,057+$34,752,883+$143,728,996) = 0.06 = 6% |
| Solvency | ||
| Near-Term Solvency | (Primary Government Liabilities)/(Total Primary Government Revenues) | $284,967,097/($60,993,230+$14,115,057+$34,752,883+$143,728,996) = 1.12 = 112% |
| Debt Burden | (Primary Government Non-Current Liabilities)/Population | ($284,967,097)/(187,730) = $1,518 |
| Coverage 1 | (Governmental Funds Principal and Interest on Long-Term Debt/General Fund Expenditures) | $22,596,369/$101,752,631 = 0.22 = 22% |
| Coverage 2 | Enterprise Funds Operating Revenue/Enterprise Funds Interest Expense | $30,081,558/$5,797,658 = 5.19 |
| Capital Asset Condition | (Ending Net Value of Primary Government Capital Assets – Beginning Net Value) / (Beginning Net Value) | ($871,940,863-$863,435,252)/($863,435,252) = .0098 = 0.98% |
OP ratios look good overall. It has plenty of liquidity. Its short-run financial position (i.e. it’s “fund balance ratio”) is 29%, well above the rule of thumb. It also has more than enough cash to cover its general fund current liabilities. Its net assets are growing, only six percent of its operating revenues are from sources it does not control, it has few near-term liabilities[3], and its “operating margin” (i.e. the extent to which it relies on taxes, rather than user charges to cover its operating expenses) of 0.61 is positive. For these reasons it’s no surprise that Overland Park maintains the highest possible “AAA” rating from two major credit rating agencies – Moody’s and Standard & Poor’s.
Fortunately, the Ten Point Test framework allows us to go a step further. Instead of asking how OP compares to generic benchmarks, we have the tools to compare OP to its peer local governments. This allows us to make much more precise statements about OP’s current and future financial position.
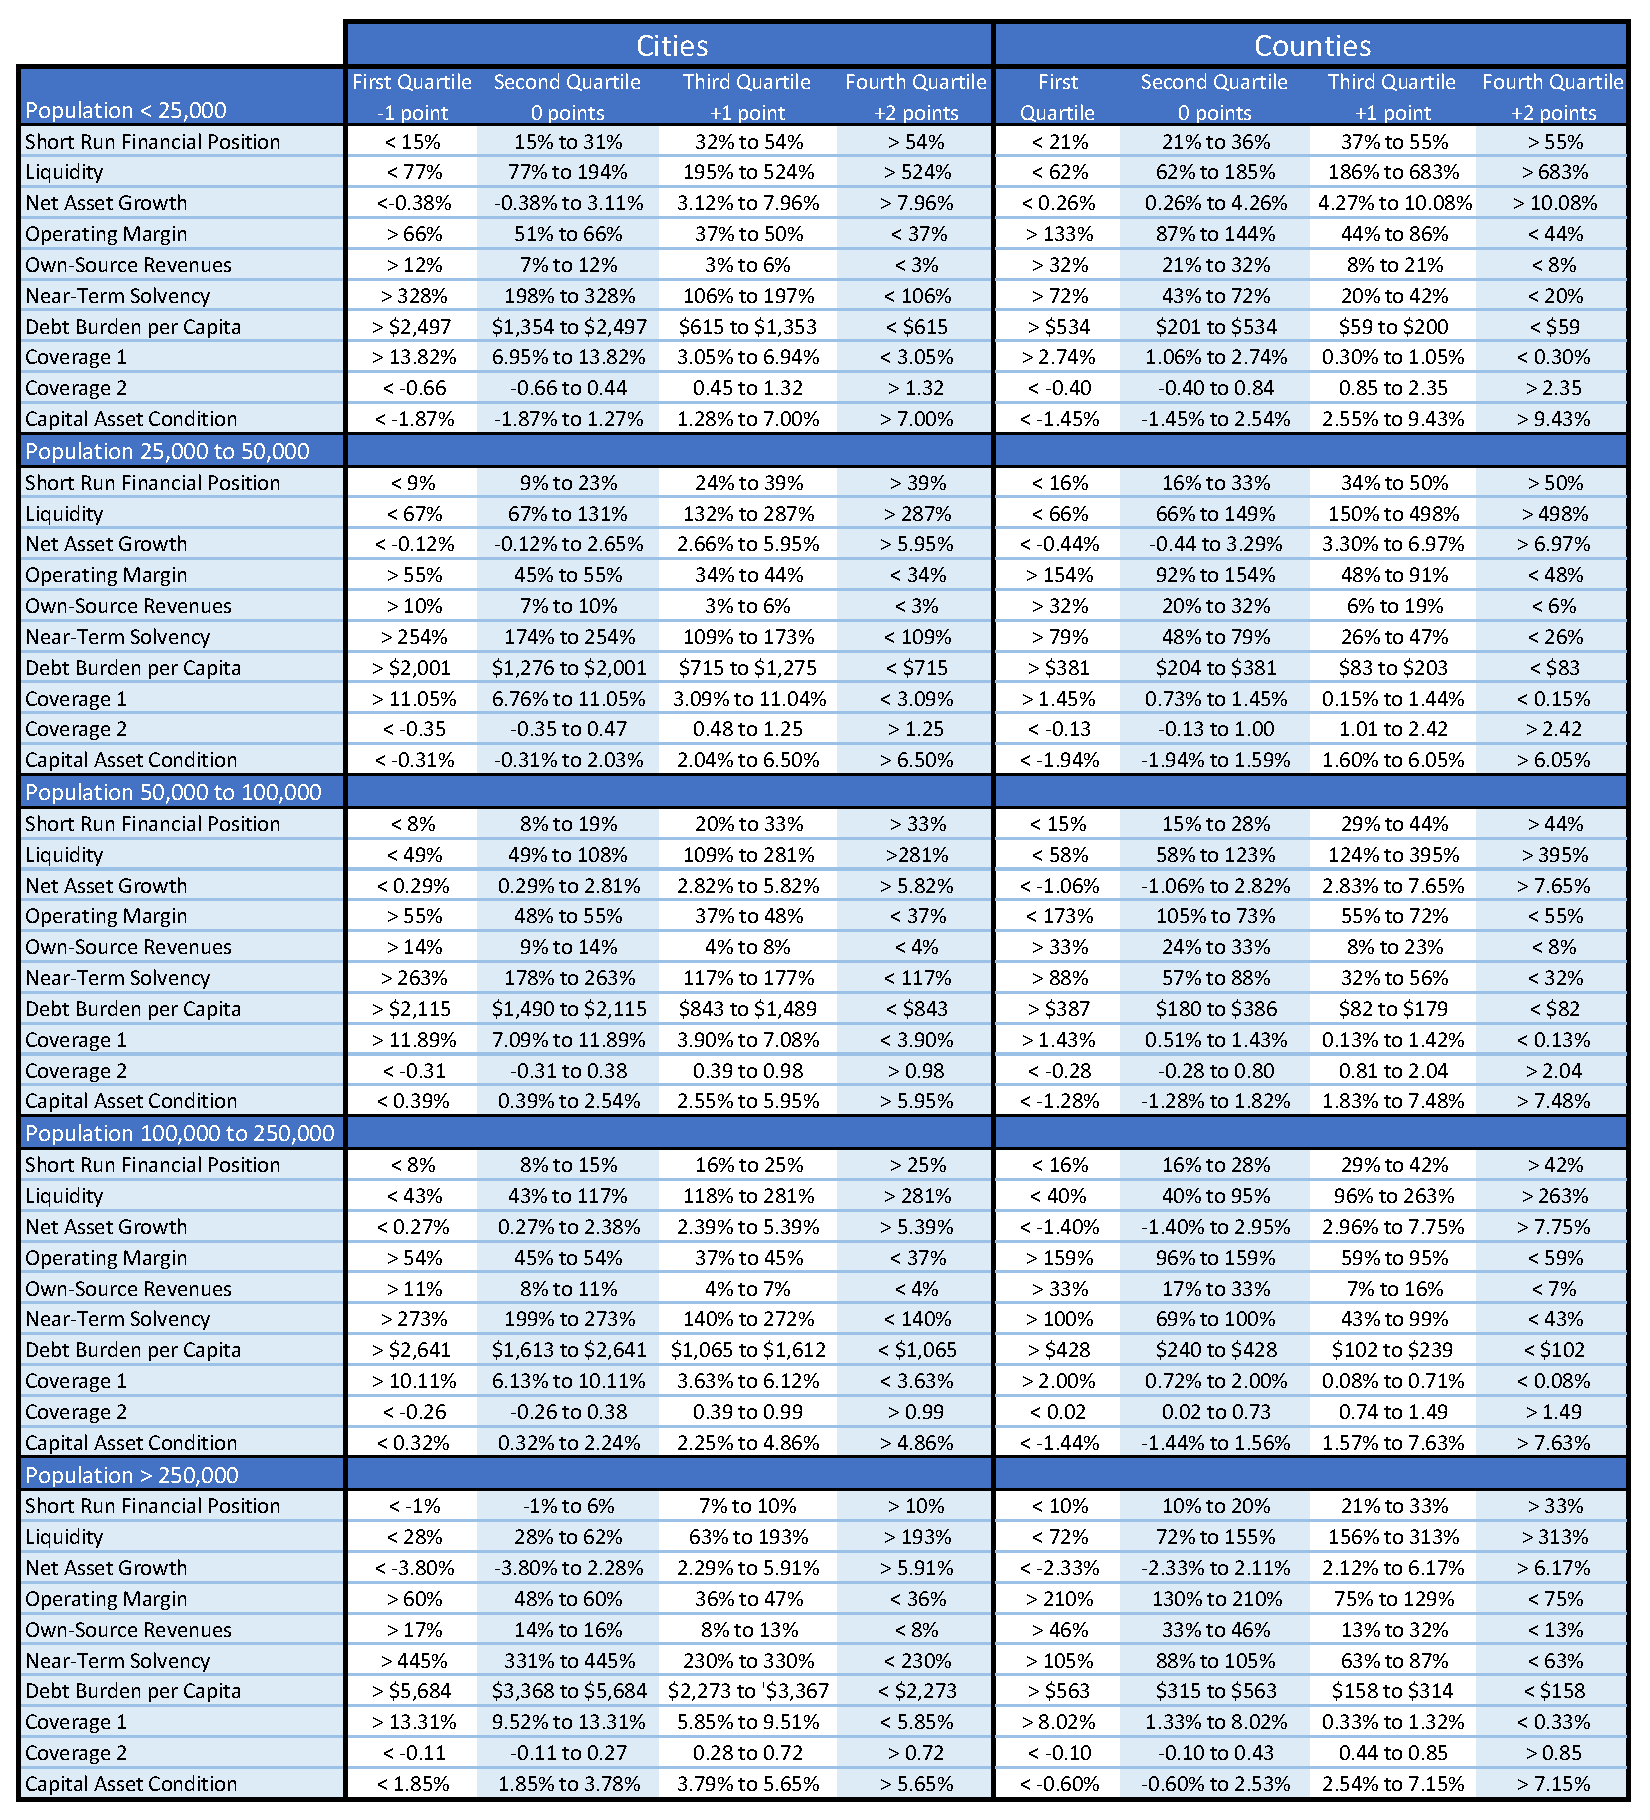
Analysts typically do these peer comparisons by computing the Ten Point Test ratios for a variety of local governments, and then assigning point values based on relative rankings. For example, to compute OP’s Ten Point test score for FY 2015, refer to the table below. This table shows national trends for these same ratios. These trends are based on data from the financial statements of 3,721 city governments and 1,282 county governments from FY2005-2015.[4] The ratios are presented in quartiles. Recall that a quartile is a group of percentiles, and a percentile identifies a point in the distribution of that ratio. The table is organized by population groups. So for instance, for cities with populations between 100,000 and 250,000 (OP’s peer group) the 25th percentile for short-run financial position was 8%. That means one-quarter of OP’s peer cities had short-run financial position less than 8%, and three-quarters had short-run financial position equal to or greater 8%. For all the ratios shown here the first quartile starts at the lowest ratio and ends at the 25th percentile, the second quartile covers the 25th percentile through the 50th percentile, and the third quartile covers the 50th percentile through the 75th percentile. The fourth quartile includes all observations above the 75th percentile.
These quartiles are the basis for the Ten Point Test scoring. If a local government is in the second quartile for a ratio, its score for that ratio is zero. It is not qualitatively better or worse than its peers, so that ratio does not help or hurt its relative score. If a ratio is in the third quartile it earns one point. The logic here is that a ratio above the median (i.e. the 50th percentile) is a financial positive for that government. If a ratio is in the fourth quartile it earns two points. To land in the fourth quartile, a government is better than most of its peers on that particular ratio, and that indicates a source of financial strength. By contrast, a ratio in the first quartile means that government is comparatively weak on that dimension of financial health. To reflect that weakness, we subtract one point.
A local government’s overall Ten Point Test score is easy to interpret. Analysts generally use the following categories:
- A score of 10 or greater suggests a government’s financial position is “among the best.” It can easily meet its immediate spending needs, it has more-than-adequate reserves to mitigate the immediate effects of recessions, natural disasters, or other unexpected events, and it has the capacity to generate adequate resources to cover its long-term spending needs. To earn that score most of its ten ratios must be as good as or better than its peer governments.
- A score between 5 and 9 means the government is “better than most.” Most of its ratios are better than its peer governments, and a few ratios are equal to its peers.
- A score between 1 to 4 means the government is “average.” Most of its ratios are equal to, or weaker than its peer governments.
- A score between 0 and -4 means the government is “worse than most.” Most of its ratios are weaker
than its peer governments. - A score less than -5 means the government is “among the worst.” It has major financial problems and may be insolvent. Scores this low are quite rare.
Let’s return to OP, to compute its Ten Point Test Score. Recall that OP’s population in FY2015 was 187,730, so we’ll use the “Population 100,000 to 250,000” quartiles.
As we saw above, OP’s liquidity is strong. It scores in the top quartile for both short-run financial position and liquidity. It’s profitability ratios are also acceptable, but not nearly as strong as its liquidity. It was in the first quartile for net asset growth, and the third quartile for own-source revenues. These two ratios reflect the same underlying fact: OP depends mostly on general taxes like sales taxes and property taxes, and depends little on user charges and fees or on outside grants or other support. That’s why its own-source revenue is comparatively high, but its operating margin is comparatively low.
OP’s solvency profile is mixed. It has virtually no current liabilities in its governmental funds, and virtually no long-term debt in its proprietary funds. That’s why its near-term solvency and coverage 2 ratios, respectively, are both in the top quartile. At the same time, it is quite leveraged. That fact is reflected in its comparatively high debt burden and its comparatively low coverage 1 ratio. It also appears that in 2015 OP’s investment in capital assets was comparatively low, despite its comparatively high leverage.
| Ratio | Ratio Computed | Score |
| Liquidity | ||
| Short-Run Financial Position | 29% | +2 |
| Liquidity | 854% | +2 |
| Profitability | ||
| Net Asset Growth | 2% | 0 |
| Operating Margin | 61% | -1 |
| Own-Source Revenues | 6% | +1 |
| Solvency | ||
| Near-Term Solvency | 112% | +2 |
| Debt Burden | $1,518 | 0 |
| Coverage 1 | 22% | -1 |
| Coverage 2 | 5.19 | +2 |
| Capital Asset Condition | .98% | 0 |
| Total | 7 | |
Taken together, OP’s ratios add up to an overall Ten Point Test score of seven. Its main financial strengths are its liquidity and its near-term solvency. At the same time, its higher than average debt load and dependence on general revenue sources, lowered that score. Recall that a score of seven suggests OP is “better than most” similarly-sized local governments.
With this overall framework you can compute and interpret a Ten Point Test score for virtually any local government.
Financial Position and Financial Strategy
Financial statement analysis can tell us a lot about an organization’s financial position. The question, then, is what to do about it? As mentioned, sometimes financial statement analysis implies some clear follow-up questions about an organization’s financial operations and overall performance. Ideally, it also suggests some steps that management can take to improve that financial position and performance.
The table below identifies some of those potential steps. It is organized around liquidity, profitability, and solvency. Plus signs identify that part of the organization’s financial position that is strong. Minus signs suggests a potential weakness. There is no “textbook” definition of a financial strength or weakness. However, most public sector analysts define ratios above the benchmark rule of thumb or above the median within a peer group as strong, and ratios below the benchmark rule of thumb or below the median within a peer group as weak. This is not a comprehensive list, but it does illustrate some basic management strategies that tend to follow from different patterns of financial position.
For example, the top right box lists strategies appropriate for a non-profit with good liquidity and good profitability, but concerns about solvency. An organization with these characteristics has enough resources on hand and is currently able to generate enough resources to cover its expenses. What’s less clear is whether it can continue that trend into the future. Perhaps it is too dependent on donor revenues or government grants. Maybe it delivers a service that no one will want in the future. Maybe it has had to borrow a lot of money to build out its service delivery capacity. Regardless of what’s driving the solvency concerns, it’s clear this organization has a good, profitable business. The challenge is ensuring it has enough demand for its services to support its ongoing operations.
To that end, an organization with these characteristics could consider investing in additional capital equipment or facilities that might help it expand its client or customer base. It might also expand or extend its programs to include new lines of business that will allow it to tap into new clients/customers. If long-term liabilities are part of the solvency concern it could consider restructuring or re-negotiating those liabilities.
To “scrub” expenses is to carefully review all current major spending items for potential cost savings. Some contemporary examples include:
- Transition bills to online payments and save on transaction costs and timing delays associated with processing paper bills.
- Move employee reimbursements from checks to direct payroll deposits.
- Renegotiate premiums with your health insurance provider. Bundle different insurance policies with one carrier to improve economies of scale.
- Hire a human resources consultant to identify appropriate salary ranges for future salary negotiations and collective bargaining.
- Shift from traditional phone service to a “voice over internet” (VOI) system. VOI generally offers more lines and better reliability at a lower cost.
- Move to a “multi-platform” plan with your wireless/cellular communications provider. Save money by running phones, iPads, and other wireless devices on one plan.
- Negotiate with credit card providers for lower annual percentage rates and transaction fees.
- Consider opening a line of credit with your existing financial institution. Some institutions offer discounts for bundling banking with credit services.
- Negotiate better terms with your credit card payment processing company. Consider investing in an online processing system that does not require you to lease or purchase credit card terminals
- Move from local servers to a cloud-based, server-less computing environment.
- Explore “software as a service” for typical business applications.
Each of these tactics should happen only after careful attention to costs associated with disrupting the organization.
Contrast this with an organization that has concerns about liquidity, but is otherwise profitable and solvent. This is a good example of a “profitable but cash poor” organization. Here the challenge is to convert some of that profitability into a stronger base of liquid resources. To that end, an organization under these circumstances could consider some short-term borrowing to better manage its cash flow. This might weaken its solvency a bit, but that might be a necessary trade-off relative to weak liquidity. It might also make a specific ask to donors for a reserve fund or other financial contingency fund to bolster its liquidity.
Of course, organizations with concerns about all three aspects of financial position might consider more drastic measures like a merger with another non-profit.
In short, these strategies are some of the most typical for organizations with different financial position profiles.
| Liquidity | Profitability | Solvency | Strategy |
| + | + | — |
|
| + | + | — |
|
| + | — | + |
|
| + | — | — |
|
| — | + | + |
|
| — | + | — |
|
| — | — | + |
|
| — | — | — | With careful attention to minimizing impacts on key stakeholders, consider a merger, acquisition, or liquidation that will allow others to advance the organization’s mission. |
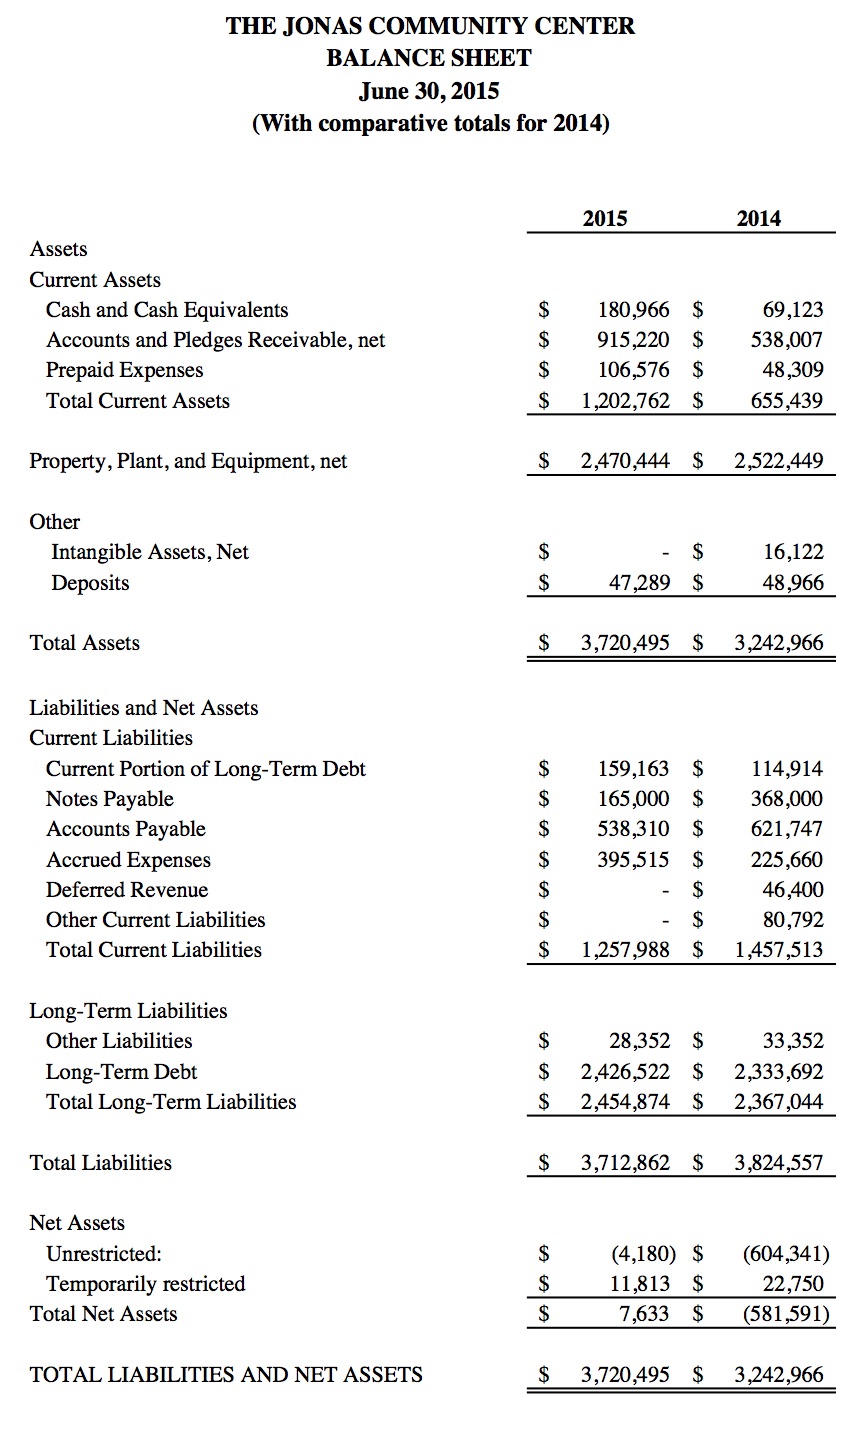
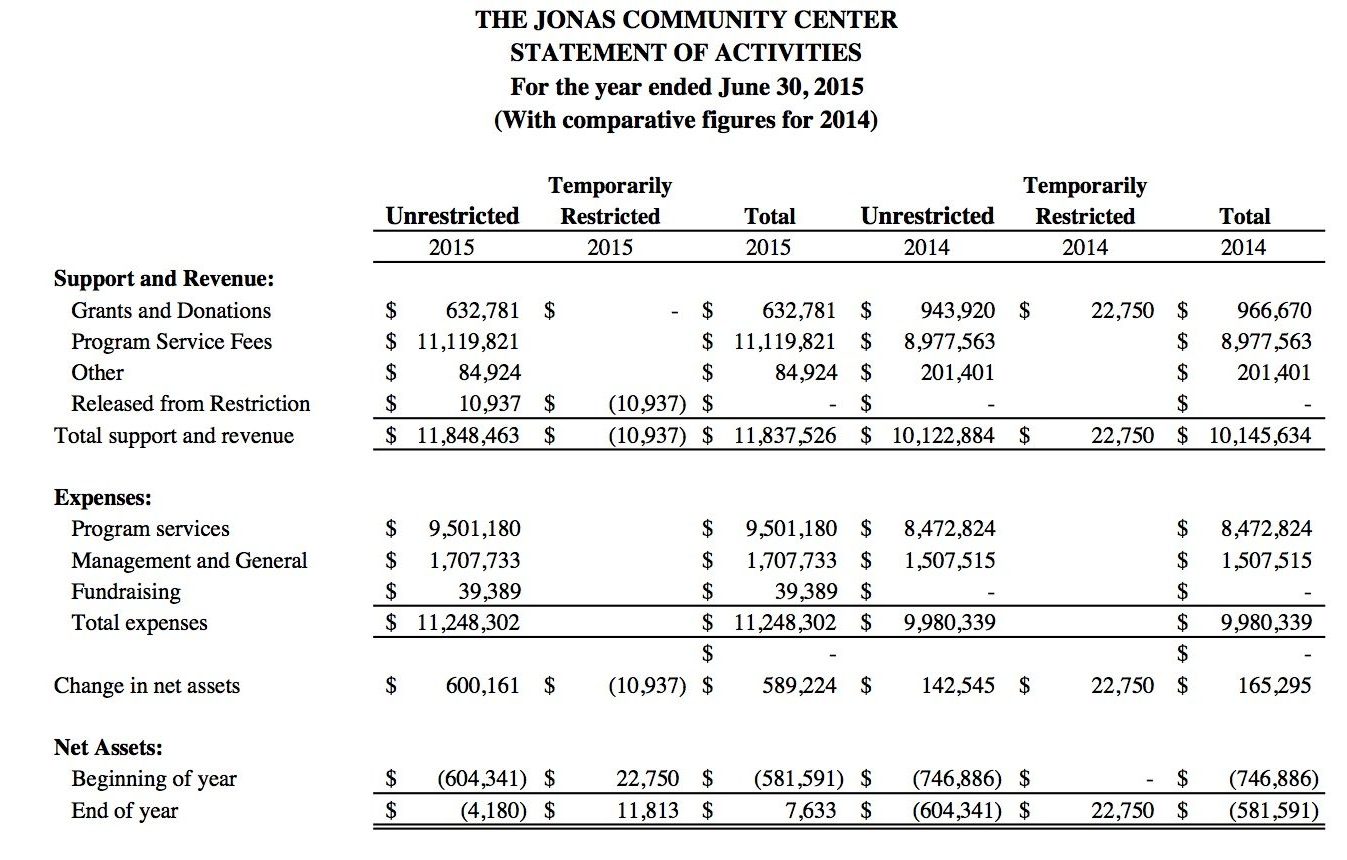
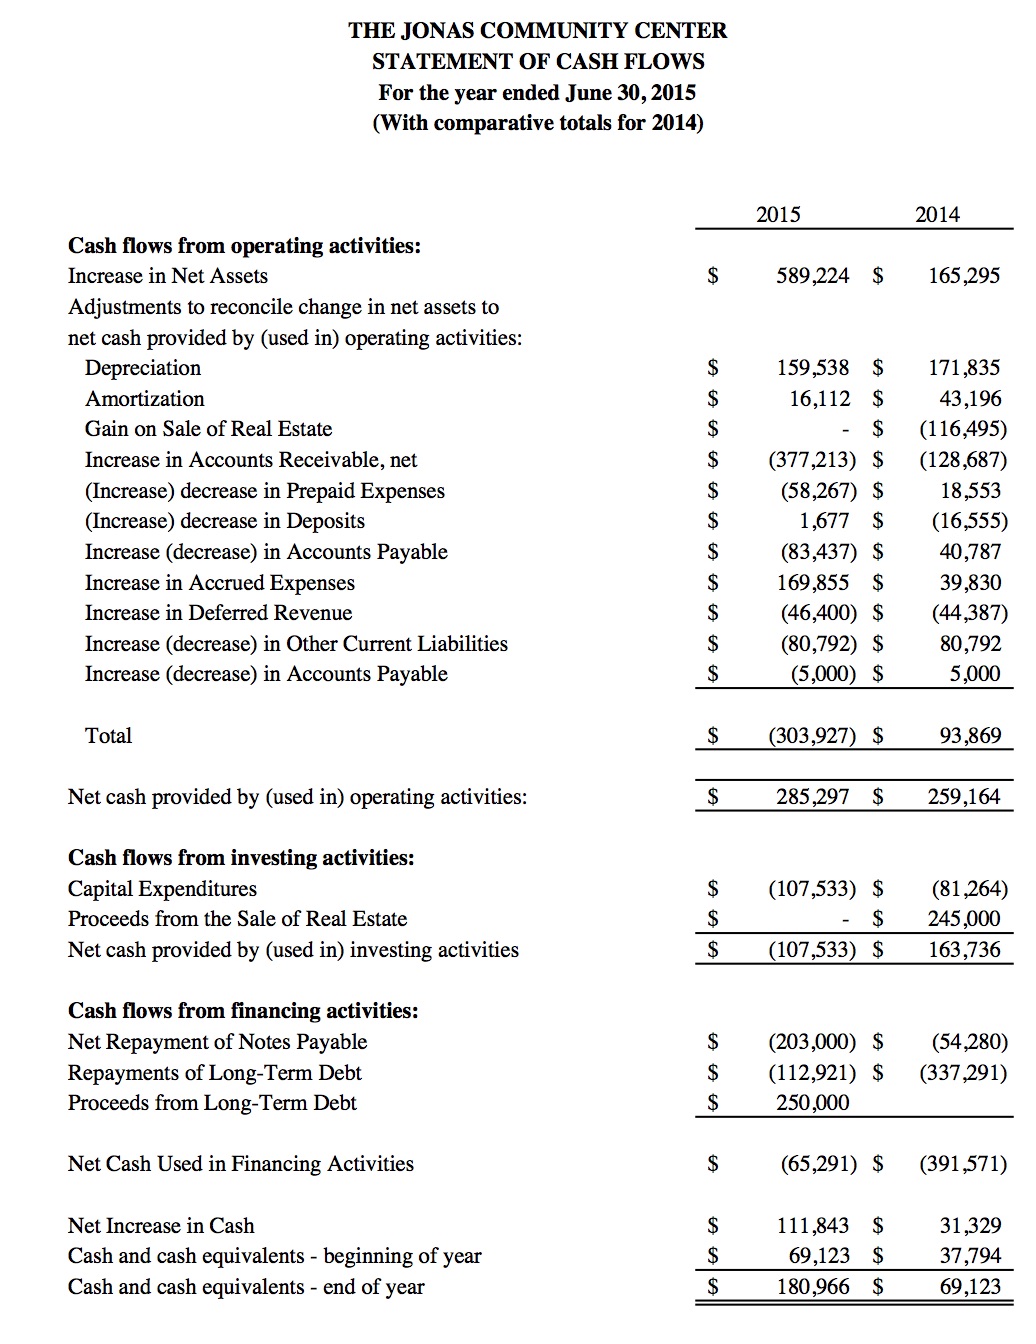
CASE: JONAS COMMUNITY CENTER
THE JONAS COMMUNITY CENTER, INC.
AUDITED FINANCIAL STATEMENTS
JUNE 30, 2015 AND 2014
THE JONAS COMMUNITY CENTER, INC.
NOTES TO FINANCIAL STATEMENTS
JUNE 30, 2015 AND 2014
Note 1. Organization
The Jonas Community Center, Inc. (the “Center”) is a Washington not-for-profit corporation. The Center provides comprehensive services, including emotional and substance abuse counseling, HIV/AIDS education and prevention, residential treatment and neighborhood center services to residents of central Washington.
The Center’s wholly owned subsidiary, Jonas Social Enterprises, Inc., is a taxable entity created in 2005. It is engaged in construction remodeling, repair, and maintenance, employing individuals who have been served by the Center’s programs.
Note 2. Summary of Significant Accounting Policies
The accompanying consolidated financial statements include the accounts and activities of the Center and its wholly-owned subsidiary. All intercompany balances and transactions have been eliminated in consolidation.
Net assets and revenues, gains and losses are classified based on the existence or absence of donor-imposed restrictions. Accordingly, net assets and changes therein are classified as follows:
Temporarily restricted net assets – Net assets subject to donor-imposed stipulations that may or may not be met by actions of the Center and/or the passage of time
Unrestricted net assets – Net assets not subject to donor-imposed stipulations
Grants and other contributions are reported as temporarily restricted support if they are received with donor stipulations that limit the use of the donated assets. When a donor restriction expires, that is, when a stipulated time restriction ends or purpose restriction is accomplished, temporarily restricted net assets are reclassified to unrestricted net assets and reported in the consolidated statement of activities as net assets released from restrictions. Temporarily restricted support is reported as unrestricted if the donor restrictions are met in the same reporting period. At June 30, 2015, temporarily restricted net assets are subject to time restrictions.
Management uses estimates and assumptions in preparing financial statements in accordance with accounting principles generally accepted in the United States of America. Those estimates and assumptions affect the reported amounts of assets and liabilities, the disclosure of contingent assets and liabilities, and the reported revenues and expenses. Actual results could vary from the estimates that were used.
Property, plant, and equipment are stated at cost or, if donated, at the estimated market value at the date of donation, and are depreciated on a straight-line basis over their estimated useful lives.
Intangible assets are recorded at costs and amortized on the straight-line method over periods ranging from three to seven years.
The Center is exempt from income taxes under Section 501(c)(3) of the Internal Revenue Code. Accordingly, no provision for income taxes is required. Donors may deduct contributions made to the Center within the Internal Revenue Code regulations. There are no unrecognized tax benefits and income tax returns remain subject to examination by major tax jurisdictions for the standard three-year statute of limitations.
The costs of providing the various programs and other activities have been summarized on a functional basis in the statement of activities. Accordingly, certain costs have been allocated among the programs and supporting services benefitted.
A number of unpaid volunteers have made contributions of their time to develop and operate the Center’s programs. The value of this contributed time is not reflected in the financial statements since the Center does not have a clearly measurable basis for the amount to be recorded.
Certain reclassifications have been made to the 2014 financial statements in order to conform them to the 2015 presentation.
Note 3. Accounts Receivable
Accounts Receivable are stated net of an allowance for doubtful accounts of $7,500 at both June 30, 2015, and 2014.
Note 4. Property, Plant, and Equipment
Property, Plant, and Equipment consist of:
| 2015 | 2014 | |
| Land, Buildings and Improvements | 3,321,429 | 3,226,764 |
| Furniture and Fixtures | 989,209 | 987,201 |
| 4,310,638 | 4,213,965 | |
| Less: Accumulated Depreciation | 1,840,194 | 1,691,516 |
| Net | 2,470,444 | 2,522,449 |
Intangible Assets consist of:
| 2015 | 2014 | |
| Computer Software | 231,102 | 231,102 |
| Organization Costs | 75,135 | 75,135 |
| Loan Origination Costs | 38,750 | 38,750 |
| 344,987 | 344,987 | |
| Less: Accumulated Amortization | 344,987 | 328,875 |
| Net | – | 16,112 |
Note 6. Notes Payable
| 2015 | 2014 | |
| Notes Payable consists of: | ||
| Note payable to a not-for-profit organization under a $350,000 line of credit agreement, due with interest payable monthly at 1.25% above the prime rate published in the Wall Street Journal. The note is secured by all assets of the Center |
165,000 | 257,500 |
| Notes payable to various individuals, due at various times through May 2014 at interest rates ranging from 0 to 12% |
– | 110,500 |
| Total | 165,000 | 368,000 |
Note 7. Long-Term Debt
| Long-Term Debt consist of: | 2015 | 2014 |
| Note payable to a finance company, due in monthly installments of $5,219, including interest at 9% through June 2020, secured by real estate. |
250,000 | – |
| Note payable to an employee, due in monthly installments of $250, including interest at 16%, through May 2017, unsecured. |
4,665 | 6,568 |
| Note payable to an employee, due in monthly installments of $1,000, including interest at 9.9%, through January 2014 |
– | 4,496 |
| Mortgage note payable to a bank, due in monthly installments of $22,317, including interest at 6.75%, through March 2016, at which time the monthly payment and interest rate will be adjusted based on a fifteen-year amortization schedule due March 2028, secured by a mortgage on real estate. |
2,331,020 | 2,437,542 |
| 2,585,685 | 2,448,606 | |
| Less: Current Portion | 159,163 | 114,914 |
| Net | 2,426,522 | 2,333,692 |
Note 7. Long-Term Debt (cont.)
Following are maturities of long-term debt for each of the next five years and in the aggregate:
| Year ending June 30: | |
| 2016 | 159,163 |
| 2017 | 181,308 |
| 2018 | 191,899 |
| 2019 | 205,715 |
| 2020 | 216,690 |
| through maturity | 1,630,910 |
| Total | 2,585,685 |
Interest expense incurred on all corporate obligations totaled $210,183 in 2015 and $204,664 in 2014. Interest paid totaled $208,822 in 2015 and $198,450 in 2014.
The mortgage note payable above includes provisions requiring the Center to maintain certain restrictive financial covenants. At June 30, 2015, all covenants were met by the Center.
Note 8. Operating Leases
The Center leases real estate, motor vehicles, and office equipment under operating leases expiring at various intervals through 2018. The following is a summary of future minimum rental payments required under these leases as of June 30, 2015 for each of the next three years:
| Year ending June 30: | |
| 2016 | 217,401 |
| 2017 | 102,757 |
| 2018 | 9,599 |
| Total | 329,757 |
Rental payments made under leases with remaining terms in excess of one year totaled $158,111 in 2015 and $147,042 in 2014.
Note 9. Concentration
The Center received a substantial amount of its support and revenue from the State of Washington. If a significant reduction in the level of this support and revenue were to occur, it may have an effect on the Center’s programs and activities.
The Center also has financial instruments, consisting primarily of cash, which potentially expose the Center to concentrations of credit and market risk. Cash is held at a local bank. The Center has not experienced any losses on its cash and cash equivalents. In the ordinary course of business, the Center has, at various times, cash deposits with a bank which are in excess of federally insured limits.
Note 10. Retirement Plans
The Center maintains a qualified contributory retirement plan under Section 403(b) of the Internal Revenue Code for all employees meeting certain age and service requirements. The Center contributes at a rate equal to fifty percent of the elective deferrals of each employee on the first $2,000 of contributions. The Center’s contribution totaled $27,142 for 2015 and $22,846 for 2014.
Note 11. Liability to the State of Washington
In 2013, the Organization recorded a liability of $28,352 to the State of Washington for non-reimbursable costs in excess of available offsetting revenue. The amount is reported in Other Liabilities in the accompanying balance sheet.
Note 12. Related Party
Included in Notes Payable and Long-Term Debt are amounts due to members of management and the Board of Directors. Amounts due under these arrangements totaled $4,665 and $11,064 at June 30, 2015 and 2014, respectively.
The Center, as a tenant-at-will, rents a facility from a member of its Board of Directors. Rent expense incurred under this arrangement totaled $43,800 in 2015 and $42,000 in 2014.
ASSIGNMENT
- A number of members of the Board believe Jonas Community Center (JCC) is profitable but not solvent. Others argue the nonprofit is solvent, but not profitable. Do you agree with either position? What evidence supports your argument.
- Identify three things – two in the next six months and another in the next two years – that JCC could implement to address one or more of the issues you have identified from your review of the financial statements.
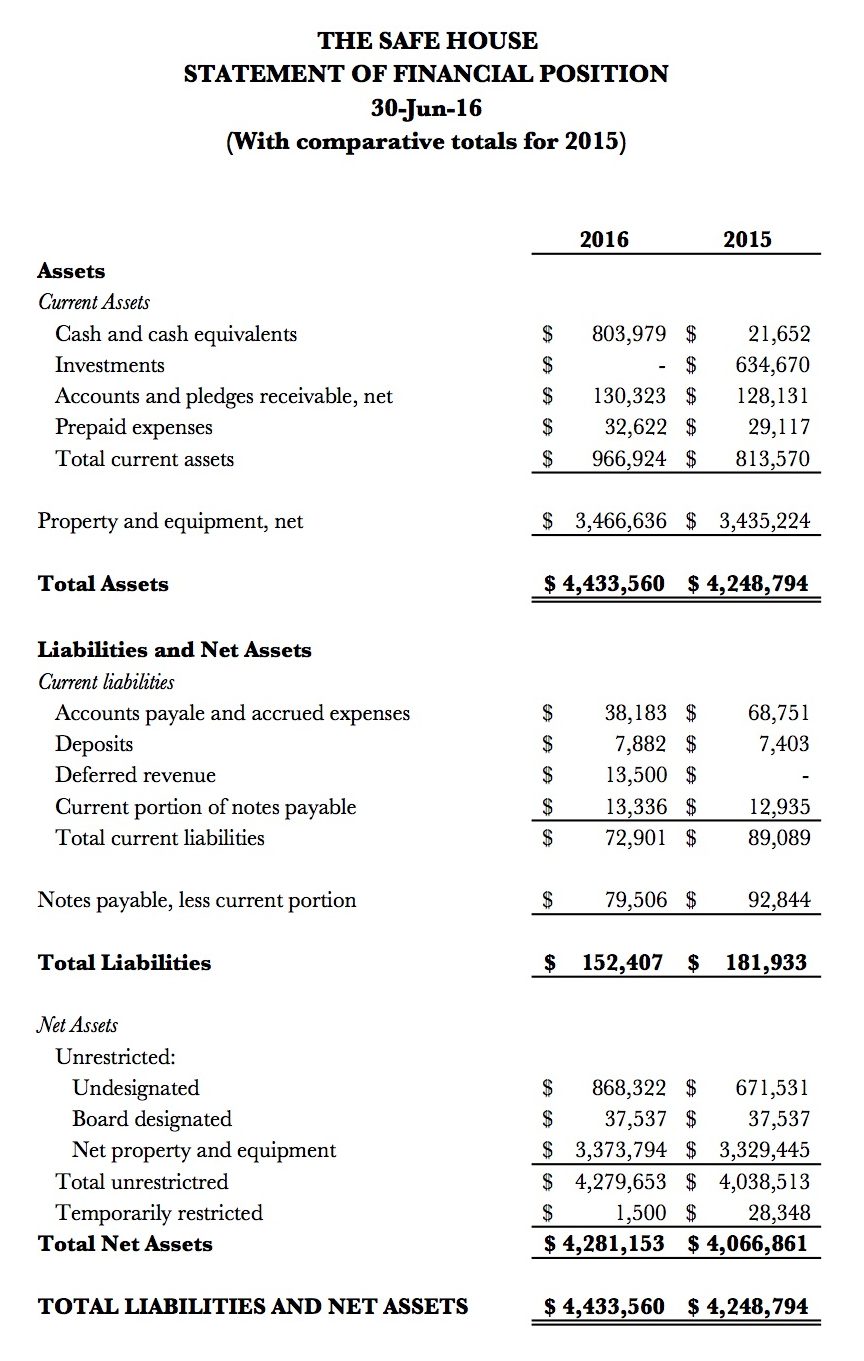
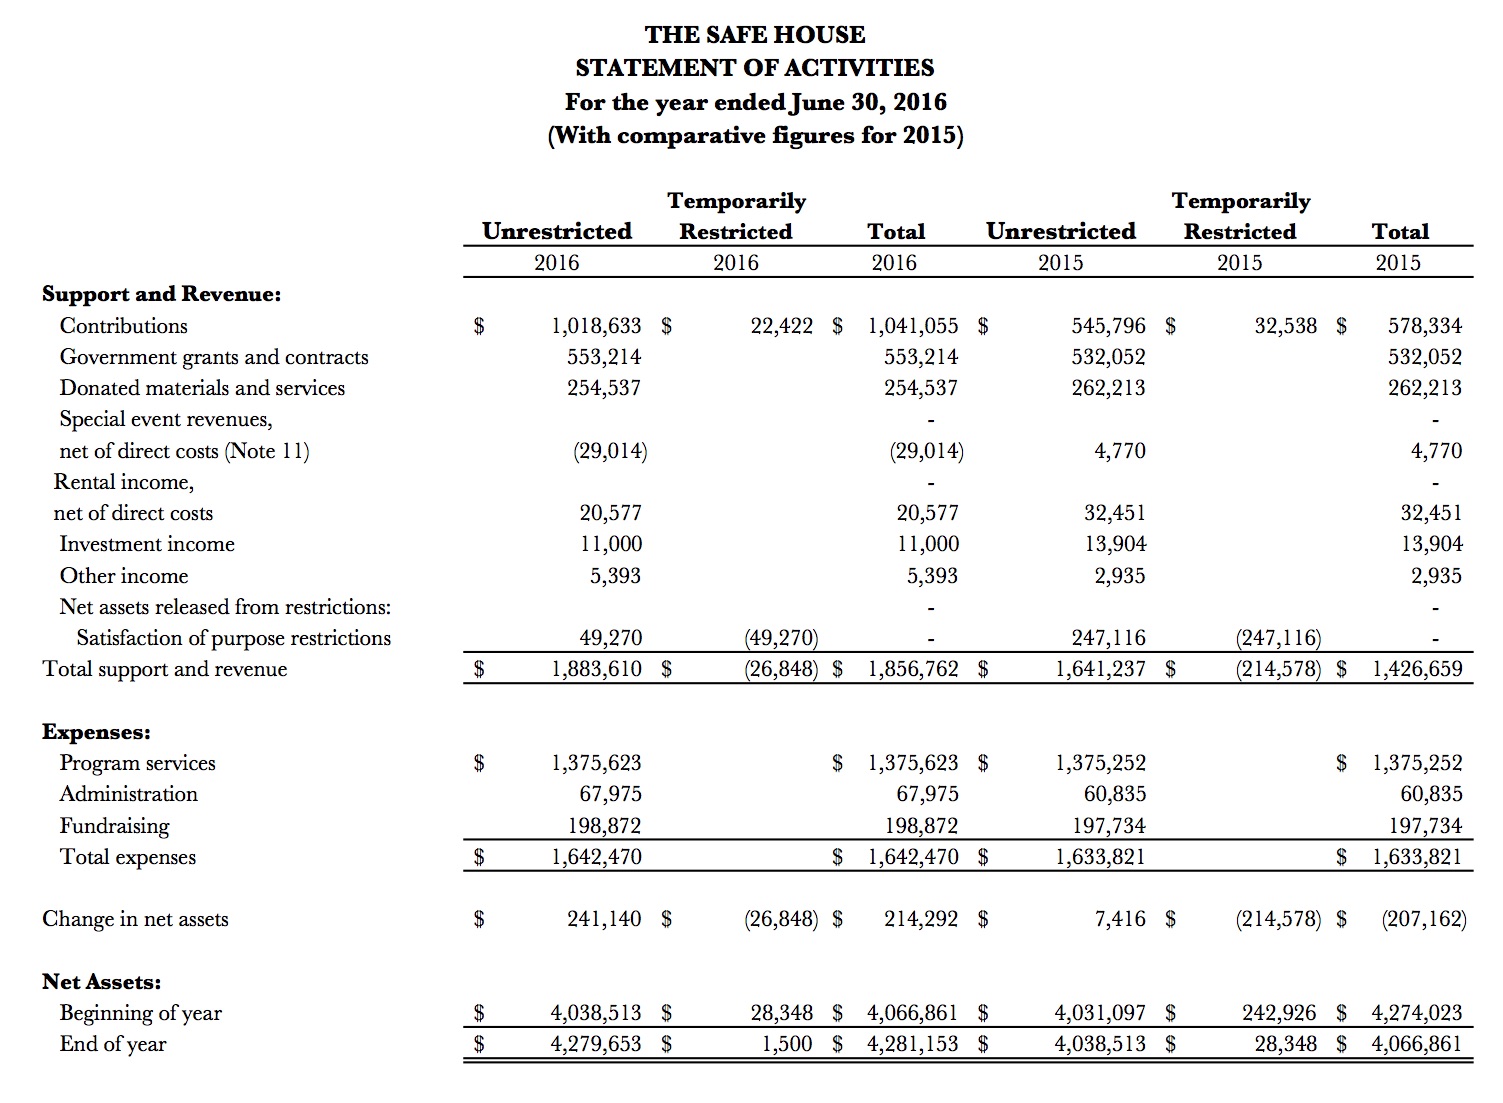
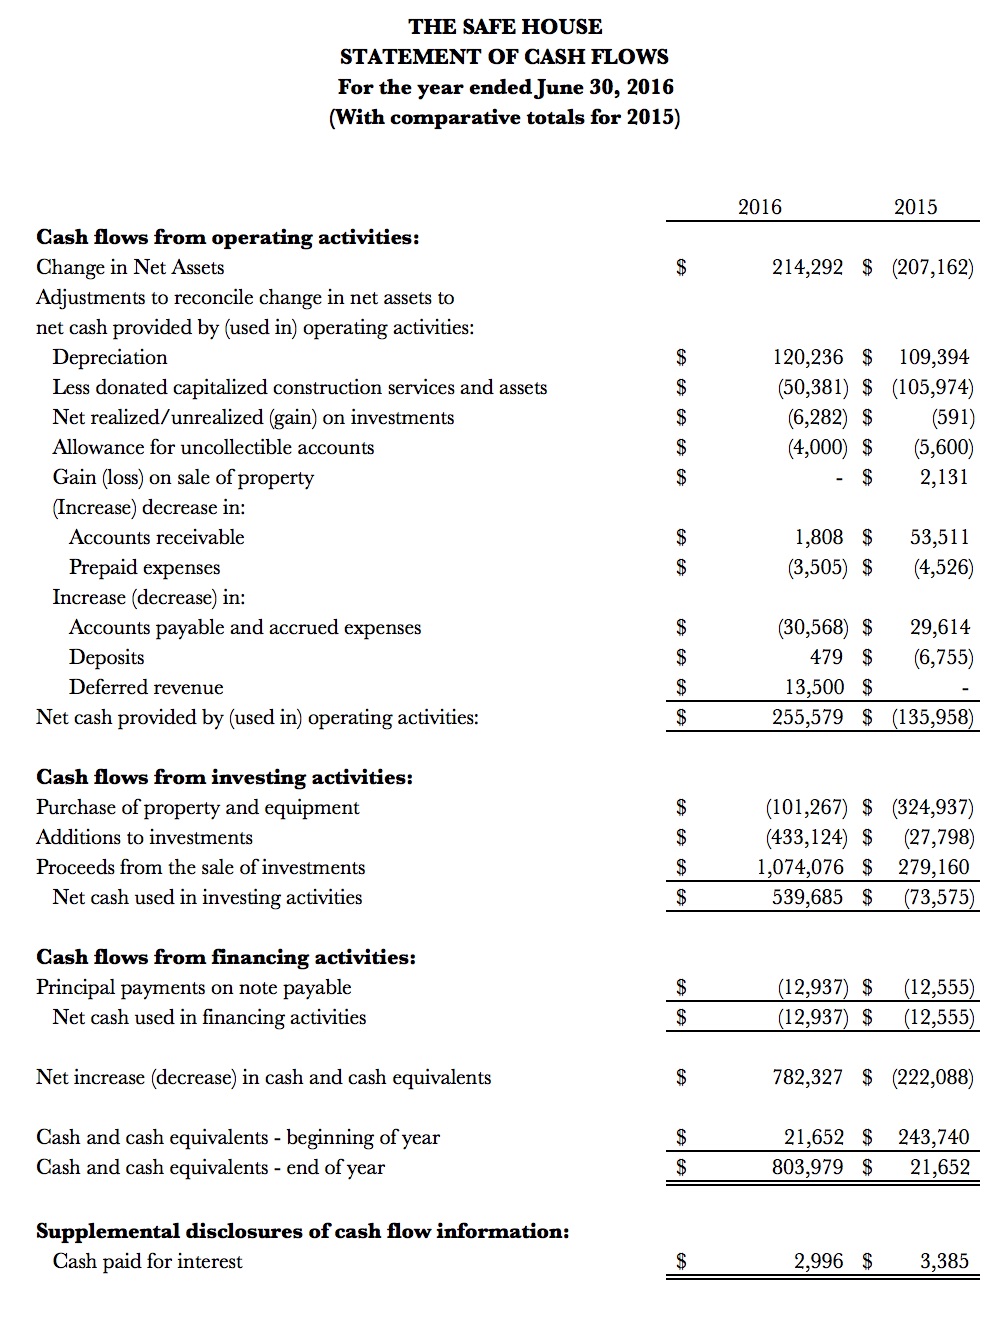
CASE: THE SAFE HOUSE
THE SAFE HOUSE
AUDITED FINANCIAL STATEMENTS
JUNE 30, 2016 AND 2015
THE SAFE HOUSE, INC.
NOTES TO FINANCIAL STATEMENTS
JUNE 30, 2016 AND 2015
- NATURE OF ACTIVITIES
The Safe House (the Organization) is a nonprofit human service agency that assists families in crisis by providing a foundation of hope for victims of domestic violence. Serving a diverse community made homeless by domestic violence, the Organization works to eliminate the core causes through program services and community education. Assistance includes housing, advocacy, information and referral services, community education, and other specially designed services in support of the Organization’s programs. These services include emergency food, clothing and transportation, youth programs, and support groups. The Organization’s programs are supported primarily through contributions and government grants. Government grants from two agencies represent 28% and 32% of total support and revenue for the years ended June 30, 2016 and 2015, respectively.
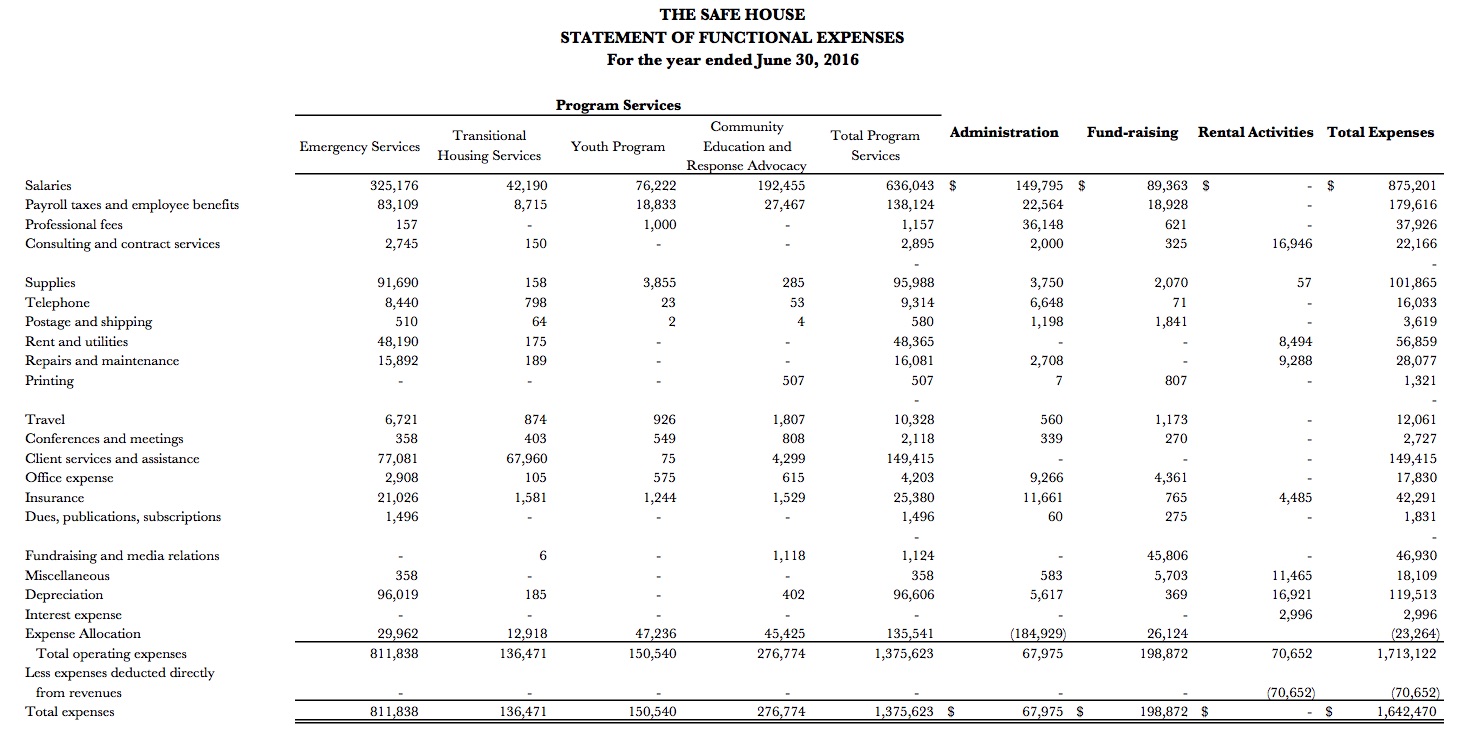
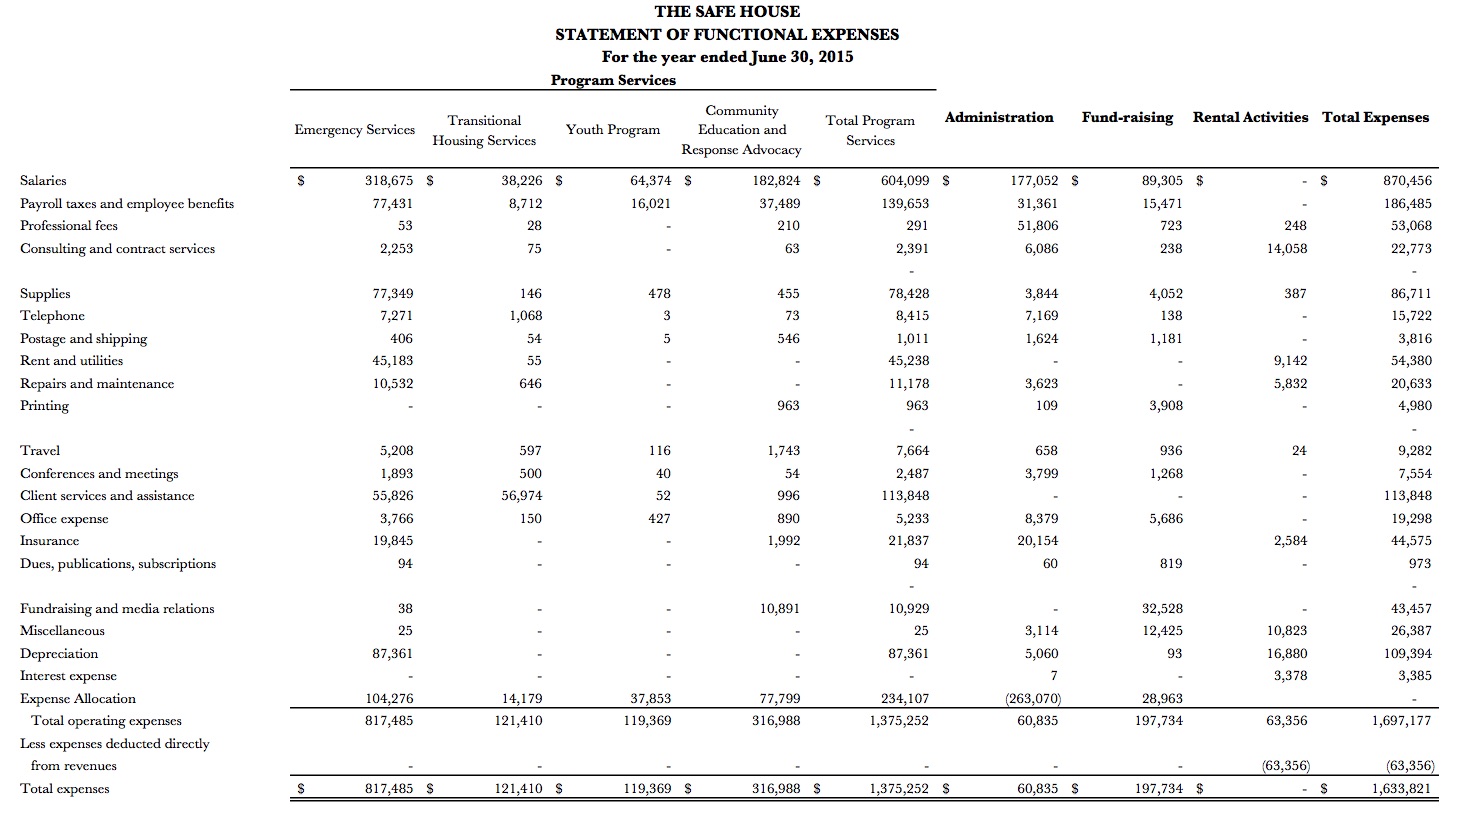
The Organization’s programs are as follows:
Emergency Services: Each year approximately 300 survivors stay at the Organization’s emergency shelter an average of eight weeks. It is confidentially located and can house up to 40 survivors and their children at one time. The shelter is a safe and comfortable environment where women and children can access the resources necessary to help build a violence free life.
Transitional Housing Services: The Organization operates a scattered housing transitional program. Up to 22 women are assisted through housing and ongoing advocacy for a period of up 24 months.
Youth Program: The youth program provides advocacy, safety planning and developmentally appropriate activities for emergency shelter residents under 18 years of age.
Community Education: The Safe House maintains a commitment to education and raising awareness in the community about the effects of domestic violence. Through outreach and educational programs, the Organization educates high school and middle school students on the warning signs of intimate partner violence as well as their rights within all relationships. The Organization is also committed to raising awareness about domestic violence in the workplace so businesses and employees know their rights if they or someone they know is experiencing intimate partner violence.
Response Advocacy Program: The Safe House has three advocates out-stationed at the police bureau. These advocates work specifically with survivors involved with some level of the criminal justice system. Two of these work collaboratively with other community partners through the Domestic Violence Enhanced Response Team (DVERT) working toward victim safety for high risk and high lethality domestic violence situations.
- SUMMARY OF SIGNIFICANT ACCOUNTING POLICIES
Basis of Presentation: Net assets and all balances and transactions are presented based on the existence or absence of donor-imposed restrictions. Accordingly, the net assets of the Organization and changes therein are classified and reported as unrestricted or restricted net assets. Unrestricted net assets are those that are not subject to donor-imposed stipulations. Temporarily restricted net assets are subject to donor-imposed stipulations that will be met, either by actions of the Organization and/or the passage of time.
Cash and Cash Equivalents: For purposes of the statement of cash flows, the Organization considers all highly liquid investments available for current use with maturities of three months or less at the time of purchase to be cash equivalents.
Investments: Investments are carried at fair value. At June 30, 2015 investments consisted of various certificates of deposit held in a CDARS (Certificate of Deposit Account Registry Service) account.
Accounts Receivable: Accounts receivable are reported at the amount management expects to collect on balances outstanding at year-end. Based on management’s assessment of the outstanding balances, it has concluded that realization losses on balances outstanding at year-end will be immaterial.
Property and Equipment: Acquisitions of property and equipment of $500 or greater are capitalized. Property and equipment purchased are recorded at cost. Donated assets are reflected as contributions at their estimated values on the date received.
Depreciation: Depreciation of property and equipment is calculated using the straight-line method over the estimated useful lives of the assets which range from 5 to 15 years for equipment and 40 years for buildings.
Income Tax Status: The Organization is a nonprofit corporation exempt from federal and state income tax under section 501(c)(3) of the Internal Revenue Code and applicable state law. However, income from rental activities not directly related to the Organization’s tax exempt purpose is subject to taxation. No provision for income taxes is made in the accompanying financial statements, as the Organization currently has no net income subject to unrelated business income tax. The Organization is not a private foundation.
Restricted and Unrestricted Revenue and Support: Contributions, which include unconditional promises to give (pledges), are recognized as revenues in the period the Organization is notified of the commitment. Conditional promises to give are not recognized until they become unconditional, that is when the conditions on which they depend are substantially met. Management provides for probable uncollectible amounts for pledges receivable through a charge to expense and a credit to a valuation allowance based on its assessment of the current status of individual accounts. Balances that are still outstanding after management has used reasonable collection efforts are written off through a charge to the valuation allowance and a credit to accounts and pledges receivable.
Contributions received are recorded as unrestricted, temporarily restricted, or permanently restricted support, depending on the existence and/or nature of any donor restrictions. Donor-restricted support is reported as an increase in temporarily or permanently restricted net assets, depending on the nature of the restriction. When a restriction expires (that is, when a stipulated time restriction ends or purpose restriction is accomplished), temporarily restricted net assets are reclassified to unrestricted net assets and reported in the statement of activities as net assets released from restrictions.
Government grants and contracts are recognized as revenue when the services are performed.
Special event fees and sponsorships are recognized in the period the event is held. Funds received in advance are reflected as deferred revenue.
Donated Facilities, Materials, and Services: Donations of property, equipment, materials and other assets are recorded as support at their estimated fair value at the date of donation. Such donations are reported as unrestricted support unless the donor has restricted the donated asset to a specific purpose.
The Organization recognizes donated services that create or enhance nonfinancial assets or that require specialized skills and are provided by individuals possessing those skills, and would typically need to be purchased if not provided by donation. A summary of donated facilities, materials and services is as follows:
| 2016 | 2015 | |
| Facilities | $36,960 | $35,500 |
| Materials and goods | $160,258 | $121,424 |
| Furniture and fixtures | $15,000 | |
| Capitalized services for construction in progress | $35,381 | $86,054 |
| Legal and professional services, included in administration | $6,398 | $19,235 |
| Total donated facilities, materials, and services | $254,537 | $262,213 |
In addition, many individuals volunteer a substantial amount of time and perform a variety of tasks that assist the Organization with specific assistance programs, campaign solicitations, and administrative duties. These volunteer services representing approximately $46,100 for 2016 and $40,600 for 2015 are not recognized as contributions in the financial statements since the recognition criteria were not met.
Expense Allocation: The costs of providing various programs and other activities have been summarized on a functional basis in the statement of activities and in the statement of functional expenses. Accordingly, certain costs have been allocated among the programs and supporting services benefited.
Use of Estimates: The preparation of financial statements in conformity with accounting principles generally accepted in the United States of America requires management to make estimates and assumptions that affect the reported amounts of assets and liabilities and disclosure of contingent assets and liabilities at the date of the financial statements and the reported amounts of revenues and expenses during the reporting period. Actual results could differ from those estimates.
Reclassifications: Certain accounts in the prior-year financial statements have been reclassified for comparative purposes to conform with the presentation in the current-year financial statements.
- ACCOUNTS AND PLEDGES RECEIVABLE
Accounts and pledges receivable are unsecured and consist of the following at June 30, 2016 and 2015:
| 2016 | 2015 | |
| Pledges receivable | $28,199 | $35,531 |
| Less allowance for uncollectible accounts | $(5,000) | $(9,000) |
| Pledges receivable, net | $23,199 | $26,531 |
| Government contracts and grants: | ||
| City Government | $24,090 | $46,286 |
| County Government | $67,377 | $43,554 |
| Other | $15,657 | $11,760 |
| Total government contracts and grants | $107,124 | $101,600 |
| Accounts and pledges receivable, net | $130,323 | $128,131 |
Pledges receivable at June 30, 2016 are expected to be collected within one year.
- PROPERTY AND EQUIPMENT
Property and equipment consist of the following at June 30, 2016 and 2015:
| 2016 | 2015 | |
| Land | $150,170 | $150,170 |
| Buildings | $4,167,783 | $3,600,692 |
| Vehicles | $5,250 | $5,250 |
| Furniture and Fixtures | $203,714 | $158,486 |
| Construction in process | $460,671 | |
| Total property and equipment | $4,526,917 | $4,375,269 |
| Less accumulated depreciation | $(1,060,281) | $(940,045) |
| Net property and equipment | $3,466,636 | $3,435,224 |
Included in land and buildings is property donated to the Organization by Catholic Charities (CC) during the year ended June 30, 1999. According to CC’s stipulations, at all times the property must be used in connection with the operation of a shelter and/or transitional housing for women and children who are victims of domestic violence, services for victims of domestic violence, or services consistent with the charitable purposes of the Organization. In the event that the Organization ceases to exist as a nonprofit, tax-exempt corporation, title to the property will revert to CC. As of June 30, 2016 and 2015, the Organization was in compliance with this restriction.
- LINE OF CREDIT
The Organization has a $50,000 line of credit with Puget Sound Community Bank with interest payable monthly at an adjustable rate corresponding to the Prime Rate, but not less than 6% (6% at June 30, 2016). The line is secured by real property and matures June 30, 2016. There were no outstanding advances on the line at June 30, 2016.
- NOTE PAYABLE
Note payable consists of a note from Puget Sound Development Commission, payable in monthly installments of $1,328, including interest at 3%, through April 2016; secured by land and building.
| 2016 | 2015 | |
| Total note payable | $92,842 | $105,779 |
| Less current portion | $13,336 | $12,935 |
| Long-term portion | $79,206 | $92,844 |
| Future scheduled maturities of note payable are as follows: | ||
| For the year ending June 30, 2010 | $13,336 | |
| 2011 | $13,737 | |
| 2012 | $14,154 | |
| 2013 | $14,586 | |
| 2014 | $15,027 | |
| Thereafter | $22,002 | |
| Total | $92,842 |
- CONTINGENCIES
Amounts received or receivable from various contracting agencies are subject to audit and potential adjustment by the contracting agencies. Any disallowed claims, including amounts already collected, would become a liability of the Organization if so determined in the future. It is management’s belief that no significant amounts received or receivable will be required to be returned in the future.
- RETIREMENT PLAN
Effective September 1, 2005, the Organization adopted a SIMPLE IRA plan that is available to all employees. Participants are eligible for an employer match of their contribution up to 3% of their gross wages. The percentage is established annually by the Board of Directors. The matching percentage established by the Board was 3% in calendar year 2016 and 1% in calendar year 2015. Employees may contribute the maximum amount allowed by IRS regulations. The Organization’s contribution to the Plan totaled $13,927 for the year ended June 30, 2016 and $21,008 for the year ended June 30, 2015.
- BOARD DESIGNATED NET ASSETS
During the year ended June 30, 2005, a board-designated endowment fund was established in the name of Rick Rhoades. The principal of the endowment will be held in perpetuity and income earned will be available for youth programs. Changes in endowment net assets are as follows:
| 2016 | 2015 | |
| Balance at beginning of year | $37,537 | $41,882 |
| Investment income | $6 | $205 |
| Expenditures for programs | $(6) | $(4,550) |
| Balance at end of year | $37,537 | $37,537 |
The Organization annually appropriates all income earned of the endowment fund and uses it to support youth programs.
The Organization has adopted an investment policy with the primary objective to preserve the principal value of the assets. The secondary objective is to grow the principal value of the assets. Investment risk is measured in terms of the total endowment fund; investment assets and allocation between asset classes and strategies are managed to not expose the fund to unacceptable levels of risk.
- TEMPORARILY RESTRICTED NET ASSETS
Temporarily restricted net assets at June 30, 2016 and 2015, consist of contributions received restricted for programs.
- SPECIAL EVENTS
Special event revenue is reflected net of contributions and direct costs of donor benefits as follows for the years ended June 30, 2016 and 2015:
| 2016 | 2015 | |
| Gross Revenue | $208,043 | $203,806 |
| Less contributions | $(195,124) | $(173,312) |
| Less direct costs of donor benefits | $12,919 | $30,494 |
Contributions from special events are included with “Contributions” on the statement of activities.
- RELATED PARTY DISCLOSURE
During the year ended June 30, 2016, the Organization purchased electrical services of approximately $24,000 for the construction of the Advocacy Center from a business owned by a board member’s family.
- FINANCIAL INSTRUMENTS WITH CONCENTRATIONS OF CREDIT RISK
Financial instruments that potentially subject the Organization to concentrations of credit risk consist primarily of cash balances and pledges and accounts receivable. To limit credit risk, the Organization places its cash and cash equivalents with high credit quality financial institutions. The balances in each financial institution are insured by the Federal Deposit Insurance Corporation (FDIC) up to $250,000. The balances, at times, may exceed the federally insured limit.
The Organization’s pledges and accounts receivable are unsecured and are from individuals, corporations, and governmental institutions located within the same geographic region.
- FAIR VALUE MEASUREMENTS
Assets and liabilities recorded at fair value in the statement of financial position are categorized based upon the level of judgment associated with the inputs used to measure their fair value. Level inputs are defined as follows:
Level 1: Unadjusted quoted prices in active markets for identical assets and liabilities.
Level 2: Observable inputs other than those included in Level 1, such as quoted market prices for similar assets or liabilities in active markets, or quoted market prices for identical assets or liabilities in inactive markets.
Level 3: Unobservable inputs reflecting management’s own assumptions about the inputs used in pricing the asset or liability. Level 3 assets and liabilities include financial instruments whose value is determined using pricing models, discounted cash flow methodologies, or similar techniques, as well as instruments for which the determination of fair values requires significant management judgment or estimation.
At June 30, 2009, assets measured on a recurring basis include certificates of deposit totaling $634,740. Fair value of certificates of deposit is determined using level 2 inputs based on amounts as reported by the financial institutions which hold the funds.
- These computations assume Treehouse's "contracts" are contracts with governments. ↵
- There are several versions of the Ten Point Test. The version presented here is based on the version recommended by Dean Mead, Research Manager at the Governmental Accounting Standards Board. A few of the ratios have been changed slightly to reflect the data available to compute national trends. For the original Mead version see Dean Mead, “A Manageable System of Economic Condition Analysis for Governments,” in Public Financial Management, ed. Howard Frank (Boca Raton, FL: Taylor and Francis, 2006); pp.383-419. ↵
- Note that the near-term liabilities ratio was first presented in Karl Nollenberger (2003), Evaluating Financial Condition: A Handbook for Local Government (Washington, DC: ICMA Press) ↵
- Merritt Research Services collects these data and makes them available through the Bloomberg Terminal. ↵