
7.5: Operating Budgets
- Page ID
- 26083
\( \newcommand{\vecs}[1]{\overset { \scriptstyle \rightharpoonup} {\mathbf{#1}} } \)
\( \newcommand{\vecd}[1]{\overset{-\!-\!\rightharpoonup}{\vphantom{a}\smash {#1}}} \)
\( \newcommand{\dsum}{\displaystyle\sum\limits} \)
\( \newcommand{\dint}{\displaystyle\int\limits} \)
\( \newcommand{\dlim}{\displaystyle\lim\limits} \)
\( \newcommand{\id}{\mathrm{id}}\) \( \newcommand{\Span}{\mathrm{span}}\)
( \newcommand{\kernel}{\mathrm{null}\,}\) \( \newcommand{\range}{\mathrm{range}\,}\)
\( \newcommand{\RealPart}{\mathrm{Re}}\) \( \newcommand{\ImaginaryPart}{\mathrm{Im}}\)
\( \newcommand{\Argument}{\mathrm{Arg}}\) \( \newcommand{\norm}[1]{\| #1 \|}\)
\( \newcommand{\inner}[2]{\langle #1, #2 \rangle}\)
\( \newcommand{\Span}{\mathrm{span}}\)
\( \newcommand{\id}{\mathrm{id}}\)
\( \newcommand{\Span}{\mathrm{span}}\)
\( \newcommand{\kernel}{\mathrm{null}\,}\)
\( \newcommand{\range}{\mathrm{range}\,}\)
\( \newcommand{\RealPart}{\mathrm{Re}}\)
\( \newcommand{\ImaginaryPart}{\mathrm{Im}}\)
\( \newcommand{\Argument}{\mathrm{Arg}}\)
\( \newcommand{\norm}[1]{\| #1 \|}\)
\( \newcommand{\inner}[2]{\langle #1, #2 \rangle}\)
\( \newcommand{\Span}{\mathrm{span}}\) \( \newcommand{\AA}{\unicode[.8,0]{x212B}}\)
\( \newcommand{\vectorA}[1]{\vec{#1}} % arrow\)
\( \newcommand{\vectorAt}[1]{\vec{\text{#1}}} % arrow\)
\( \newcommand{\vectorB}[1]{\overset { \scriptstyle \rightharpoonup} {\mathbf{#1}} } \)
\( \newcommand{\vectorC}[1]{\textbf{#1}} \)
\( \newcommand{\vectorD}[1]{\overrightarrow{#1}} \)
\( \newcommand{\vectorDt}[1]{\overrightarrow{\text{#1}}} \)
\( \newcommand{\vectE}[1]{\overset{-\!-\!\rightharpoonup}{\vphantom{a}\smash{\mathbf {#1}}}} \)
\( \newcommand{\vecs}[1]{\overset { \scriptstyle \rightharpoonup} {\mathbf{#1}} } \)
\(\newcommand{\longvect}{\overrightarrow}\)
\( \newcommand{\vecd}[1]{\overset{-\!-\!\rightharpoonup}{\vphantom{a}\smash {#1}}} \)
\(\newcommand{\avec}{\mathbf a}\) \(\newcommand{\bvec}{\mathbf b}\) \(\newcommand{\cvec}{\mathbf c}\) \(\newcommand{\dvec}{\mathbf d}\) \(\newcommand{\dtil}{\widetilde{\mathbf d}}\) \(\newcommand{\evec}{\mathbf e}\) \(\newcommand{\fvec}{\mathbf f}\) \(\newcommand{\nvec}{\mathbf n}\) \(\newcommand{\pvec}{\mathbf p}\) \(\newcommand{\qvec}{\mathbf q}\) \(\newcommand{\svec}{\mathbf s}\) \(\newcommand{\tvec}{\mathbf t}\) \(\newcommand{\uvec}{\mathbf u}\) \(\newcommand{\vvec}{\mathbf v}\) \(\newcommand{\wvec}{\mathbf w}\) \(\newcommand{\xvec}{\mathbf x}\) \(\newcommand{\yvec}{\mathbf y}\) \(\newcommand{\zvec}{\mathbf z}\) \(\newcommand{\rvec}{\mathbf r}\) \(\newcommand{\mvec}{\mathbf m}\) \(\newcommand{\zerovec}{\mathbf 0}\) \(\newcommand{\onevec}{\mathbf 1}\) \(\newcommand{\real}{\mathbb R}\) \(\newcommand{\twovec}[2]{\left[\begin{array}{r}#1 \\ #2 \end{array}\right]}\) \(\newcommand{\ctwovec}[2]{\left[\begin{array}{c}#1 \\ #2 \end{array}\right]}\) \(\newcommand{\threevec}[3]{\left[\begin{array}{r}#1 \\ #2 \\ #3 \end{array}\right]}\) \(\newcommand{\cthreevec}[3]{\left[\begin{array}{c}#1 \\ #2 \\ #3 \end{array}\right]}\) \(\newcommand{\fourvec}[4]{\left[\begin{array}{r}#1 \\ #2 \\ #3 \\ #4 \end{array}\right]}\) \(\newcommand{\cfourvec}[4]{\left[\begin{array}{c}#1 \\ #2 \\ #3 \\ #4 \end{array}\right]}\) \(\newcommand{\fivevec}[5]{\left[\begin{array}{r}#1 \\ #2 \\ #3 \\ #4 \\ #5 \\ \end{array}\right]}\) \(\newcommand{\cfivevec}[5]{\left[\begin{array}{c}#1 \\ #2 \\ #3 \\ #4 \\ #5 \\ \end{array}\right]}\) \(\newcommand{\mattwo}[4]{\left[\begin{array}{rr}#1 \amp #2 \\ #3 \amp #4 \\ \end{array}\right]}\) \(\newcommand{\laspan}[1]{\text{Span}\{#1\}}\) \(\newcommand{\bcal}{\cal B}\) \(\newcommand{\ccal}{\cal C}\) \(\newcommand{\scal}{\cal S}\) \(\newcommand{\wcal}{\cal W}\) \(\newcommand{\ecal}{\cal E}\) \(\newcommand{\coords}[2]{\left\{#1\right\}_{#2}}\) \(\newcommand{\gray}[1]{\color{gray}{#1}}\) \(\newcommand{\lgray}[1]{\color{lightgray}{#1}}\) \(\newcommand{\rank}{\operatorname{rank}}\) \(\newcommand{\row}{\text{Row}}\) \(\newcommand{\col}{\text{Col}}\) \(\renewcommand{\row}{\text{Row}}\) \(\newcommand{\nul}{\text{Nul}}\) \(\newcommand{\var}{\text{Var}}\) \(\newcommand{\corr}{\text{corr}}\) \(\newcommand{\len}[1]{\left|#1\right|}\) \(\newcommand{\bbar}{\overline{\bvec}}\) \(\newcommand{\bhat}{\widehat{\bvec}}\) \(\newcommand{\bperp}{\bvec^\perp}\) \(\newcommand{\xhat}{\widehat{\xvec}}\) \(\newcommand{\vhat}{\widehat{\vvec}}\) \(\newcommand{\uhat}{\widehat{\uvec}}\) \(\newcommand{\what}{\widehat{\wvec}}\) \(\newcommand{\Sighat}{\widehat{\Sigma}}\) \(\newcommand{\lt}{<}\) \(\newcommand{\gt}{>}\) \(\newcommand{\amp}{&}\) \(\definecolor{fillinmathshade}{gray}{0.9}\)In this Operating Budget section, we will discuss the following budgets:
- Sales Budget
- Production Budget
- Cost of Goods Sold Budget
- Selling and Administrative Expense Budget
- Income Statement
Sales budget The cornerstone of the budgeting process is the sales budget because the usefulness of the entire operating budget depends on it. The sales budget involves estimating or forecasting how much demand exists for a company’s goods and then determining if a realistic, attainable profit can be achieved based on this demand. Sales forecasting can involve either formal or informal techniques, or both. The video below illustrates a sales budget (watch the first 4 minutes of the video only for the sales budget).
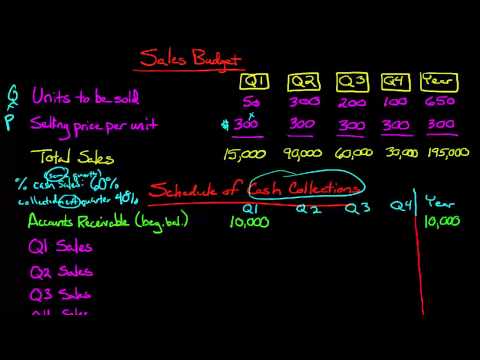
A YouTube element has been excluded from this version of the text. You can view it online here: pb.libretexts.org/llmanagerialaccounting/?p=156
Formal sales forecasting techniques often involve the use of statistical tools. For example, to predict sales for the coming period, management may use economic indicators (or variables) such as the gross national product or gross national personal income, and other variables such as population growth, per capita income, new construction, and population migration.
To use economic indicators to forecast sales, a relationship must exist between the indicators (called independent variables) and the sales that are being forecast (called the dependent variable). Then management can use statistical techniques to predict sales based on the economic indicators.
Management often supplements formal techniques with informal sales forecasting techniques such as intuition or judgment. In some instances, management modifies sales projections using formal techniques based on other changes in the environment. Examples include the effect on sales of any changes in the expected level of advertising expenditures, the entry of new competitors, and/or the addition or elimination of products or sales territories. In other instances, companies do not use any formal techniques. Instead, sales managers and salespersons estimate how much they can sell. Managers then add up the estimates to arrive at total estimated sales for the period.
Usually, the sales manager is responsible for the sales budget and prepares it in units and then in dollars by multiplying the units by their selling price. The sales budget in units is the basis of the remaining budgets that support the operating budget.
We will be illustrating the step-by-step preparation of a master budget for Leed Company, which manufactures low-priced running shoes. Most companies develop the sales budget in units and sales dollars because the remaining budgets will use both sales units and sales dollars.
To illustrate this step, assume that Leed’s management forecasts sales for the year at 100,000 units (each pair of shoes is one unit). Quarterly sales are expected to be 15,000, 40,000, 20,000, and 25,000 units, reflecting higher demand for shoes in the late spring and again around Christmas. The selling price for each pair of shoes forecasted at $40. Leed’s sales budget would be prepared as by showing the sales unit for each quarter x budgeted sales price to get the sales in dollars. The totals for the year are added from each quarter.
| Leed Company | |||||
| Sales Budget | |||||
| Qtr 1 | Qtr 2 | Qtr 3 | Qtr 4 | YEAR | |
| Sales in Units | 15,000 | 40,000 | 20,000 | 25,000 | 100,000 |
| Budgeted price | x $40 | x $40 | x $40 | x $40 | |
| Sales in Dollars | $600,000 | $1,600,000 | $800,000 | $1,000,000 | $4,000,000 |
Production budget The production budget considers the units in the sales budget and the company’s inventory policy. Managers develop the production budget in units and then in dollars. Determining production volume is an important task. Companies should schedule production carefully to maintain certain minimum quantities of inventory while avoiding excessive inventory accumulation. The principal objective of the production budget is to coordinate the production and sale of goods in terms of time and quantity.
Companies using a just-in-time inventory system need to closely coordinate purchasing, sales, and production. In general, maintaining high inventory levels allows for more flexibility in coordinating purchases, sales, and production. However, businesses must compare the convenience of carrying inventory with the cost of carrying inventory; for example, they must consider storage costs and the opportunity cost of funds tied up in inventory. Watch this video for an example of how to create a production budget.
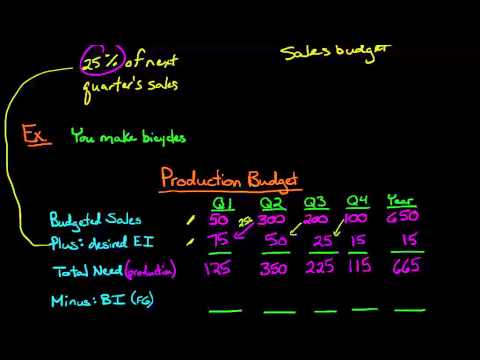
A YouTube element has been excluded from this version of the text. You can view it online here: pb.libretexts.org/llmanagerialaccounting/?p=156
Firms often subdivide the production budget into budgets for materials, labor, and manufacturing overhead, which we will discuss in the manufacturing budgets. Usually materials, labor, and some elements of manufacturing overhead vary directly with production within a given relevant range of production. Fixed manufacturing overhead costs do not vary directly with production but are constant in total within a relevant range of production. To determine fixed manufacturing overhead costs accurately, management must determine the relevant range for the expected level of operations.
For our example company, Leed Company, we assume the company’s policy is to maintain 40% of next quarters sales in ending inventory. Finished goods inventory on January 1 is 10,000 units (Note: You should be given this information but if you do not have the beginning inventory, you can assume the company followed the same ending inventory policy. This means, you can calculate beginning finished goods inventory as Quarter 1 sales x 40% since we can assume the company followed this policy and the ending inventory of 4th quarter last year is the beginning inventory of this year). We anticipate the December 31 ending inventory to be 6,000 units. From these data, we can prepare the schedule of planned production using the Sales budget as our starting place.
| Leed Company | |||||
| Production Budget | |||||
| Qtr 1 | Qtr 2 | Qtr 3 | Qtr 4 | YEAR | |
| Sales in Units | 15,000 | 40,000 | 20,000 | 25,000 | 100,000 |
| Add: Desired Ending Inventory | 16,000 | 8,000 | 10,000 | 6,000 | 6,000 |
| (Next Qtr Sales x 40%) | (40,000 x 40%) | (20,000 x 40%) | (25,000 x 40%) | (given) | |
| Total Units Needed | 31,000 | 48,000 | 30,000 | 31,000 | 106,000 |
| Less: Beginning Inventory | 10,000 | 16,000 | 8,000 | 10,000 | 10,000 |
| Units to be Produced | 21,000 | 32,000 | 22,000 | 21,000 | 96,000 |
Important things to note:
- Desired ending inventory is calculated as next quarter sales units x 40% in Leed’s case since the company policy is to maintain 40% of next quarters sales in ending inventory.
- Quarter 4 ending inventory is the same number used for ending inventory for the year.
- Quarter 1 beginning inventory is the same number used for beginning inventory for the year.
- Quarter 2 beginning inventory is quarter 1’s ending inventory since the balance rolls over the to next period. This means, quarter 3 beginning inventory is quarter 2’s ending inventory and quarter 4 beginning inventory is quarter 3’s ending inventory.
- Inventory refers to Finished Goods Inventory for a manufacturer.
For a merchandiser, this budget would be called a Purchases Budget and would show how many units we would need to purchase for each quarter. The inventory in this case would refer to merchandise inventory. You can see an example of a purchases budget in the Budgets for a Merchandiser section later in this chapter.
Cost of Goods Sold budget The cost of goods sold budget establishes the forecast for the inventory expense and is usually on of the largest expenses on an income statement. A cost of goods sold budget would not be necessary for a service company since they do not sell a product. Management must now prepare a schedule to forecast cost of goods sold, the next major amount in the planned operating budget. We need to understand the costs for making the product. Leed Company has the following costs:
| Direct Materials | $ 10 per unit |
| Direct Labor | $ 6 per unit |
| Variable Overhead | $ 0.75 per unit |
| Fixed Overhead | $75,000 per quarter |
The cost of goods sold budget would use the sales budget in units. We will take each of our variable costs (direct materials, direct labor and variable overhead) x budgeted sales units. The cost of goods sold budget would look like:
| Leed Company | |||||
| Cost of Goods Sold Budget | |||||
| Qtr 1 | Qtr 2 | Qtr 3 | Qtr 4 | YEAR | |
| Sales in Units | 15,000 | 40,000 | 20,000 | 25,000 | 100,000 |
| Direct Materials ($10 per unit) | $150,000 | $400,000 | $200,000 | $250,000 | $1,000,000 |
| Direct Labor ($6 per unit) | 90,000 | 240,000 | 120,000 | 150,000 | 600,000 |
| Variable Overhead ($0.75 per unit) | 11,250 | 30,000 | 15,000 | 18,750 | 75,000 |
| Fixed Overhead | 75,000 | 75,000 | 75,000 | 75,000 | 300,000 |
| Cost of Goods Sold | $326,250 | $745,000 | $410,000 | $493,740 | $1,975,000 |
After managers forecast cost of goods sold, they prepare a separate budget for all selling and administrative expenses.
Selling and administrative expense budget The costs of selling a product are closely related to the sales forecast. Generally, the higher the forecast, the higher the selling expenses. Administrative expenses are likely to be less dependent on the sales forecast because many of the items are fixed costs (e.g. salaries of administrative personnel and depreciation of administrative buildings and office equipment). Managers must also estimate other expenses such as interest expense, income tax expense, and research and development expenses.
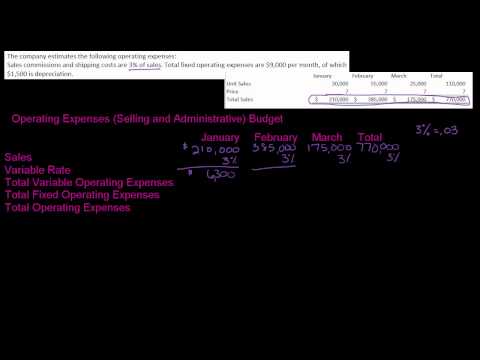
A YouTube element has been excluded from this version of the text. You can view it online here: pb.libretexts.org/llmanagerialaccounting/?p=156
For Leed Company, we need to know the following information:
- Selling expenses are $2 per unit sold
- Administrative expenses are $100,000 per quarter
We can calculate Leed Company’s Selling and Administrative Expense Budget using the information above and the sales budget. For selling expenses, we will take the sales in units x $2 variable selling expense per unit. Administrative expenses are fixed so they will not change based on volume. Fixed expenses include depreciation on the office building of $20,000 per quarter.
| Leed Company | |||||
| Selling and Administrative Budget | |||||
| Qtr 1 | Qtr 2 | Qtr 3 | Qtr 4 | YEAR | |
| Selling Expenses | 30,000 | 80,000 | 40,000 | 50,000 | 200,000 |
| (Current qtr units sold x $2 per unit) | (15,000 units x $2) | (40,000 units x $2) | (20,000 units x $2) | (25,000 units x $2) | |
| Administrative Expenses | 100,000 | 100,000 | 100,000 | 100,000 | 400,000 |
| Total Selling and Admin Expenses | $130,000 | $180,000 | $140,000 | $150,000 | $600,000 |
| Less: Office Bldg Depreciation | (20,000) | (20,000) | (20,000) | (20,000) | (80,000) |
| Total Cash payments for selling and admin. expenses | $110,000 | $160,000 | $120,000 | $130,000 | $520,000 |
Notice, depreciation is subtracted from the total budget to get total cash payments — why? Because, depreciation is a non-cash expense and is not paid with cash so we will remove it from the other cash payments to use in the cash budget. The next step is to prepare the budgeted income statement.
Budgeted Income Statement
We will use a standard multi-step income statement showing sales minus gross profit is gross profit (or gross margin). Gross profit minus operating expenses is the income from operations. We will need the Sales budget, Cost of goods sold budget, and the Selling and Administrative expense budgets.
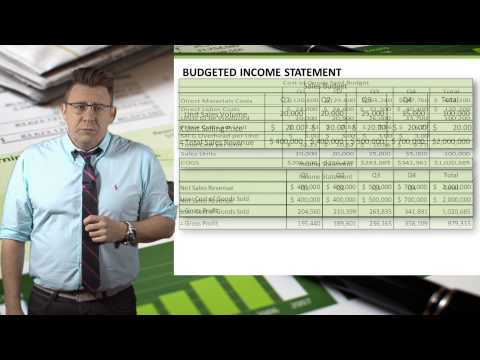
A YouTube element has been excluded from this version of the text. You can view it online here: pb.libretexts.org/llmanagerialaccounting/?p=156
We will use the information from the sales budget, cost of goods sold budget, and selling and administrative expense budget. Note: Remember, to use the full budget amount for selling and administrative expenses and not the cash payments amount. Leed Company pays a 40% income tax rate (multiply income from operations x 40% for each quarter).
| Leed Company | ||||||
| Budgeted Income Statement | ||||||
| Qtr 1 | Qtr 2 | Qtr 3 | Qtr 4 | YEAR | ||
| Sales (in dollars) | $600,000 | 1,600,000 | 800,000 | 1,000,000 | 4,000,000 | from Sales budget |
| Less: Cost of goods sold | 326,250 | 745,000 | 410,000 | 493,750 | 1,975,000 | from Cost of Goods Sold budget |
| Gross Profit | 273,750 | 855,000 | 390,000 | 506,250 | 2,025,000 | (Sales – Cost of good sold) |
| Operating Expenses: | ||||||
| Selling Expenses | 30,000 | 80,000 | 40,000 | 50,000 | 200,000 | from Selling and Admin budget |
| Administrative Expenses | 100,000 | 100,000 | 100,000 | 100,000 | 400,000 | |
| Income from operations | $143,750 | 675,000 | 250,000 | 356,250 | $1,425,000 | (Gross Profit – Selling and Admin expense) |
| Less: Income tax expense (40%) | 57,500 | 270,000 | 100,000 | 142,500 | 570,000 | |
| Net Income | $86,250 | $405,000 | $150,000 | $213,750 | $855,000 | |
We look look at the manufacturing budgets and cash budget next.
- Accounting Principles: A Business Perspective. Authored by: James Don Edwards, University of Georgia & Roger H. Hermanson, Georgia State University. Provided by: Endeavour International Corporation. Project: The Global Text Project. License: CC BY: Attribution
- The Production Budget. Authored by: Education Unlocked. Located at: youtu.be/YwIUeaFkOS8. License: All Rights Reserved. License Terms: Standard YouTube License
- The Sales Budget. Authored by: Education Unlocked. Located at: youtu.be/frCX_bsFsao. License: All Rights Reserved. License Terms: Standard YouTube License
- Operating Expenses (Selling and Administrative) Budget . Authored by: Kristin Ingram. Located at: youtu.be/kKlfC8iv-xY. License: All Rights Reserved. License Terms: Standard YouTube License
- Managerial Accounting: Budgeted Income Statement . Authored by: Prof Alldredge. Located at: youtu.be/l5BBOZHhfjM. License: CC BY: Attribution