
3.5: Mapping Strategic Groups
- Page ID
- 53966

Understanding Strategic Groups
The analysis of the strategic groups in an industry can offer important insights to executives. Strategic groups are sets of firms that follow similar strategies to one another (Hunt, 1972; Short et al., 2007). More specifically, a strategic group consists of a set of industry competitors that have similar characteristics to one another but differ in important ways from the members of other groups (Table 3.15).
Understanding the nature of strategic groups within an industry is important for at least three reasons. First, emphasizing the members of a firm’s group is helpful because these firms are usually its closest rivals. When assessing their firm’s performance and considering strategic moves, the other members of a group are often the best referents for executives to consider. In some cases, one or more strategic groups in the industry are irrelevant. Subway, for example, does not need to worry about competing for customers with the likes of Ruth’s Chris Steak House and P. F. Chang’s. This is partly because firms confront mobility barriers that make it difficult or illogical for a particular firm to change groups over time. Because Subway is unlikely to offer a gourmet steak as well as the experience offered by fine dining outlets, they can largely ignore the actions taken by firms in that restaurant industry strategic group.
Second, the strategies pursued by firms within other strategic groups highlight alternative paths to success. A firm may be able to borrow an idea from another strategic group and use this idea to improve its situation. During the recession of the late 2000s, mid-quality restaurant chains such as Applebee’s and Chili’s used a variety of promotions such as coupons and meal combinations to try to attract budget-conscious consumers. Firms such as Subway and Quiznos that already offered low-priced meals still had an inherent price advantage over Applebee’s and Chili’s, however: there is no tipping expected at the former restaurants, but there is at the latter. It must have been tempting to executives at Applebee’s and Chili’s to try to expand their appeal to budget-conscious consumers by experimenting with operating formats that do not involve tipping.
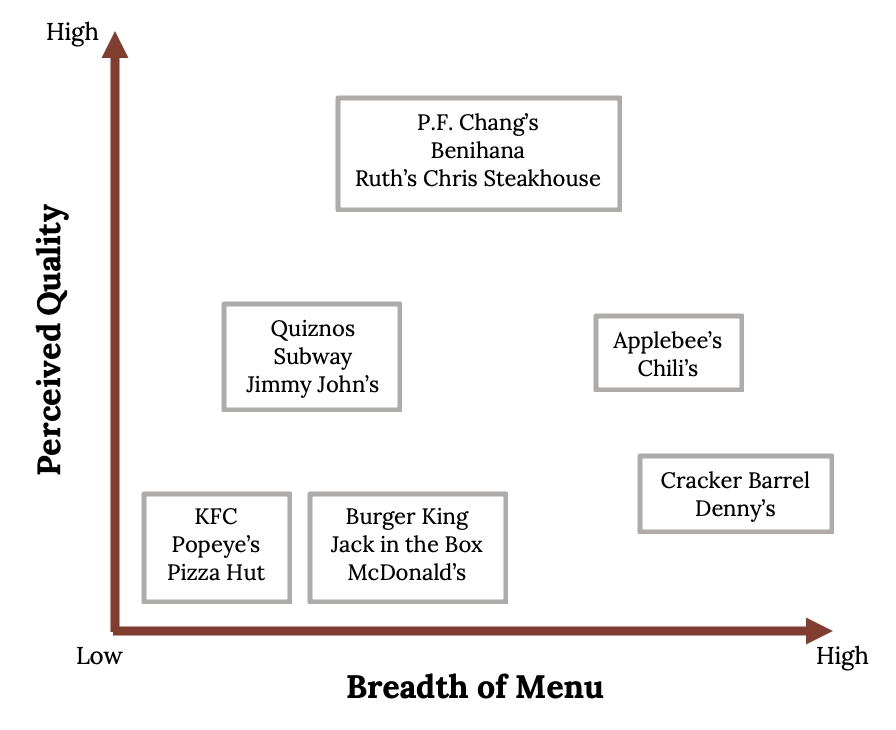
Third, the analysis of strategic groups can reveal gaps in the industry that represent untapped opportunities. Within the restaurant business, for example, it appears that no national chain offers both very high quality meals and a very diverse menu. Perhaps the firm that comes the closest to filling this niche is the Cheesecake Factory, a chain of approximately 150 outlets whose menu includes more than 200 lunch, dinner, and dessert items. Ruth’s Chris Steak House already offers very high quality food; its executives could consider moving the firm toward offering a very diverse menu as well. This would involve considerable risk, however. Perhaps no national chain offers both very high quality meals and a very diverse menu because doing so is extremely difficult. Nevertheless, examining the strategic groups in an industry with an eye toward untapped opportunities offers executives a chance to consider novel ideas.

Designing a Strategic Group Map
To develop a strategic group map for an industry, the competitive factors for each of the two axes must be selected. On the vertical axis, price is often the measurement used. A different parameter that further differentiates the members of the industry is chosen for the horizontal axis. For the airline industry, for example, it could be the number of routes flown. It can be the breadth of models offered by each car manufacturer in the automobile industry. The competitive factors should be chosen based on the market characteristics that are to be examined, usually the most important ones.
Once the various firms in the industry are plotted on the strategic group map, the natural groupings of the companies can be determined and circled. The stiffest competition in the industry typically happens within each strategic group. Profitability between each group often varies. It is generally difficult to move from one group to another, as mobility barriers exist hindering the ability of a firm to impact the chosen competitive factors being measured.
Section Video
Strategic Group Mapping [05:42]
The video for this lesson gives further insights and an example of constructing a strategic group map.
You can view this video here: https://youtu.be/CcF3ZMgXQrA.
Key Takeaway
- Examination of the strategic groups in an industry provides a firm’s executives with a better understanding of their closest rivals, reveals alternative paths to success, and highlights untapped opportunities.
Exercises
- What other colleges and universities are probably in your school’s strategic group?
- From what other groups of colleges and universities could your school learn? What specific ideas could be borrowed from these groups?
References
Hunt, M. S. (1972). Competition in the major home appliance industry 1960–1970. [Unpublished doctoral dissertation]. Harvard University.
Short, J. C., Ketchen, D. J., Palmer, T., & Hult, G. T. (2007). Firm, strategic group, and industry influences on performance. Strategic Management Journal, 28, 147–167.
Image Credits
Figure 3.15: Kindred Grey (2020). “Breadth of menu vs. Quality” CC BY-SA 4.0. Retrieved from commons.wikimedia.org/wiki/File:Breadth_of_menu_vs._Quality.png.
Figure 3.16: With wind. “Steak.” CC BY-NC 2.0. Cropped. Retrieved from https://flic.kr/p/brpy2C.
Video Credits
ddd9255. (2013, September 1). Strategic group mapping [Video]. YouTube. https://youtu.be/CcF3ZMgXQrA.