Building the Aggregate Expenditure Schedule
The income-expenditure model determines the equilibrium level of real GDP, from which one can infer the level of employment in the economy. The crux of the model is the aggregate expenditure schedule (or curve). Recall that aggregate expenditure is the sum of four parts: consumer expenditure, investment expenditure, government expenditure and net export expenditure.
Aggregate Expenditure = C + I + G + (X – M)
A key part of the Income-Expenditure model is understanding that as national income (or GDP) rises, so does aggregate expenditure. Over the next few pages, we’ll review the components of aggregate expenditure, and examine how they are affected by national income. Then we will add the four components together to get aggregate expenditure.
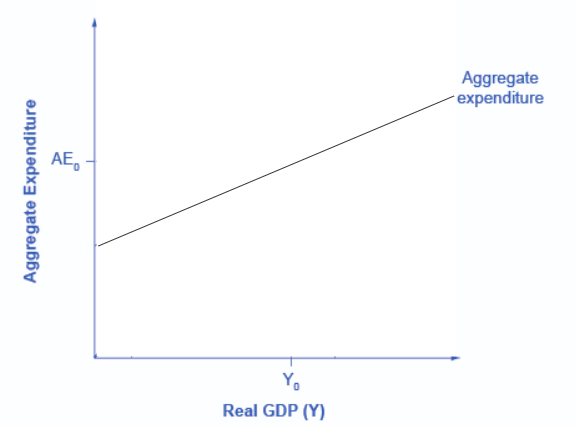
Figure 1. The Aggregate Expenditure Function shows the relationship between national income and aggregate expenditure.
You should know that most of the material in the following pages is not new
—we introduced it previously in the section on aggregate demand in Keynesian analysis. We are just looking at the material from a slightly different angle.
Glossary
[glossary-page][glossary-term]Aggregate Expenditure Function: [/glossary-term][glossary-definition] graphical relationship between national income as a function of aggregate expenditure, which is defined as consumption plus investment plus government spending plus net exports[/glossary-definition][glossary-term]Aggregate Expenditure Schedule[/glossary-term][glossary-definition]aggregate expenditure function expressed as a table[/glossary-definition][/glossary-page]
