
2.7: Identifying Trends of a Graph
- Page ID
- 45787

\( \newcommand{\vecs}[1]{\overset { \scriptstyle \rightharpoonup} {\mathbf{#1}} } \)
\( \newcommand{\vecd}[1]{\overset{-\!-\!\rightharpoonup}{\vphantom{a}\smash {#1}}} \)
\( \newcommand{\id}{\mathrm{id}}\) \( \newcommand{\Span}{\mathrm{span}}\)
( \newcommand{\kernel}{\mathrm{null}\,}\) \( \newcommand{\range}{\mathrm{range}\,}\)
\( \newcommand{\RealPart}{\mathrm{Re}}\) \( \newcommand{\ImaginaryPart}{\mathrm{Im}}\)
\( \newcommand{\Argument}{\mathrm{Arg}}\) \( \newcommand{\norm}[1]{\| #1 \|}\)
\( \newcommand{\inner}[2]{\langle #1, #2 \rangle}\)
\( \newcommand{\Span}{\mathrm{span}}\)
\( \newcommand{\id}{\mathrm{id}}\)
\( \newcommand{\Span}{\mathrm{span}}\)
\( \newcommand{\kernel}{\mathrm{null}\,}\)
\( \newcommand{\range}{\mathrm{range}\,}\)
\( \newcommand{\RealPart}{\mathrm{Re}}\)
\( \newcommand{\ImaginaryPart}{\mathrm{Im}}\)
\( \newcommand{\Argument}{\mathrm{Arg}}\)
\( \newcommand{\norm}[1]{\| #1 \|}\)
\( \newcommand{\inner}[2]{\langle #1, #2 \rangle}\)
\( \newcommand{\Span}{\mathrm{span}}\) \( \newcommand{\AA}{\unicode[.8,0]{x212B}}\)
\( \newcommand{\vectorA}[1]{\vec{#1}} % arrow\)
\( \newcommand{\vectorAt}[1]{\vec{\text{#1}}} % arrow\)
\( \newcommand{\vectorB}[1]{\overset { \scriptstyle \rightharpoonup} {\mathbf{#1}} } \)
\( \newcommand{\vectorC}[1]{\textbf{#1}} \)
\( \newcommand{\vectorD}[1]{\overrightarrow{#1}} \)
\( \newcommand{\vectorDt}[1]{\overrightarrow{\text{#1}}} \)
\( \newcommand{\vectE}[1]{\overset{-\!-\!\rightharpoonup}{\vphantom{a}\smash{\mathbf {#1}}}} \)
\( \newcommand{\vecs}[1]{\overset { \scriptstyle \rightharpoonup} {\mathbf{#1}} } \)
\( \newcommand{\vecd}[1]{\overset{-\!-\!\rightharpoonup}{\vphantom{a}\smash {#1}}} \)
\(\newcommand{\avec}{\mathbf a}\) \(\newcommand{\bvec}{\mathbf b}\) \(\newcommand{\cvec}{\mathbf c}\) \(\newcommand{\dvec}{\mathbf d}\) \(\newcommand{\dtil}{\widetilde{\mathbf d}}\) \(\newcommand{\evec}{\mathbf e}\) \(\newcommand{\fvec}{\mathbf f}\) \(\newcommand{\nvec}{\mathbf n}\) \(\newcommand{\pvec}{\mathbf p}\) \(\newcommand{\qvec}{\mathbf q}\) \(\newcommand{\svec}{\mathbf s}\) \(\newcommand{\tvec}{\mathbf t}\) \(\newcommand{\uvec}{\mathbf u}\) \(\newcommand{\vvec}{\mathbf v}\) \(\newcommand{\wvec}{\mathbf w}\) \(\newcommand{\xvec}{\mathbf x}\) \(\newcommand{\yvec}{\mathbf y}\) \(\newcommand{\zvec}{\mathbf z}\) \(\newcommand{\rvec}{\mathbf r}\) \(\newcommand{\mvec}{\mathbf m}\) \(\newcommand{\zerovec}{\mathbf 0}\) \(\newcommand{\onevec}{\mathbf 1}\) \(\newcommand{\real}{\mathbb R}\) \(\newcommand{\twovec}[2]{\left[\begin{array}{r}#1 \\ #2 \end{array}\right]}\) \(\newcommand{\ctwovec}[2]{\left[\begin{array}{c}#1 \\ #2 \end{array}\right]}\) \(\newcommand{\threevec}[3]{\left[\begin{array}{r}#1 \\ #2 \\ #3 \end{array}\right]}\) \(\newcommand{\cthreevec}[3]{\left[\begin{array}{c}#1 \\ #2 \\ #3 \end{array}\right]}\) \(\newcommand{\fourvec}[4]{\left[\begin{array}{r}#1 \\ #2 \\ #3 \\ #4 \end{array}\right]}\) \(\newcommand{\cfourvec}[4]{\left[\begin{array}{c}#1 \\ #2 \\ #3 \\ #4 \end{array}\right]}\) \(\newcommand{\fivevec}[5]{\left[\begin{array}{r}#1 \\ #2 \\ #3 \\ #4 \\ #5 \\ \end{array}\right]}\) \(\newcommand{\cfivevec}[5]{\left[\begin{array}{c}#1 \\ #2 \\ #3 \\ #4 \\ #5 \\ \end{array}\right]}\) \(\newcommand{\mattwo}[4]{\left[\begin{array}{rr}#1 \amp #2 \\ #3 \amp #4 \\ \end{array}\right]}\) \(\newcommand{\laspan}[1]{\text{Span}\{#1\}}\) \(\newcommand{\bcal}{\cal B}\) \(\newcommand{\ccal}{\cal C}\) \(\newcommand{\scal}{\cal S}\) \(\newcommand{\wcal}{\cal W}\) \(\newcommand{\ecal}{\cal E}\) \(\newcommand{\coords}[2]{\left\{#1\right\}_{#2}}\) \(\newcommand{\gray}[1]{\color{gray}{#1}}\) \(\newcommand{\lgray}[1]{\color{lightgray}{#1}}\) \(\newcommand{\rank}{\operatorname{rank}}\) \(\newcommand{\row}{\text{Row}}\) \(\newcommand{\col}{\text{Col}}\) \(\renewcommand{\row}{\text{Row}}\) \(\newcommand{\nul}{\text{Nul}}\) \(\newcommand{\var}{\text{Var}}\) \(\newcommand{\corr}{\text{corr}}\) \(\newcommand{\len}[1]{\left|#1\right|}\) \(\newcommand{\bbar}{\overline{\bvec}}\) \(\newcommand{\bhat}{\widehat{\bvec}}\) \(\newcommand{\bperp}{\bvec^\perp}\) \(\newcommand{\xhat}{\widehat{\xvec}}\) \(\newcommand{\vhat}{\widehat{\vvec}}\) \(\newcommand{\uhat}{\widehat{\uvec}}\) \(\newcommand{\what}{\widehat{\wvec}}\) \(\newcommand{\Sighat}{\widehat{\Sigma}}\) \(\newcommand{\lt}{<}\) \(\newcommand{\gt}{>}\) \(\newcommand{\amp}{&}\) \(\definecolor{fillinmathshade}{gray}{0.9}\)Learning outcome
- Recognize the trend of a graph
Data from the real world typically does not follow a perfect line or precise pattern. However, depending on the data, it does often follow a trend. Trends can be observed overall or for a specific segment of the graph. When looking a graph to determine its trend, there are usually four options to describe what you are seeing.
Graph Trends
- One variable increases as the other increases
- One variable decreases as the other increases
- There is no change in one variable as the other increases or decreases
- The data is so scattered and random that no trend can be determined from the graph
Let’s take a look at some graph depicting real data and see what we can determine about their trends.
Example
The graph below shows the closing value in ($) of the Dow Jones index in relation to the year. What is the overal trend of this data?
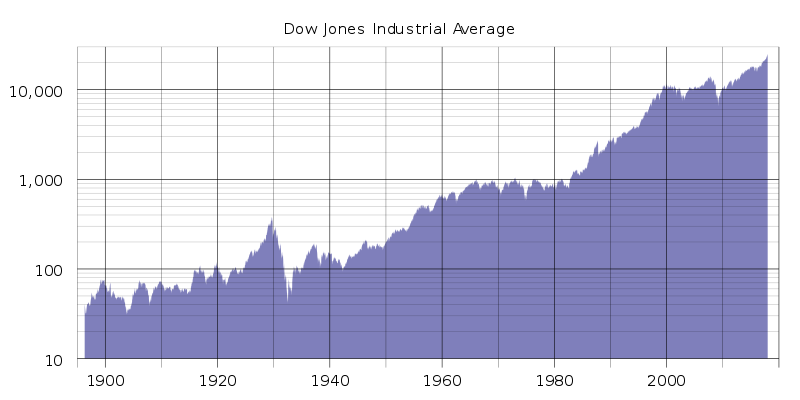
Though the points don’t create a perfect line, if you hold your pencil over the data points, you can see that a diagonal line going up to the right is formed. If we pick pick a point from each end we can analyze the values. In \(1920\) the Dow Jones was at about \($100\). In \(2000\) the Dow Jones was at about \($10,000\). So as the years increased by \(80\), the value of the index increased by \($9,900\).
We can say that the data on this graph fits the trend — “one variable increases as the other increases”.
As time passes, or the years increase, the value of the Dow Jones also increases.
TrY IT
Now let’s look at a graph that show the global temperature differences collected over the 100+ years. How would you describe the trend of this graph?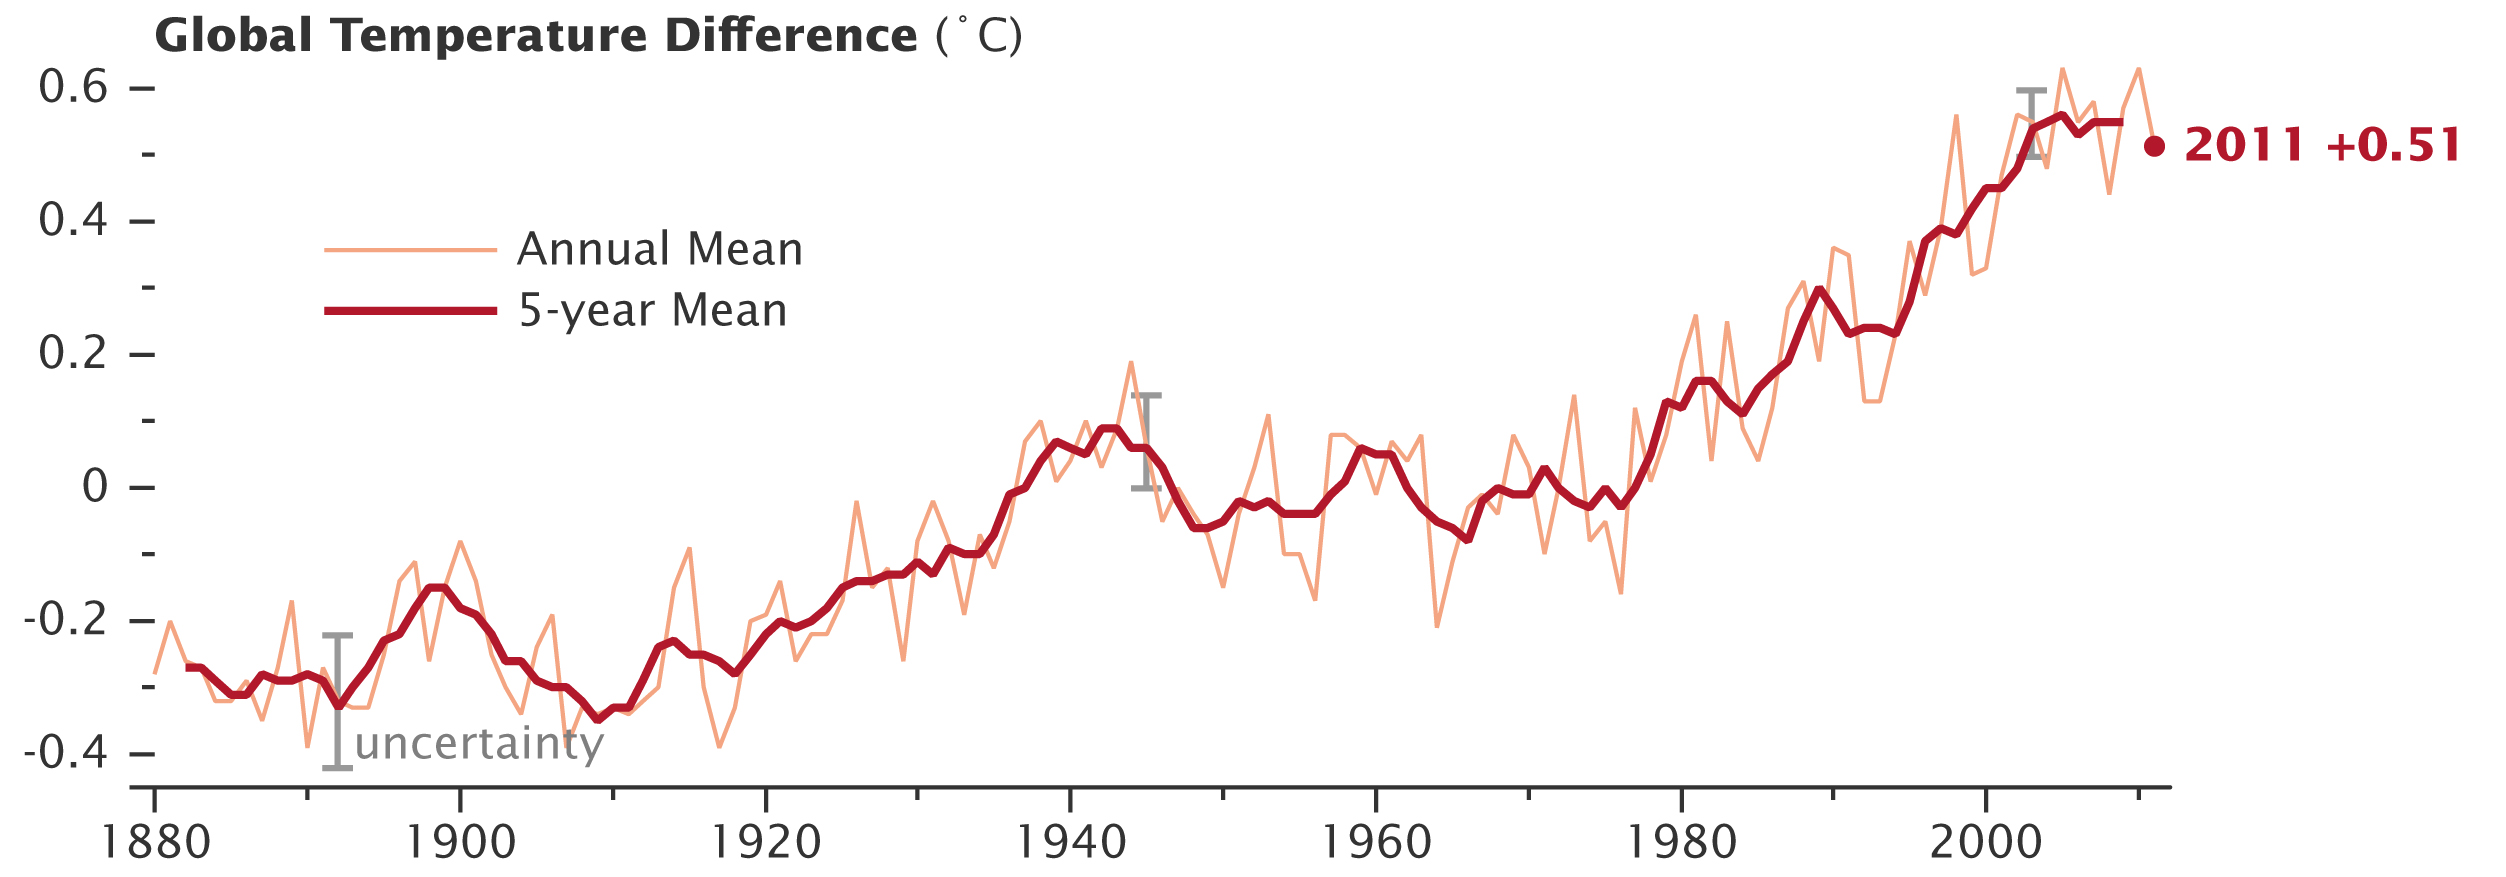
[reveal-answer q=”785039″]Show Answer[/reveal-answer]
[hidden-answer a=”785039″]
Holding a straight edge over the data points gives us an approximate line that rises up to the right.
Taking some endpoints allows us to collect more evidence for our answer:
In \(1910\) the temperature difference was at about \(-0.3^{\circ}C\).
In \(2000\) the temperature difference was at about \(0.4^{\circ}C\).
The global temperature difference increases as time passes, or as the years increase.
[/hidden-answer]
ExAMPLE
The following graph shows the fertility rate in various regions in a hundred year range.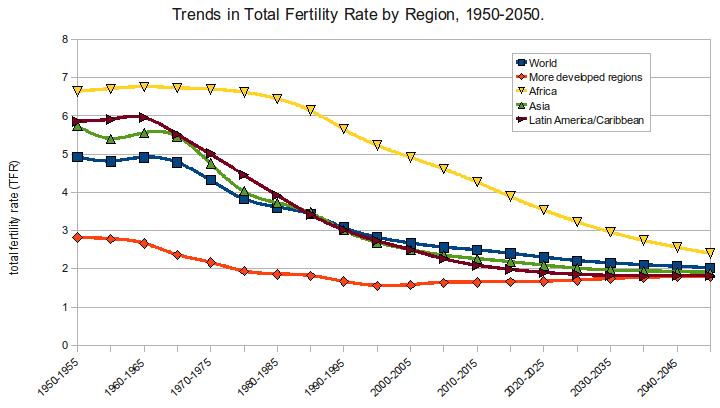
Looking at this graph we can observe overall trends, individual regions, or segments of time.
- What would you say is the overall trend of this data (Worldwide)?
- What is the trend in more developed regions (red line w/ diamond points)?
[reveal-answer q=”50301″]Show Answer[/reveal-answer]
[hidden-answer a=”50301″]
- The worldwide data is depicted on the blue line with square points. Holding a straight edge gives us a shallow line that goes down to the right. This implies that the trend is the fertility rate decrease over time, or as the years increase.
- The developed regions line starts with a slight decrease over time and then a very slight increase after the lowest point. The change is not enough to infer a consistent pattern, so the trend is that the fertility rate is static or unchanging over time, or as the years increase.
[/hidden-answer]
TRY IT
The graph below show the marriage rates in Great Britain over the past \(80\) years.
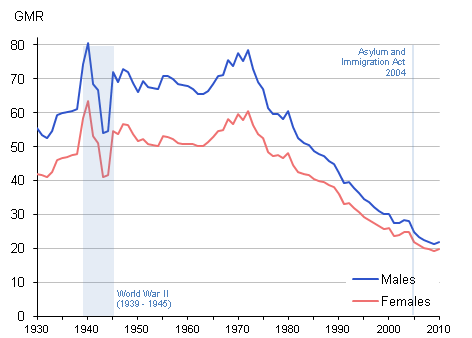
Looking at this graph answer the following questions.
- What is the trend of this data for males between \(1940\) and \(1975\)?
- What is the trend of this data for females between \(1980\) and \(2010\)?
[reveal-answer q=”447895″]Show Answer[/reveal-answer]
[hidden-answer a=”447895″]
- For males (the blue line), the data for \(1940\) and \(1975\) looks to be the same, \(70\). So even though there are lots and up and downs between, there is no consistent increase or decrease. The trend for males during this time period is that the marriage rate was unchanging as the years increased.
- For females (the red line), the marriage rate in \(1980\) was about \(45\), and in \(2010\) it was about \(20\). There were slight blips of increases in that time frame, but the trend during that time period shows that the marriage rate for females decreased as time passed, or years increased.
[/hidden-answer]
Example
Look at the data points scattered all over the graph below. It’s possible that if a statistician analyzed the numbers, there is a slight trend. However, based on our knowledge and the data provided, we cannot tell how median household income is related to overrepresentation.
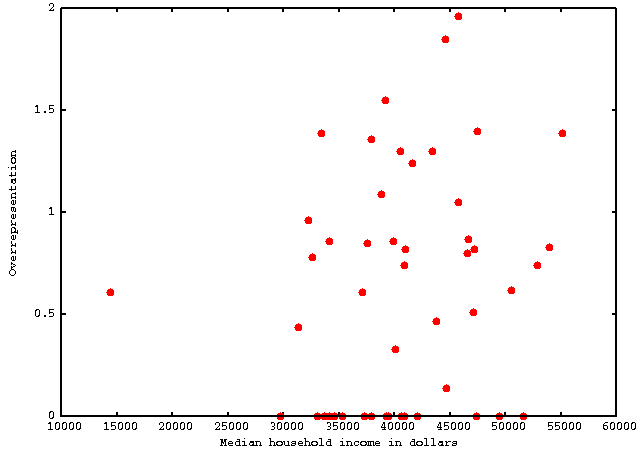
We would say that we cannot determine the trend of this data based on the graph.