
10.18: Material Cost Variance
- Page ID
- 45935
Learning Outcomes
- Analyze the variance between expected material cost and actual material costs
So let’s head back to our Hupana Running Company and review their raw materials by cost and quantity to see where differences might occur, and how we calculate spending variances or quantity variances. Both are important and are used to calculate the overall spending variance.
You might want to revisit these video tutorials before we get started here!

A YouTube element has been excluded from this version of the text. You can view it online here: http://pb.libretexts.org/afm-2/?p=430

A YouTube element has been excluded from this version of the text. You can view it online here: http://pb.libretexts.org/afm-2/?p=430

A YouTube element has been excluded from this version of the text. You can view it online here: http://pb.libretexts.org/afm-2/?p=430
Material variance can vary based on material quantity, material cost or both. Standard cost variance analysis for direct materials can be shown like this:
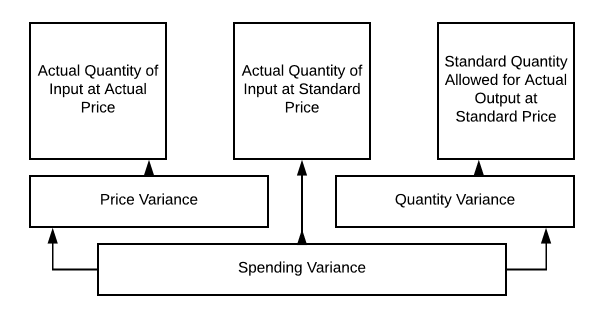
So we will use this chart to look at some different scenarios for Hupana Running Company. Our original direct materials budget calls for 10,250 units of raw materials at $2 per unit to meet our manufacturing requirements. So, we budgeted to spend $21,000 on our raw materials (we wanted a little beginning inventory for the new period!!). What happens if the price, quantity or both change?
When we talk about expected material costs and actual material costs we need to consider a couple of factors. First, there is the quantity of material that goes into each unit. Then there is the cost per unit of material. These two pieces of information are important to consider when analyzing the variance between expected and actual material costs.
Let’s go back to Hupana Running Company. Their direct material cost budget is as follows:
| Total | |
|---|---|
| Required production in pairs | 2050 |
| Units of raw material needed per pair | 5 |
| Units of raw material needed to meet production | 10250 |
| Plus desired ending raw material inventory | 500 |
| Total units of raw materials needed | 10750 |
| Less units in beginning raw material inventory | 250 |
| Units of raw materials to be purchased | 10500 |
| Cost of raw material per unit | $2 |
| Cost of raw material to be purchased | $21,000 |
Keeping the required production in pairs at 2050, What would happen if there was a ton of waste in production and we used 7.5 units of raw material per pair, instead of 5?
| Total | |
|---|---|
| Required production in pairs | 2050 |
| Units of raw material needed per pair | 7.5 |
| Units of raw material needed to meet production | 15375 |
| Plus desired ending raw material inventory | 500 |
| Total units of raw materials needed | 15875 |
| Less units beginning raw material inventory | 250 |
| Units of raw materials to be purchased | 15625 |
| Cost of raw material per unit | $2 |
| Cost of raw material to be purchased | $31,250 |
This results in a change in quantity of product, but the price remains the same. So using our chart from 10.2, we can calculate as follows:
- Actual quantity allowed for actual output at standard price = 10,500 × $2= $21,000
- Actual quantity of input at actual price = 15,625 × $2 = $31,250
So our spending variance is $10,250
We now have spent $31,250 on our raw materials, when we had budgeted $21,000. Waste, scrap, production issues or improper training could all have been at fault for this variance issue. This definitely needs to be reviewed.
So, what would happen if the cost per unit of input went down to $1.25, but our waste remained high?
Now we would still need to purchase 15,625 units, but at a cost of $1.25/unit so $19,531.25 would be our total spent on direct materials. Now the variances become more clear, right?
We purchased more units, but at a lower price. So we had a quantity variance and a price variance. There can be either a price variance or a quantity variance, but there can also be a combination that creates the spending variance.
Taking this information to management might be a bit uncomfortable if the first scenario happens, right? Do your homework before putting together your report. Check with your production manager and see if she can shed some light on the problem. But, in the second scenario, the lower price per unit compensates for the additional units used!
Whichever direction this takes, you may find your production department laying blame on the purchasing team for buying substandard product. The purchasing team might blame production for sloppy work! You may need to do some sleuthing to figure this one out!
Practice Questions
- Material Cost Variance. Authored by: Freedom Learning Group. Provided by: Lumen Learning. License: CC BY: Attribution
- Variance Analysis Part 1 of 3. Authored by: Tony Bell. Located at: https://youtu.be/i2Ho1v0g4h4. License: All Rights Reserved. License Terms: Standard YouTube License
- Variance Analysis: Part 2 of 3. Authored by: Tony Bell. Located at: https://youtu.be/td2TxqzbthA. License: All Rights Reserved. License Terms: Standard YouTube License
- Variance Analysis- Part 3 of 3. Authored by: Tony Bell. Located at: https://youtu.be/7UcxWOt4ArM. License: All Rights Reserved. License Terms: Standard YouTube License