
15.4: Ratio Analysis
- Page ID
- 62242
\( \newcommand{\vecs}[1]{\overset { \scriptstyle \rightharpoonup} {\mathbf{#1}} } \)
\( \newcommand{\vecd}[1]{\overset{-\!-\!\rightharpoonup}{\vphantom{a}\smash {#1}}} \)
\( \newcommand{\id}{\mathrm{id}}\) \( \newcommand{\Span}{\mathrm{span}}\)
( \newcommand{\kernel}{\mathrm{null}\,}\) \( \newcommand{\range}{\mathrm{range}\,}\)
\( \newcommand{\RealPart}{\mathrm{Re}}\) \( \newcommand{\ImaginaryPart}{\mathrm{Im}}\)
\( \newcommand{\Argument}{\mathrm{Arg}}\) \( \newcommand{\norm}[1]{\| #1 \|}\)
\( \newcommand{\inner}[2]{\langle #1, #2 \rangle}\)
\( \newcommand{\Span}{\mathrm{span}}\)
\( \newcommand{\id}{\mathrm{id}}\)
\( \newcommand{\Span}{\mathrm{span}}\)
\( \newcommand{\kernel}{\mathrm{null}\,}\)
\( \newcommand{\range}{\mathrm{range}\,}\)
\( \newcommand{\RealPart}{\mathrm{Re}}\)
\( \newcommand{\ImaginaryPart}{\mathrm{Im}}\)
\( \newcommand{\Argument}{\mathrm{Arg}}\)
\( \newcommand{\norm}[1]{\| #1 \|}\)
\( \newcommand{\inner}[2]{\langle #1, #2 \rangle}\)
\( \newcommand{\Span}{\mathrm{span}}\) \( \newcommand{\AA}{\unicode[.8,0]{x212B}}\)
\( \newcommand{\vectorA}[1]{\vec{#1}} % arrow\)
\( \newcommand{\vectorAt}[1]{\vec{\text{#1}}} % arrow\)
\( \newcommand{\vectorB}[1]{\overset { \scriptstyle \rightharpoonup} {\mathbf{#1}} } \)
\( \newcommand{\vectorC}[1]{\textbf{#1}} \)
\( \newcommand{\vectorD}[1]{\overrightarrow{#1}} \)
\( \newcommand{\vectorDt}[1]{\overrightarrow{\text{#1}}} \)
\( \newcommand{\vectE}[1]{\overset{-\!-\!\rightharpoonup}{\vphantom{a}\smash{\mathbf {#1}}}} \)
\( \newcommand{\vecs}[1]{\overset { \scriptstyle \rightharpoonup} {\mathbf{#1}} } \)
\( \newcommand{\vecd}[1]{\overset{-\!-\!\rightharpoonup}{\vphantom{a}\smash {#1}}} \)
Ratio Analysis
Horizontal and vertical analyses present data about each line item on the financial statements in a uniform way across the board. Additional insight about a corporation’s financial performance and health can be revealed by calculating targeted ratios that use specific amounts that relate to one another. Again, as stated earlier, no ratio is meaningful by itself; it needs to be compared to something, such as desired or expected results, previous results, other companies’ results, or industry standards.
There are a series of ratios that are commonly used by corporations. These will be classified as liquidity, solvency, profitability, and return on investment.
Liquidity analysis looks at a company’s available cash and its ability to quickly convert other current assets into cash to meet short-term operating needs such as paying expenses and debts as they become due. Cash is the most liquid asset; other current assets such as accounts receivable and inventory may also generate cash in the near future.
Creditors and investors often use liquidity ratios to gauge how well a business is performing. Since creditors are primarily concerned with a company’s ability to repay its debts, they want to see if there is enough cash and equivalents available to meet the current portions of debt.
Six liquidity ratios follow. The current and quick ratios evaluate a company’s ability to pay its current liabilities. Accounts receivable turnover and number of days’ sales in receivables look at the firm’s ability to collect its accounts receivable. Inventory turnover and number of days’ sales in inventory gauge how effectively a company manages its inventory.
CURRENT RATIO
What it measures: The ability of a firm to pay its current liabilities with its cash and/or other current assets that can be converted to cash within a relatively short period of time.
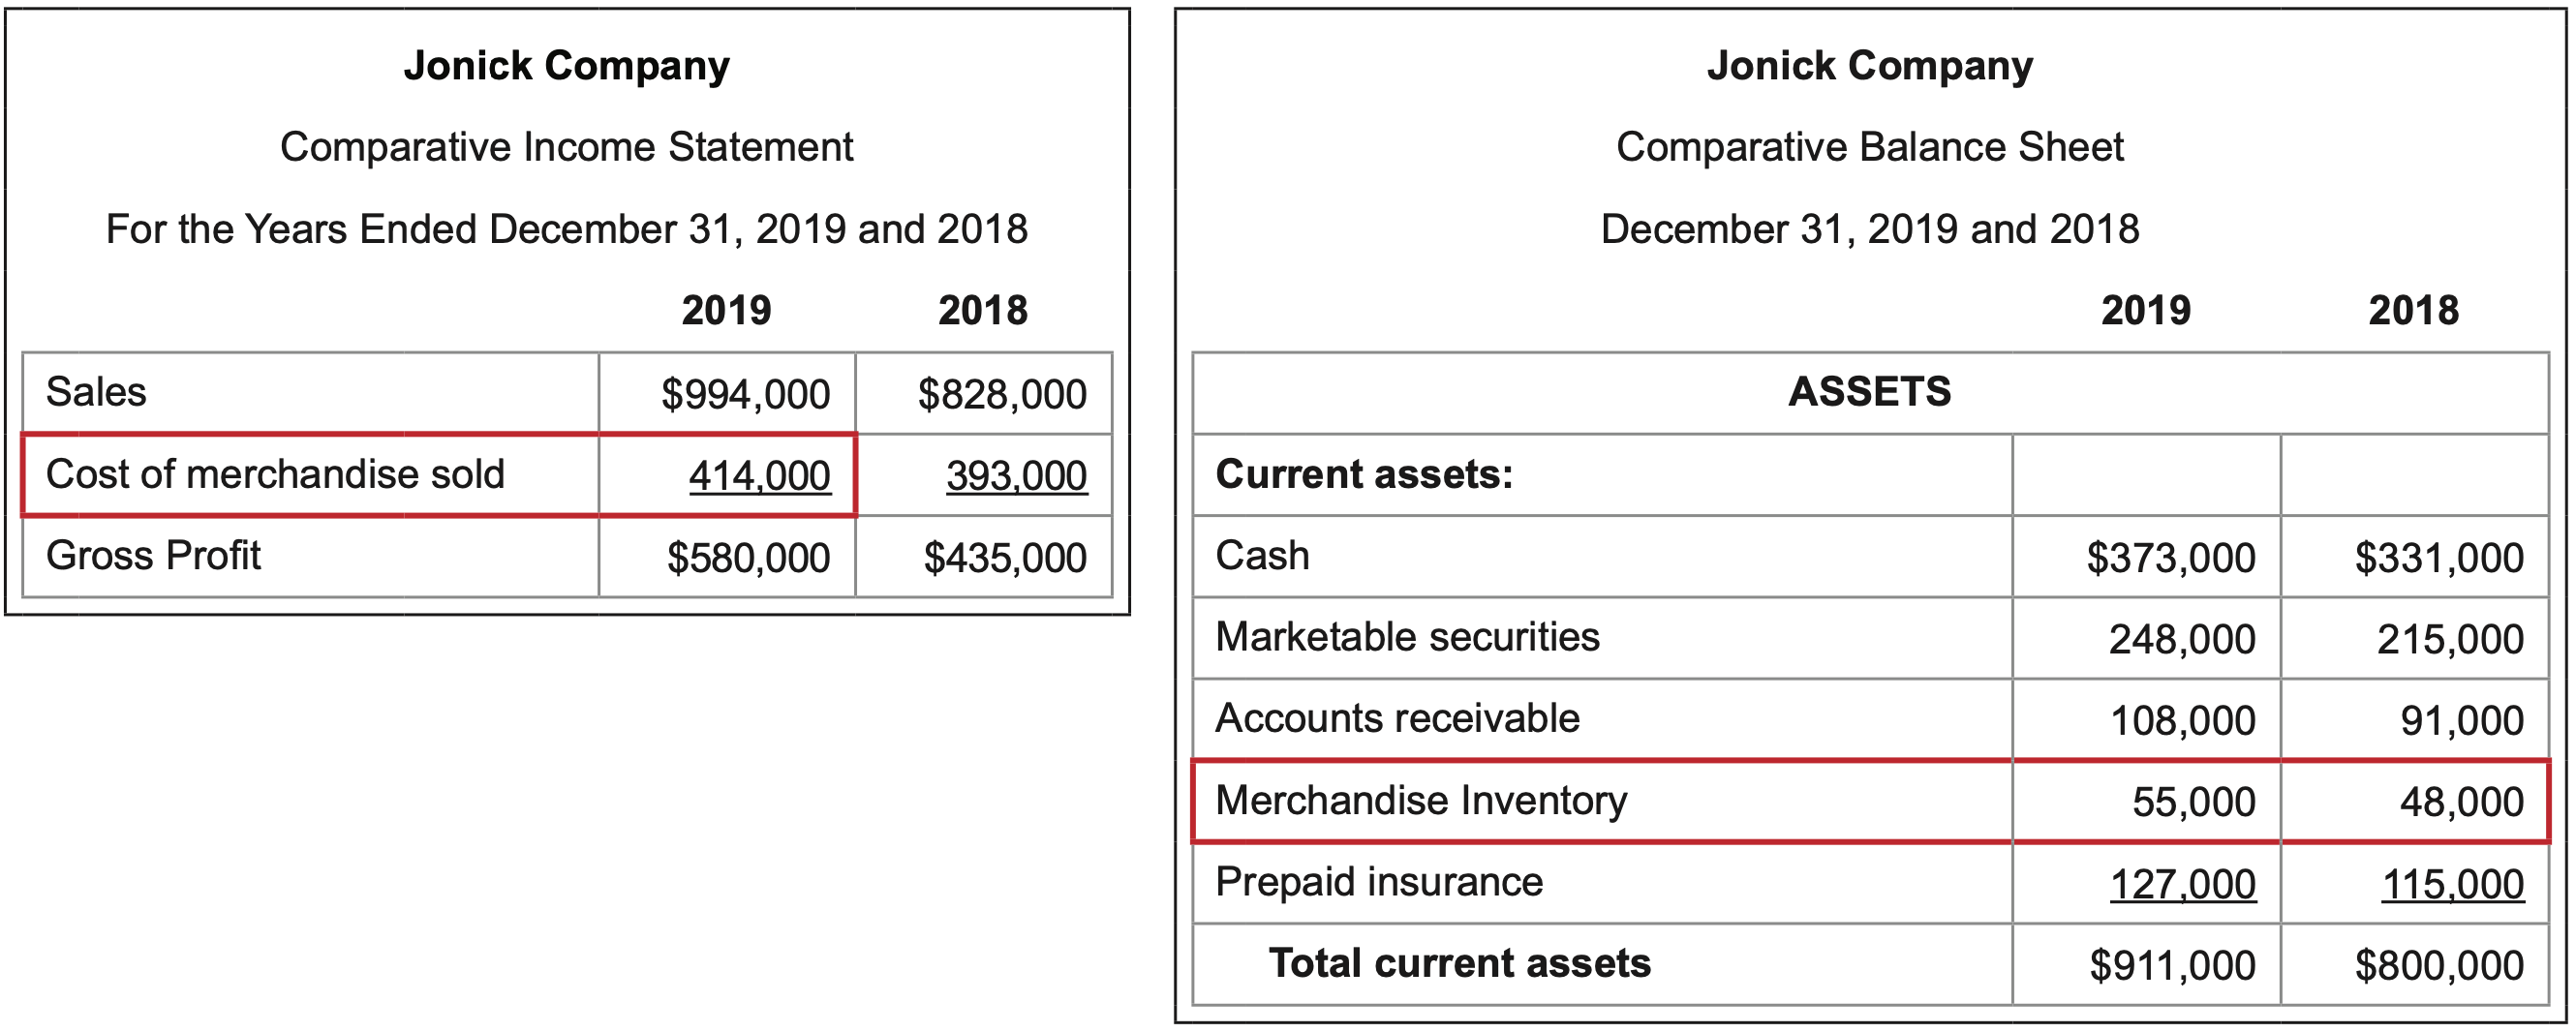
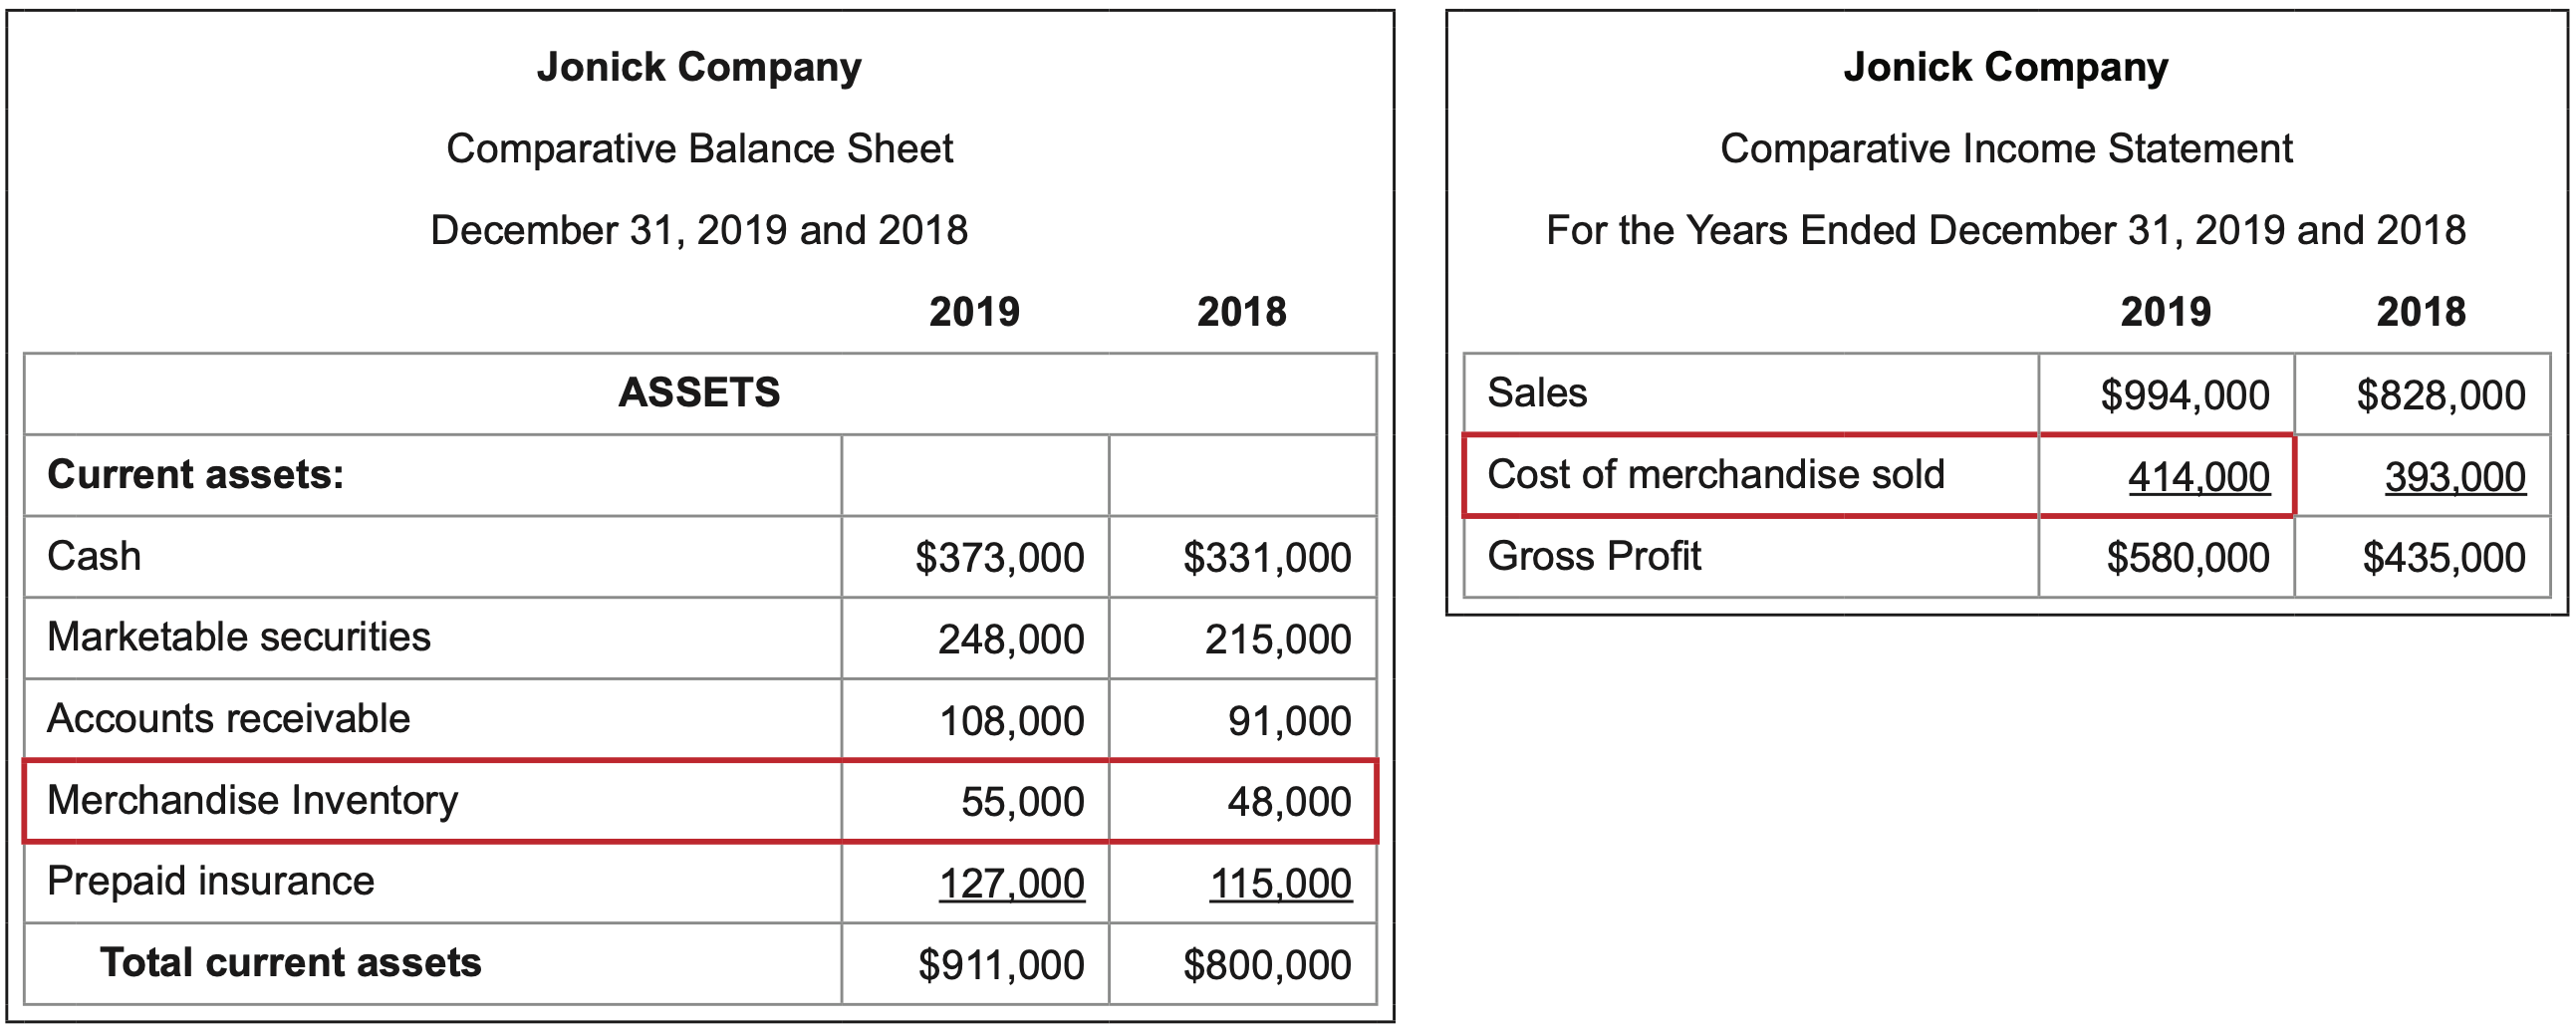
\(\ \text{Calculation:} \frac{\text { Current assets }}{\text { Current liabilities }}=\frac{911,000}{364,000}=2.5\)
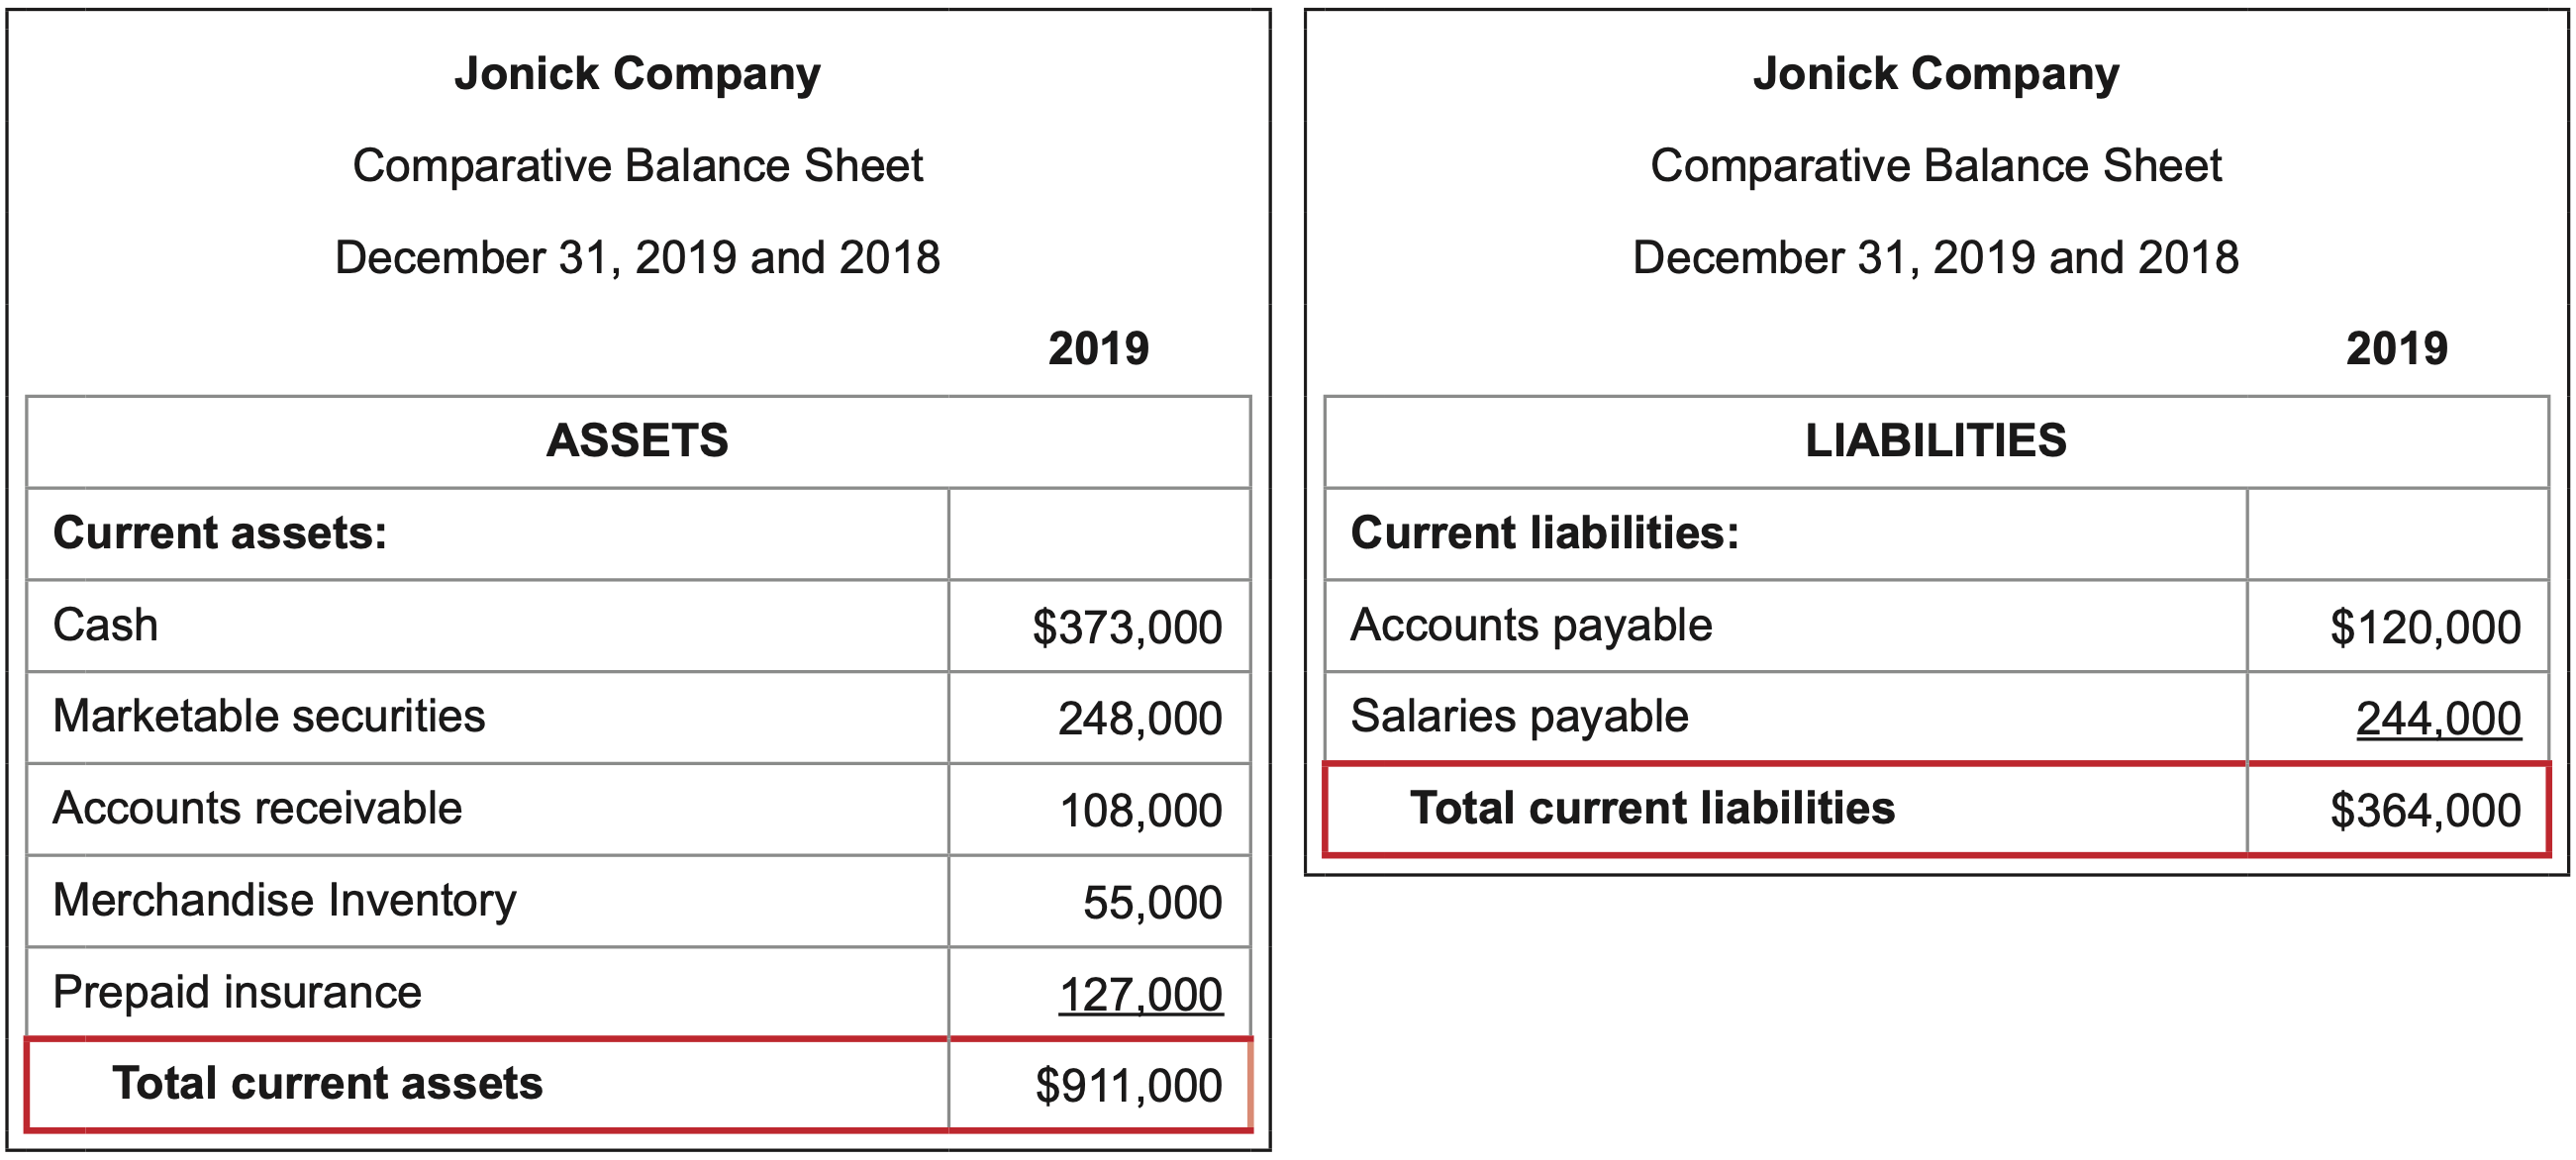
Interpretation: This company has 2.5 times more in current assets than it has in current liabilities. The premise is that current assets are liquid; that is, they can be converted to cash in a relatively short period of time to cover short-term debt. A current ratio is judged as satisfactory on a relative basis. If the company prefers to have a lot of debt and not use its own money, it may consider 2.5 to be too high – too little debt for the amount of assets it has. If a company is conservative in terms of debt and wants to have as little as possible, 2.5 may be considered low – too little asset value for the amount of liabilities it has. For an average tolerance for debt, a current ratio of 2.5 may be considered satisfactory. The point is that whether the current ratio is considered acceptable is subjective and will vary from company to company.
QUICK RATIO
What it measures: the ability of a firm to pay its current liabilities with its cash and other current assets that can be converted to cash within an extremely short period of time. Quick assets include cash, accounts receivable, and marketable securities but do not include inventory or prepaid items.
\(\ \text{Calculation:} \frac{\text { Quick assets }}{\text { Current liabilities }}=\frac{373,000+248,000+108,000}{364,000}=2.0\)
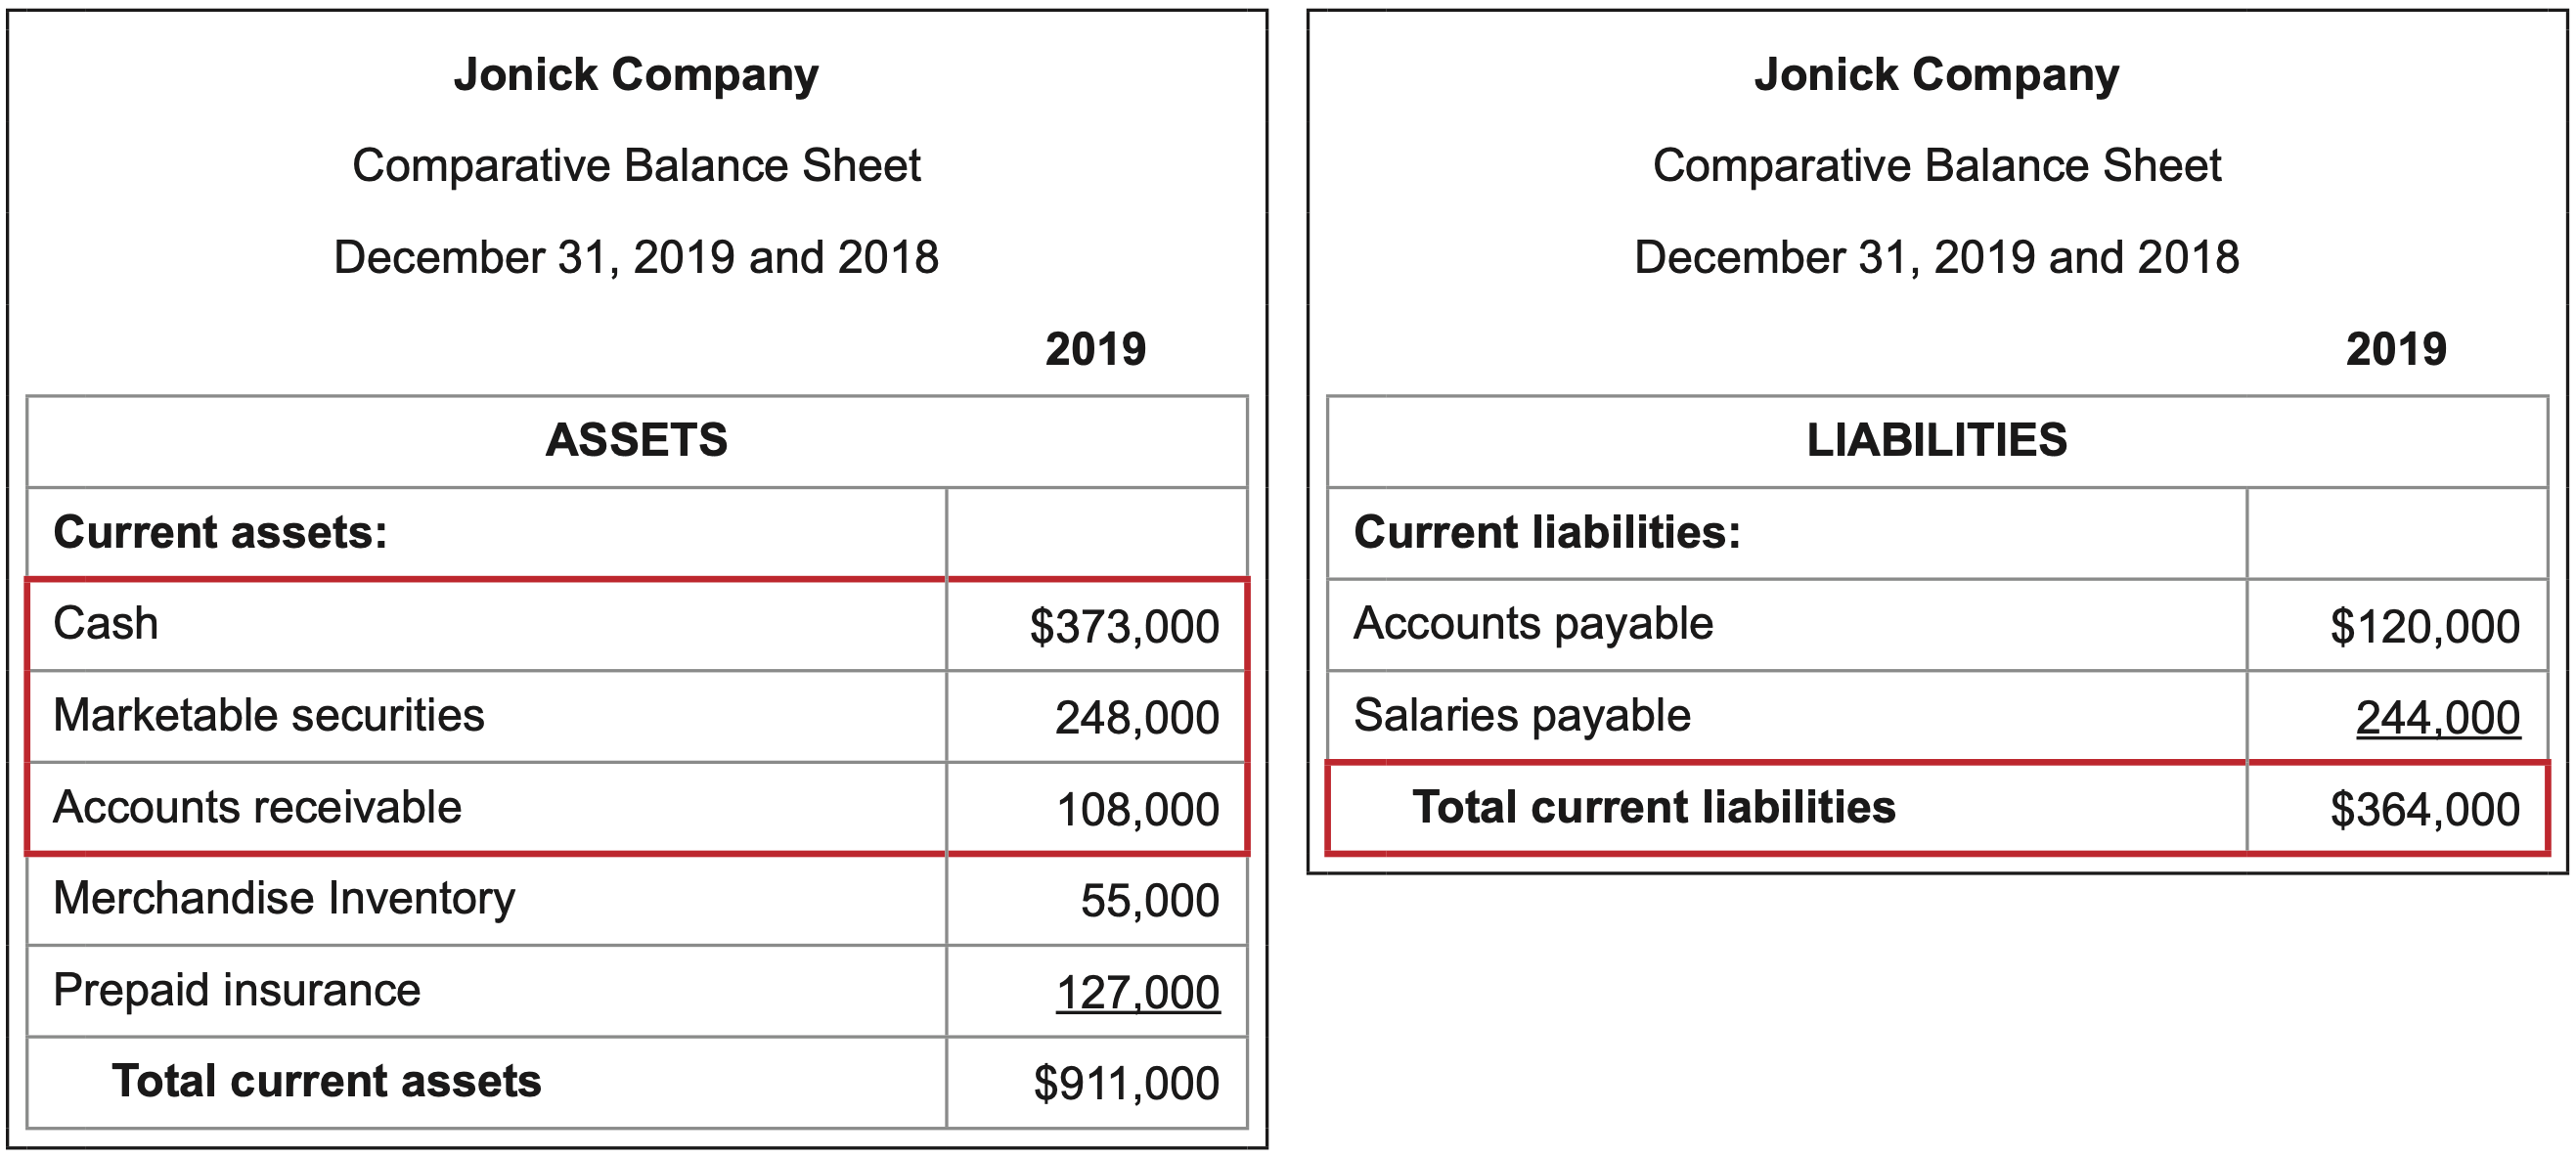
Interpretation: This company has 2.0 times more in its highly liquid current assets, which include cash, marketable securities, and accounts receivable, than it has in current liabilities. The premise is these current assets are the most liquid and can be immediately converted to cash to cover short-term debt. Current assets such as inventory and prepaid items would take too long to sell to be considered quick assets. A quick ratio is judged as satisfactory on a relative basis. If the company prefers to have a lot of debt and not use its own money, it may consider 2.0 to be too high – too little debt for the amount of assets it has. If a company is conservative in terms of debt and wants to have as little as possible, 2.0 may be considered low – too little asset value for the amount of liabilities it has. For an average tolerance for debt, a current ratio of 2.0 may be considered satisfactory. The point is that whether the quick ratio is considered acceptable is subjective and will vary from company to company.
ACCOUNTS RECEIVABLE TURNOVER
What it measures: the number of times the entire amount of a firm’s accounts receivable, which is the monies owed to the company by its customers, is collected in a year.
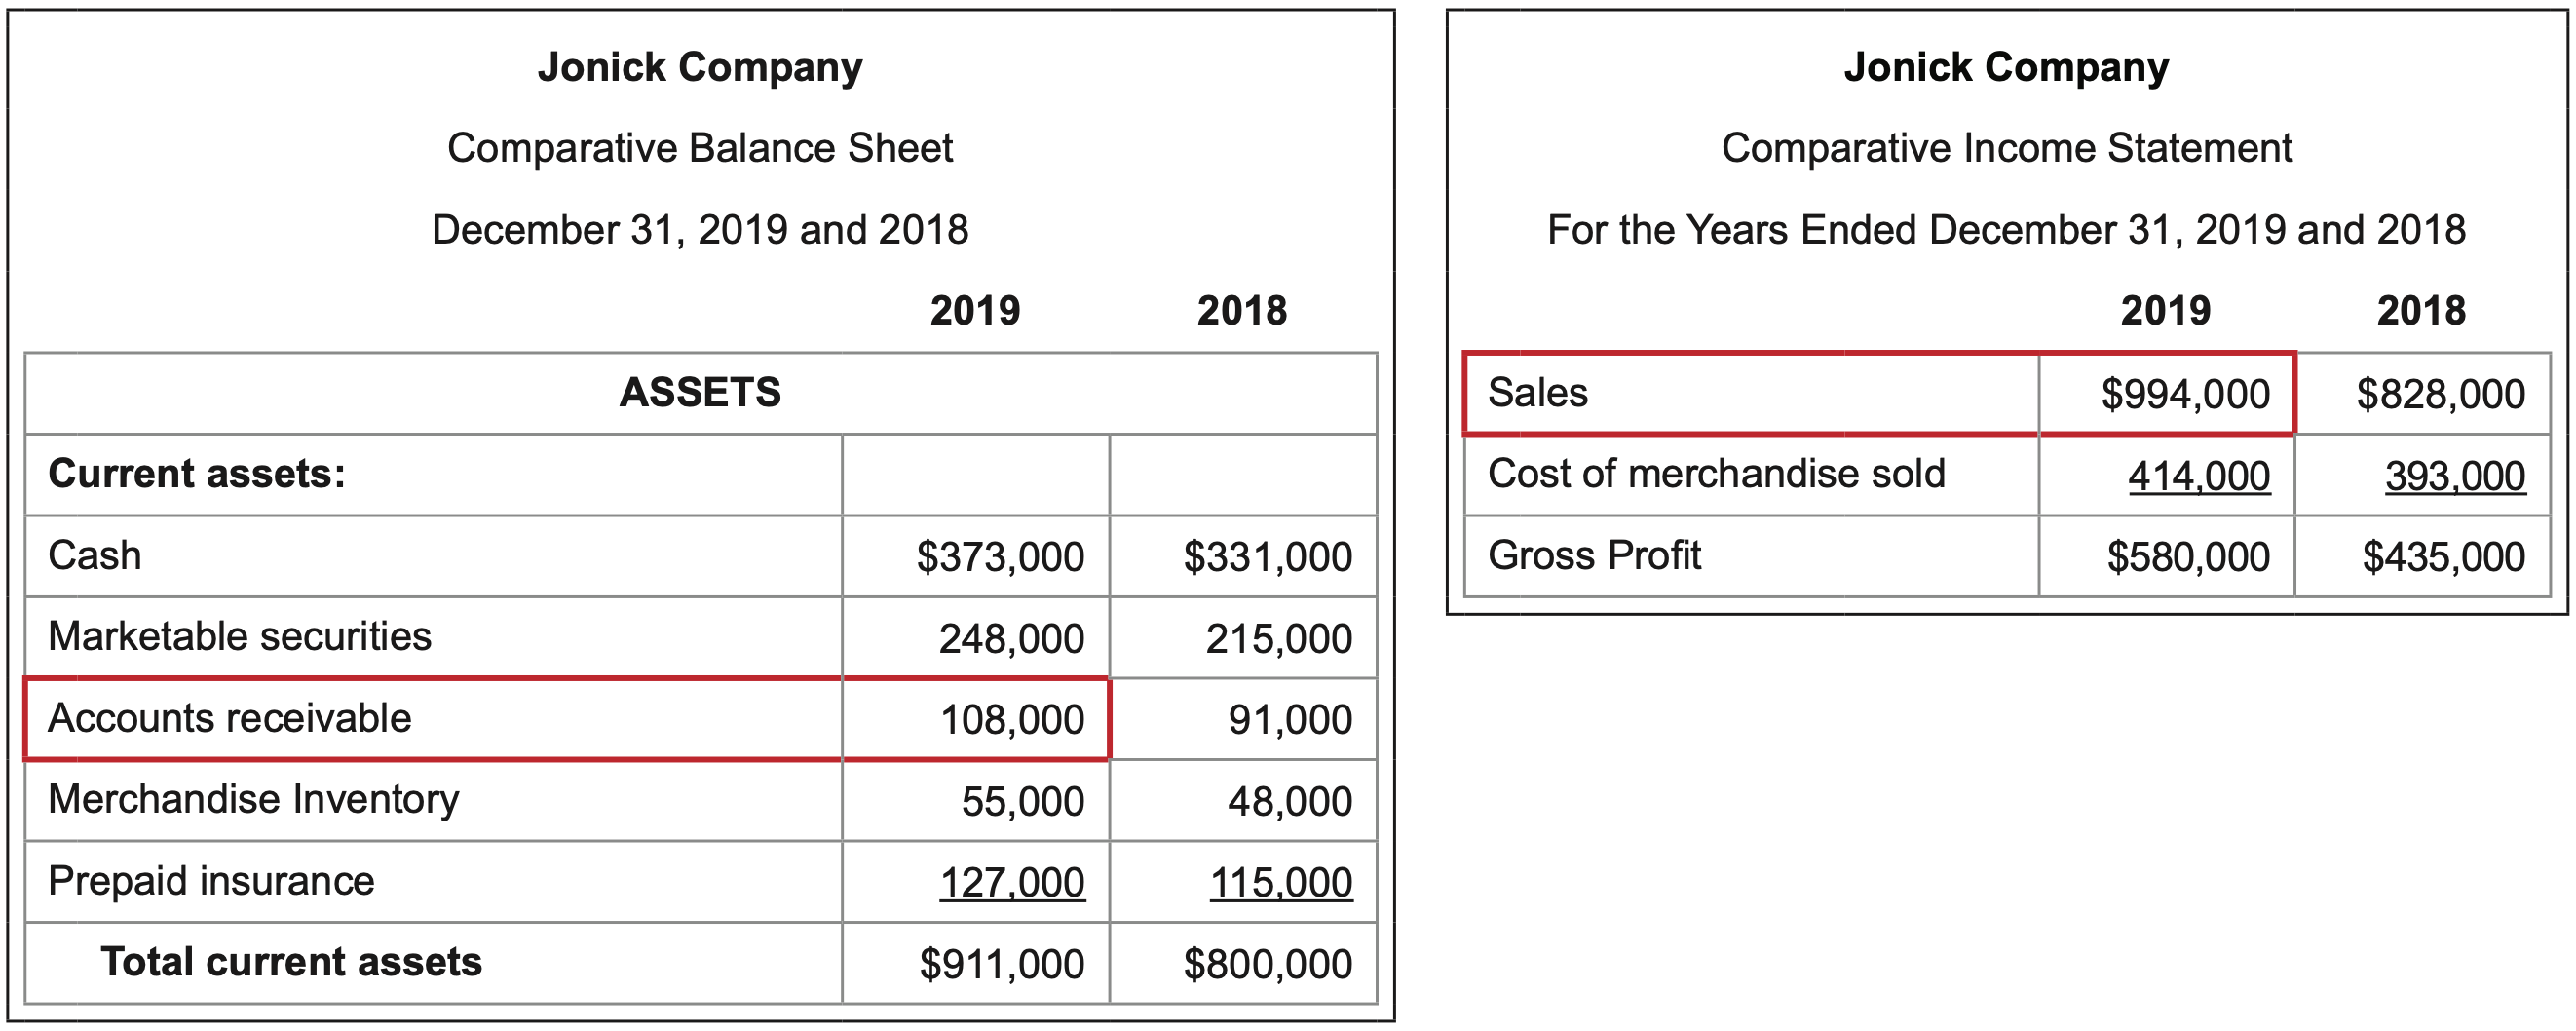
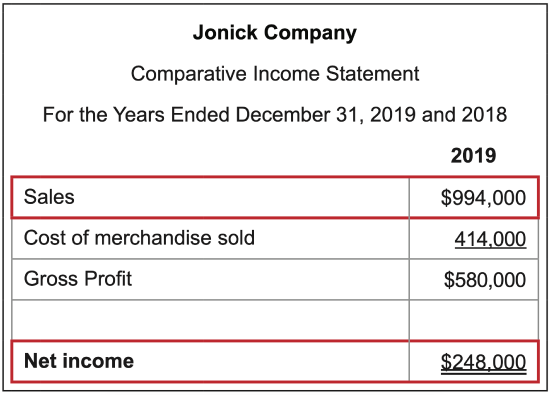
\(\ \text{Calculation:} \frac{\text { Sales }}{\text { Average accounts receivable }}=\frac{994,000}{(108,000 + 91,000)/2}=10.0\)
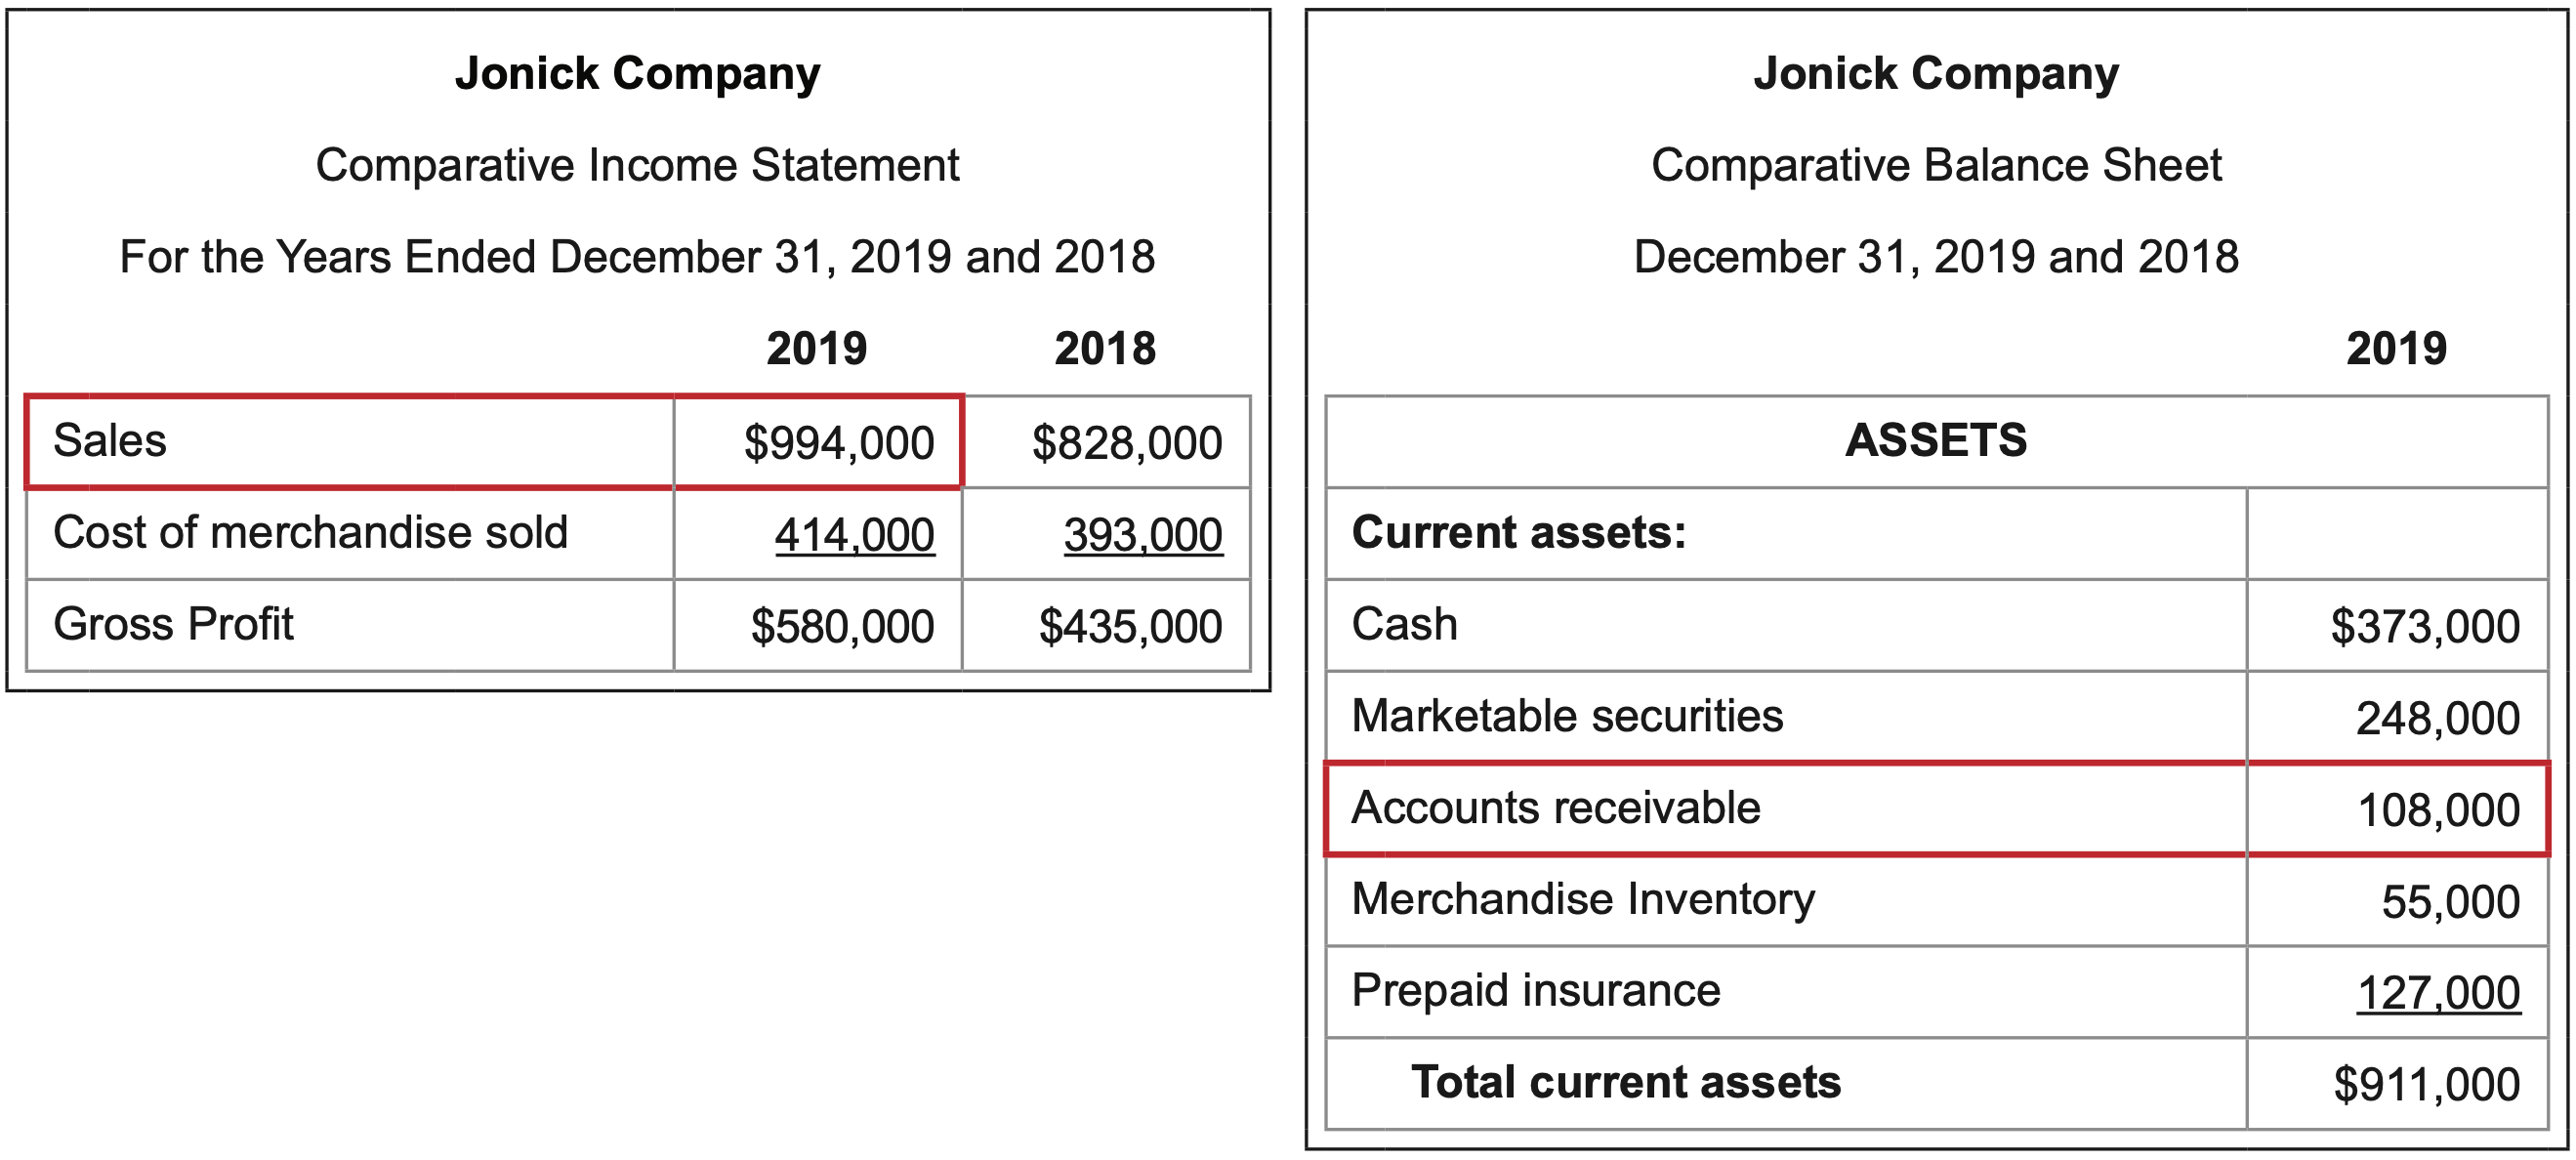
Interpretation: The higher the better.
The more often customers pay off their invoices, the more cash available to the firm to pay bills and debts and less possibility that customers will never pay at all.
NUMBER OF DAYS’ SALES IN RECEIVABLES
What it measures: the number of days it typically takes for customers to pay on account.
\(\ \text{Calculation:} \frac{\text { Average accounts receivable }}{\text { Sales / } 365}=\frac{(108,000+91,000) / 2}{994,000 / 365}=36.5 days\)
The denominator of “Sales / 365” represents the dollar amount of sales per day in a 365-day year.
Interpretation: The lower the better.
The less time it takes customers to pay off their invoices, the more cash available to the firm to pay bills and debts and less possibility that customers will never pay at all.
INVENTORY TURNOVER
What it measures: the number of times the average amount of a firm’s inventory is sold in a year.
\(\ \text{Calculation:} \frac{\text { Cost of merchandise sold }}{\text { Average inventory }}=\frac{414,000}{(55,000 + 48,000)/2}=8.0\)
Interpretation: The higher the better.
The more often inventory is sold, the more cash generated by the firm to pay bills and debts. Inventory turnover is also a measure of a firm’s operational performance. If the company’s line of business is to sell merchandise, the more often it does so, the more operationally successful it is.
NUMBER OF DAYS’ SALES IN INVENTORY
What it measures: the number of days it typically takes for a typical batch of inventory to be sold.
\(\ \text{Calculation}: \frac{\text {Average inventory }}{\text { Cost of merchandise sold/365 }}=\frac{(55,000 + 48,000)/2}{(414,000/365)}=45.4 \text{ days}\)
The denominator of “Cost of merchandise sold / 365” represents the dollar amount of cost per day in a 365-day year.
Interpretation: The lower the better.
The less time it takes for the inventory in stock to be sold, the more cash available to the firm to pay bills and debts. There is also less of a need to pay storage, insurance, and other holding costs and less of a chance that inventory on hand will become outdated and less attractive to customers.
Solvency analysis evaluates a company’s future financial stability by looking at its ability to pay its long-term debts.
Both investors and creditors are interested in the solvency of a company. Investors want to make sure the company is in a strong financial position and can continue to grow, generate profits, distribute dividends, and provide a return on investment. Creditors are concerned with being repaid and look to see that a company can generate sufficient revenues to cover both short and long-term obligations.
Four solvency ratios follow.
RATIO OF LIABILITIES TO STOCKHOLDERS’ EQUITY
What it measures: the ability of a company to pay its creditors.
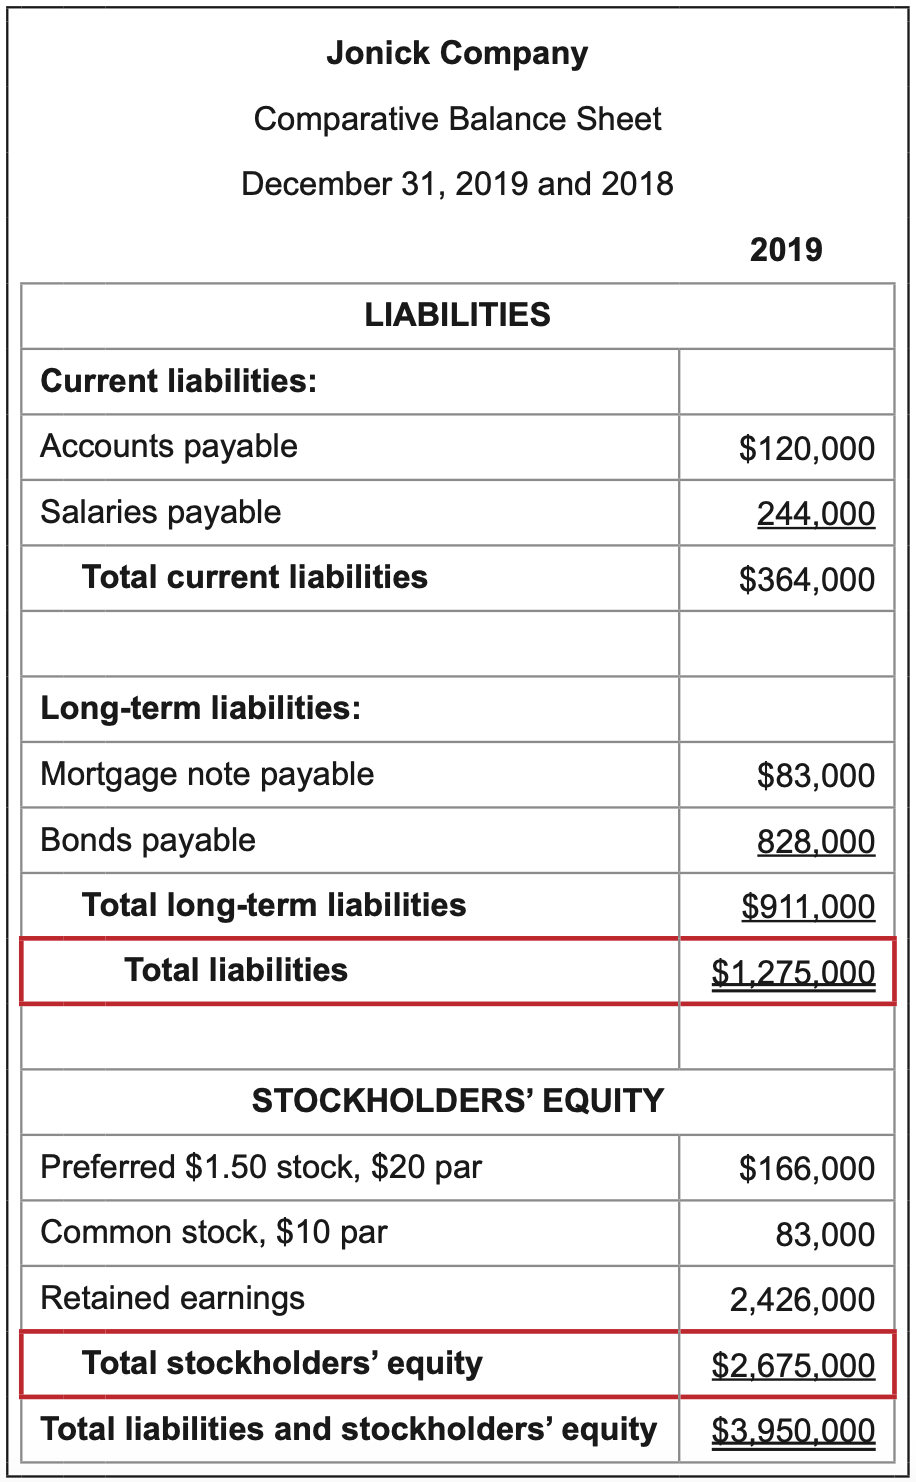
\(\ \text{Calculation}: \frac{\text {Total liabilities }}{\text { Total stockholders’ equity }}=\frac{1,275,000}{2,675,000}=5\)
Interpretation: Favorable vs. unfavorable results are based on company’s level of tolerance for debt
Assets are acquired either by investments from stockholders or through borrowing from other parties. Companies that are adverse to debt would prefer a lower ratio. Companies that prefer to use “other people’s money” to finance assets would favor a higher ratio. In this example, the company’s debt is about half of what its stockholders’ equity is. Approximately 1/3 of the assets are paid for through borrowing.
RATIO OF FIXED ASSETS TO LONG-TERM LIABILITIES
What it measures: the availability of investments in property, plant, and equipment that are financed by long-term debt and to generate earnings that may be used to pay off long-term debt.
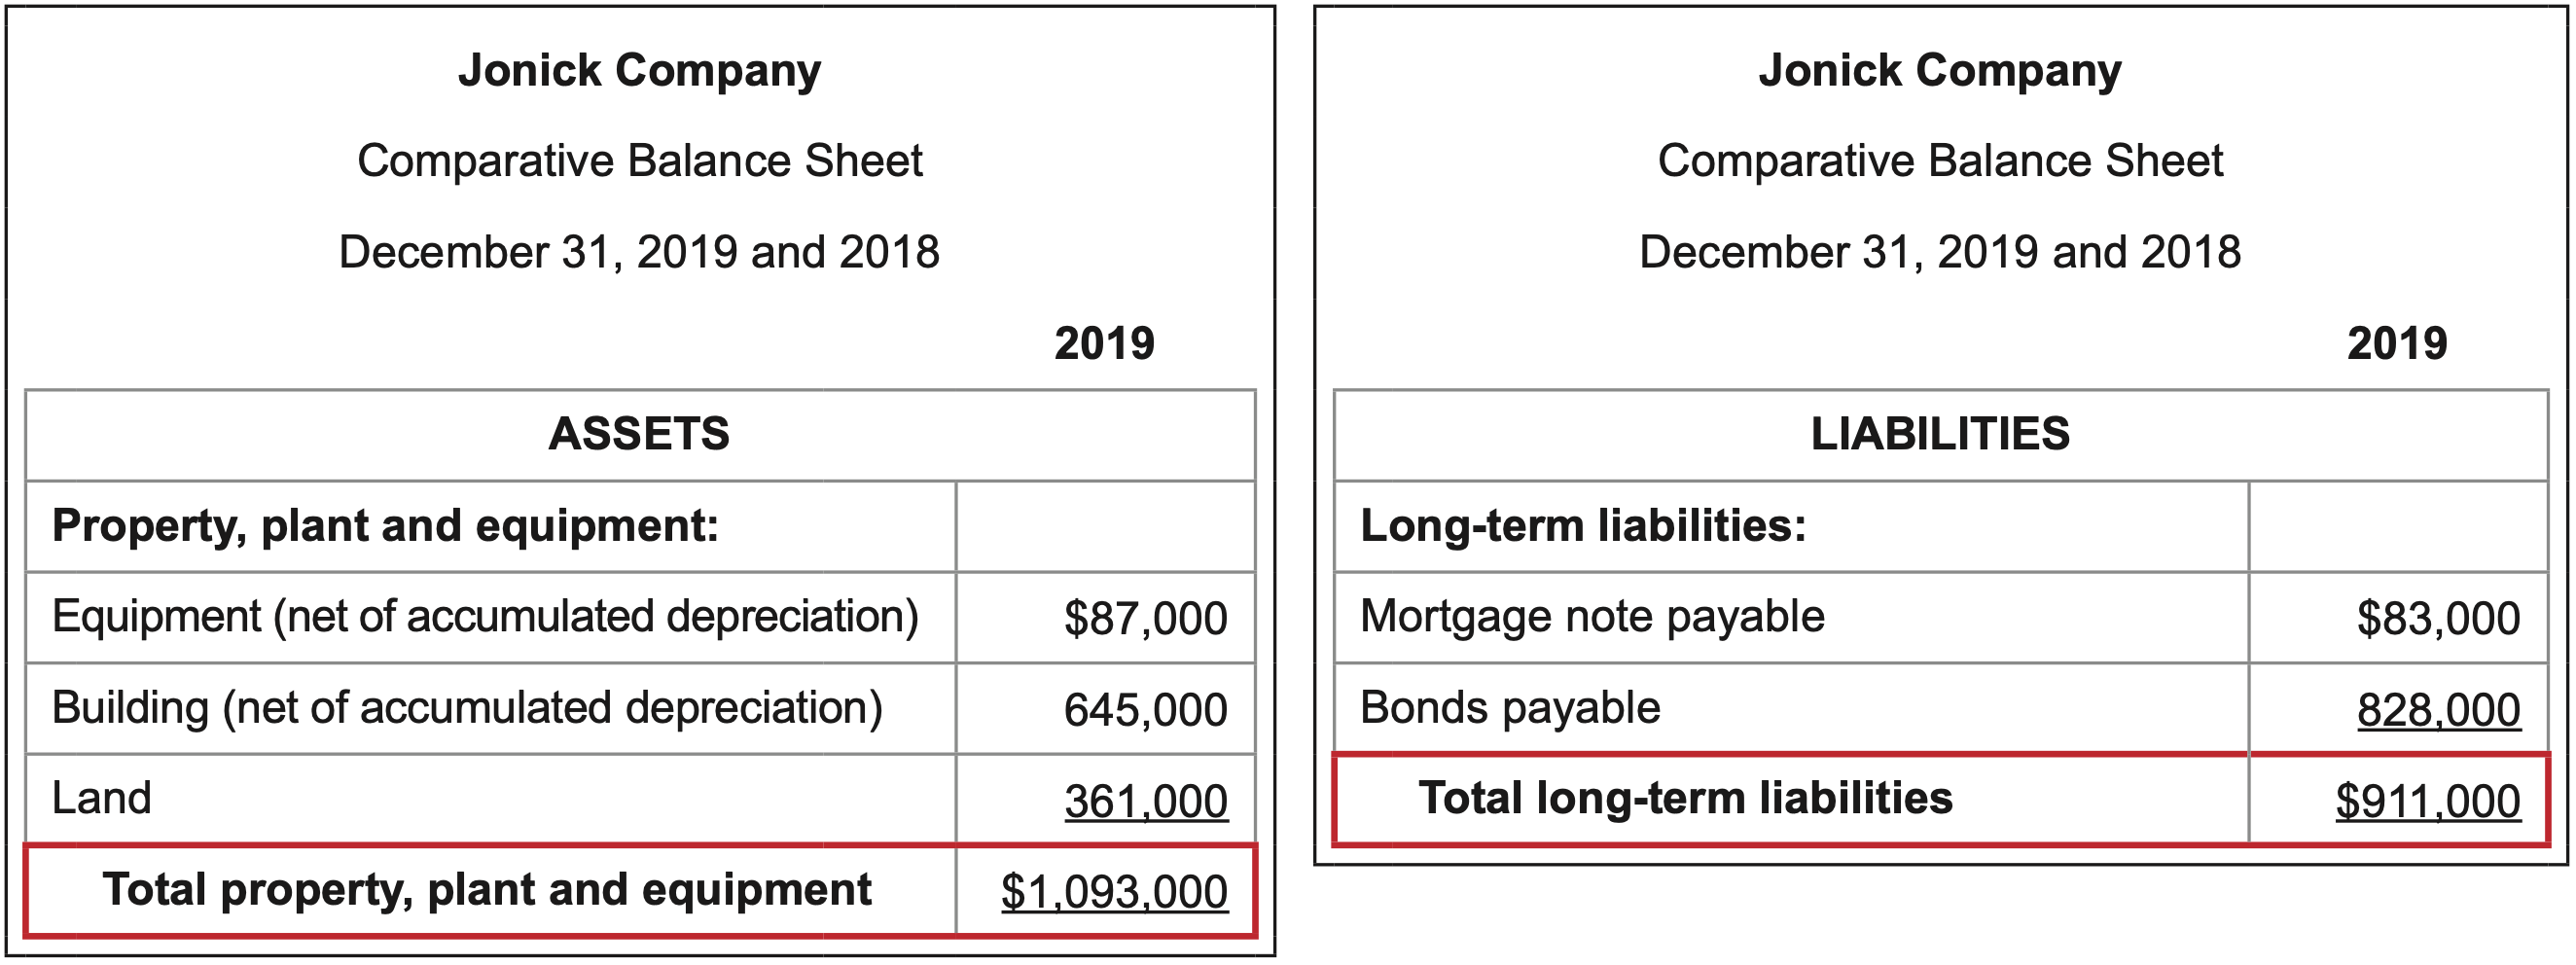
\(\ \text{Calculation}: \frac{\text {Book value of fixed assets }}{\text { Long-term liabilities }}=\frac{1,093,000}{911,000}=1.2\)
The denominator of “Cost of merchandise sold / 365” represents the dollar amount of cost per day in a 365-day year.
Interpretation: The higher the better.
The more that has been invested in fixed assets, which are often financed by long- term debt, the more potential there is for a firm to perform well operationally and generate the cash it needs to make debt payments.
NUMBER OF TIMES INTEREST CHARGES ARE EARNED
What it measures: the ability to generate sufficient pre-tax income to pay interest charges on debt.
\(\ \text{Calculation}: \frac{\text {Income before income tax + interest expense }}{\text { Interest expense }}=\frac{314,000 + 55,000}{55,000}=6.7\)
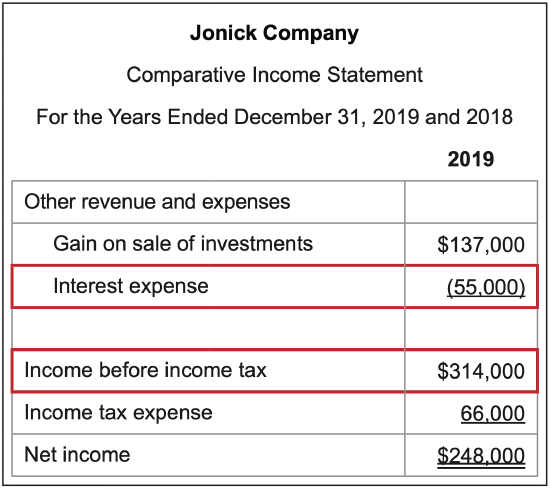
Since interest expense had been deducted in arriving at income before income tax on the income statement, it is added back in the calculation of the ratio.
Interpretation: The higher the better.
The ratio looks at income that is available to pay interest expense after all other expenses have been covered by the sales that were generated. The number of times anything is earned is always more favorable when it is higher since it impacts the margin of safety and the ability to pay as earnings fluctuate, particulary if they decline.
NUMBER OF TIMES PREFERRED DIVIDENDS ARE EARNED
What it measures: the ability to generate sufficient net income to pay dividends to preferred stockholders
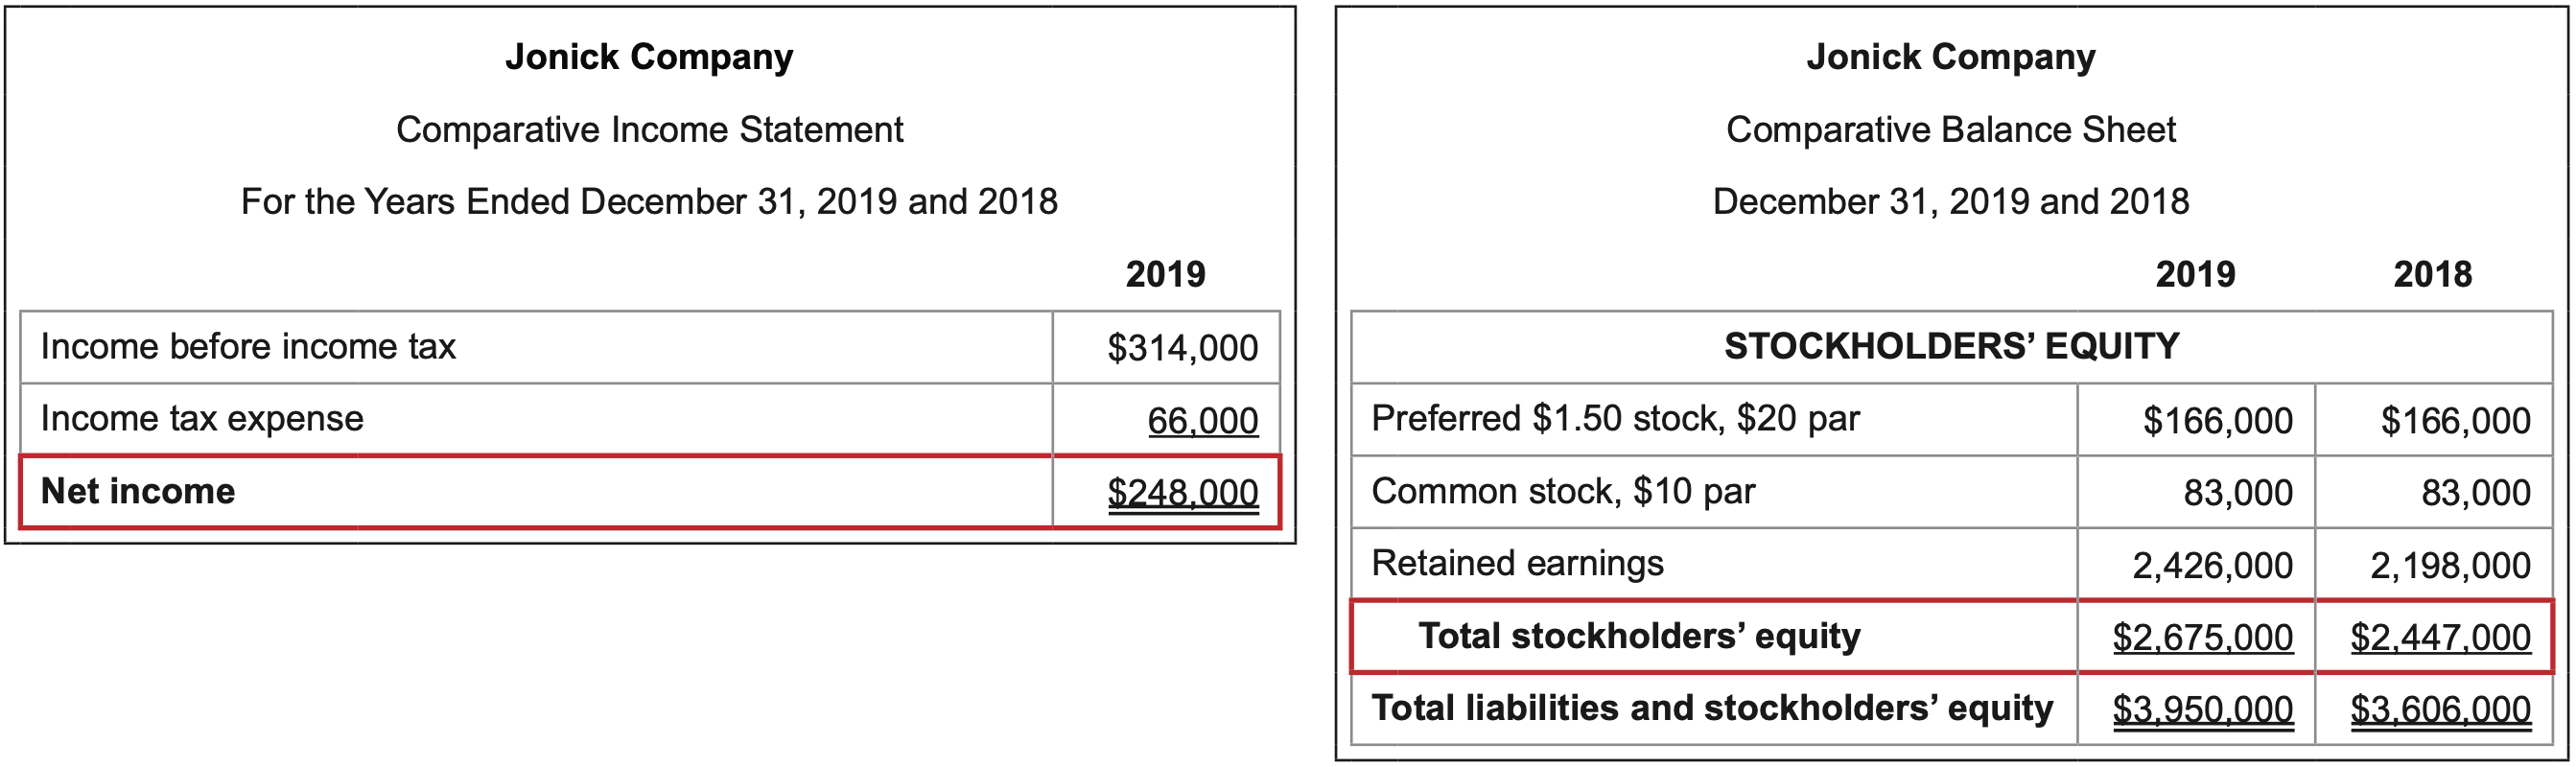
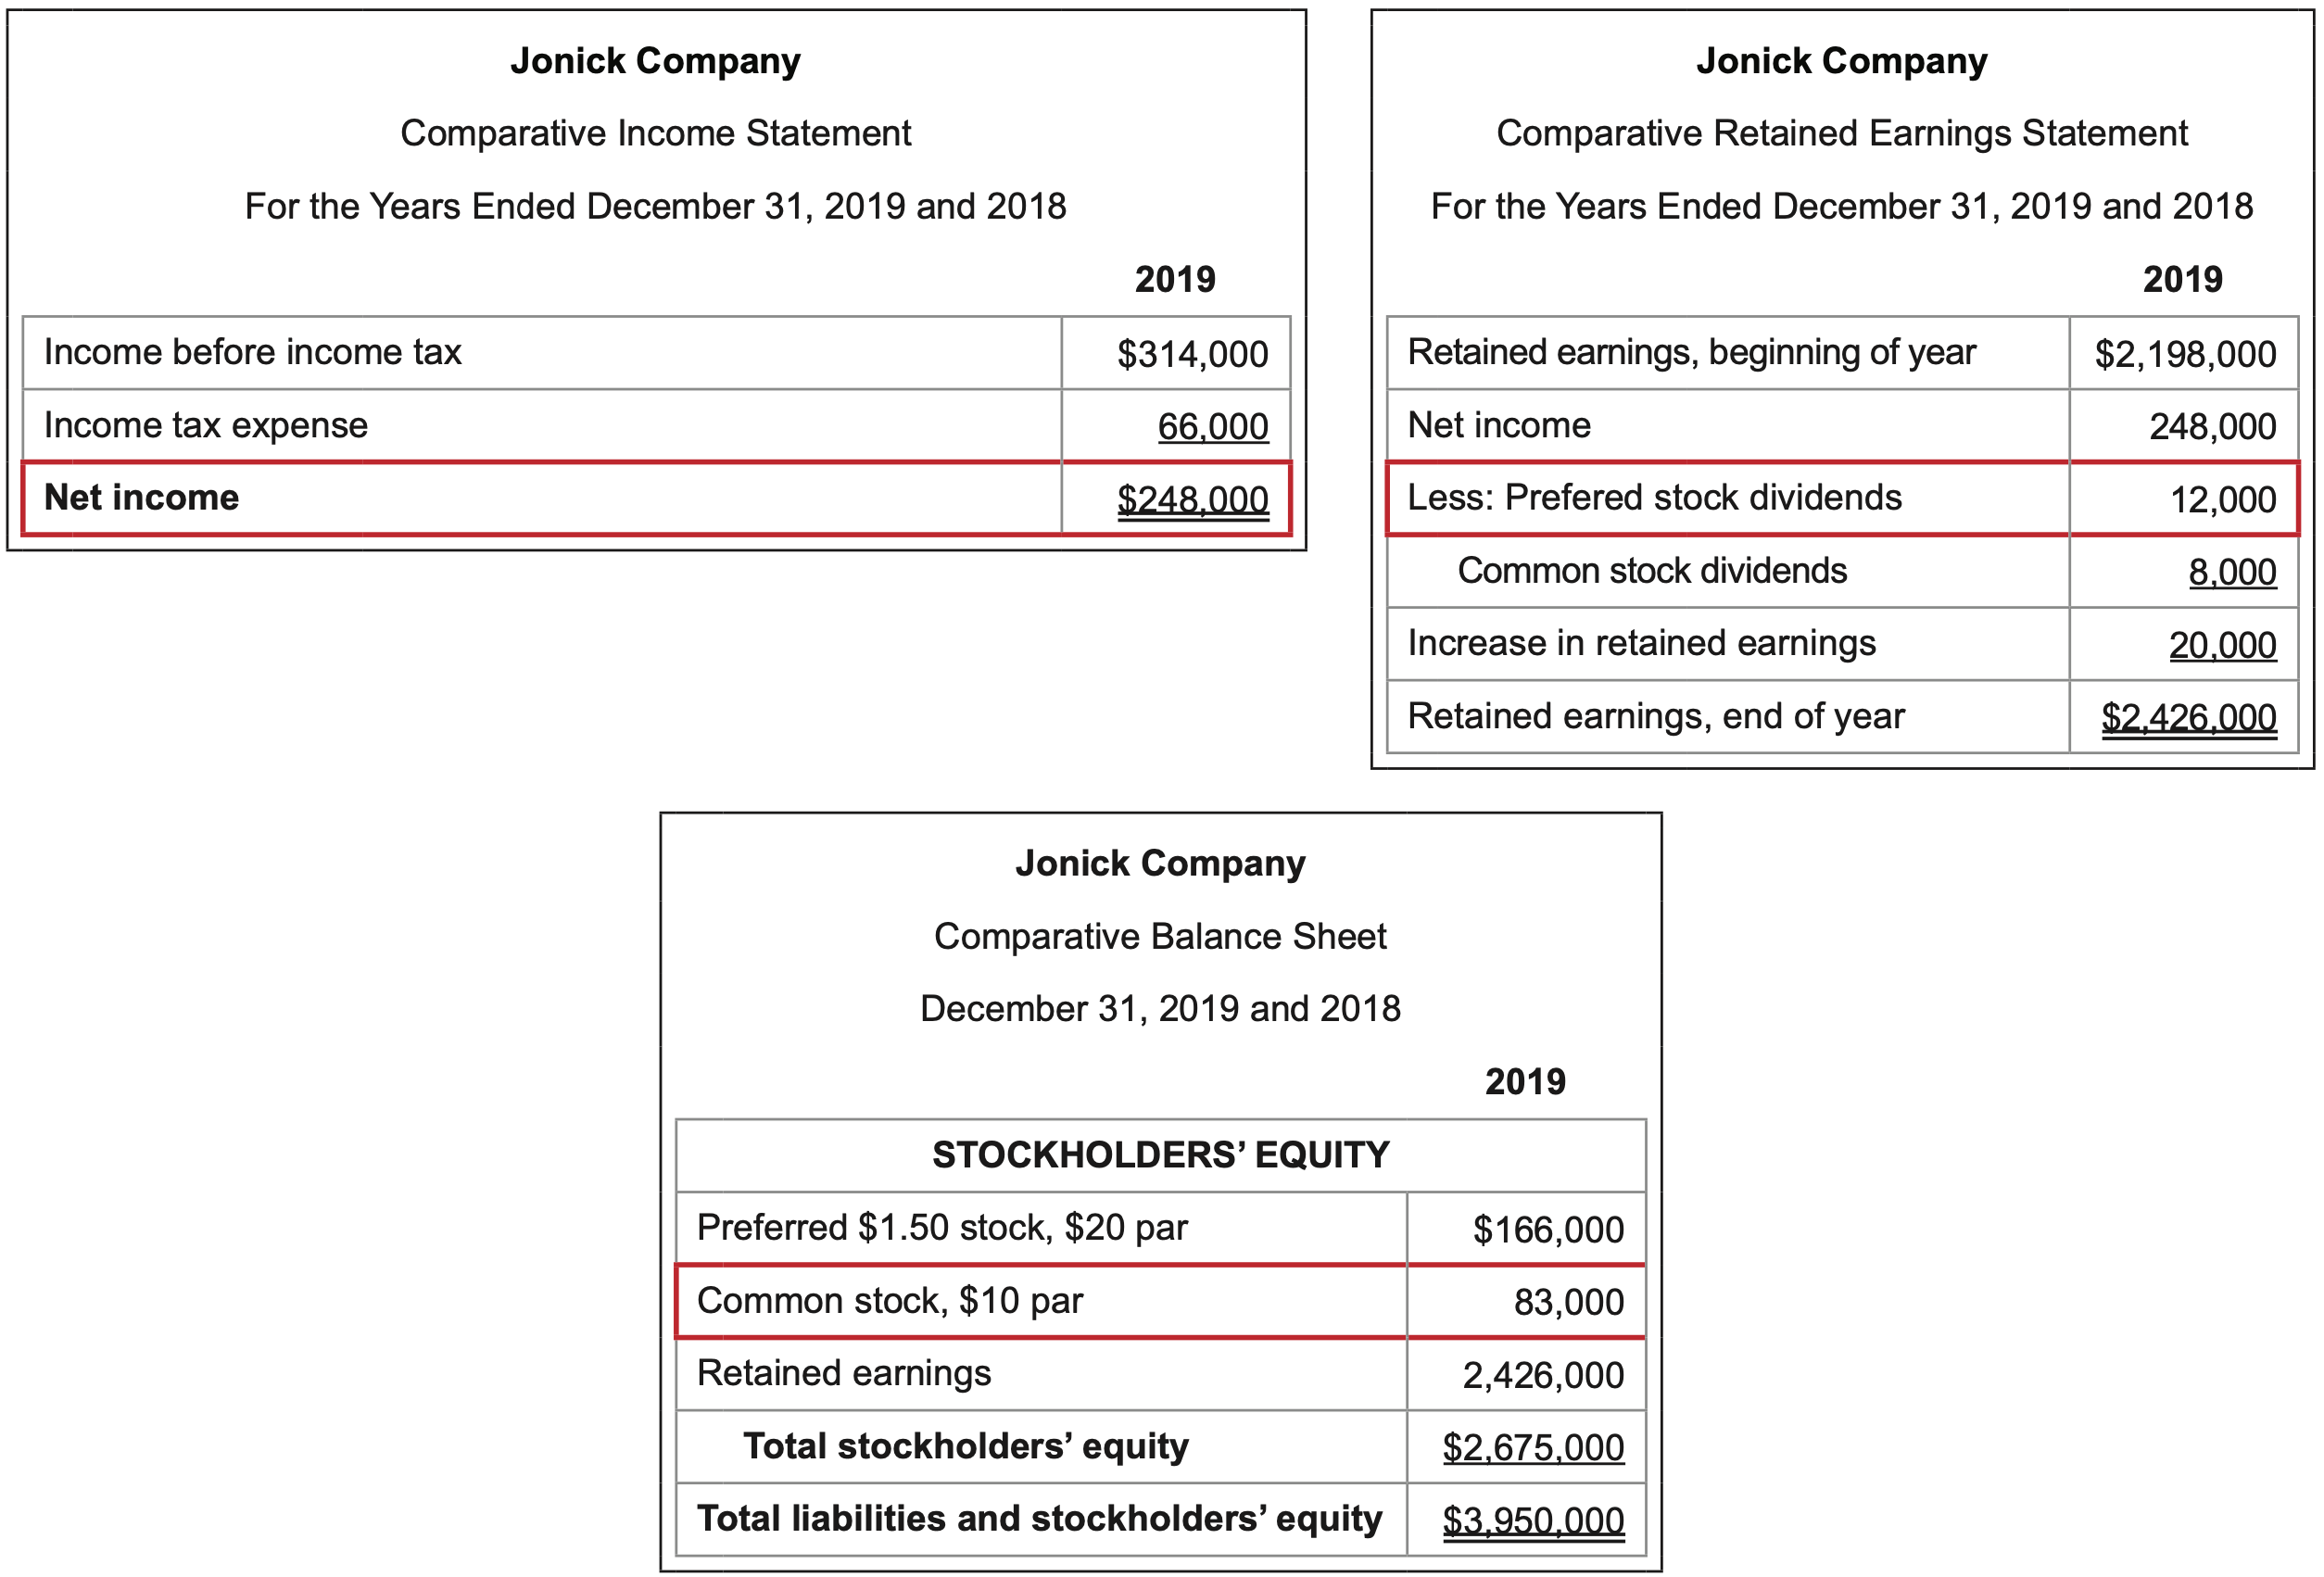
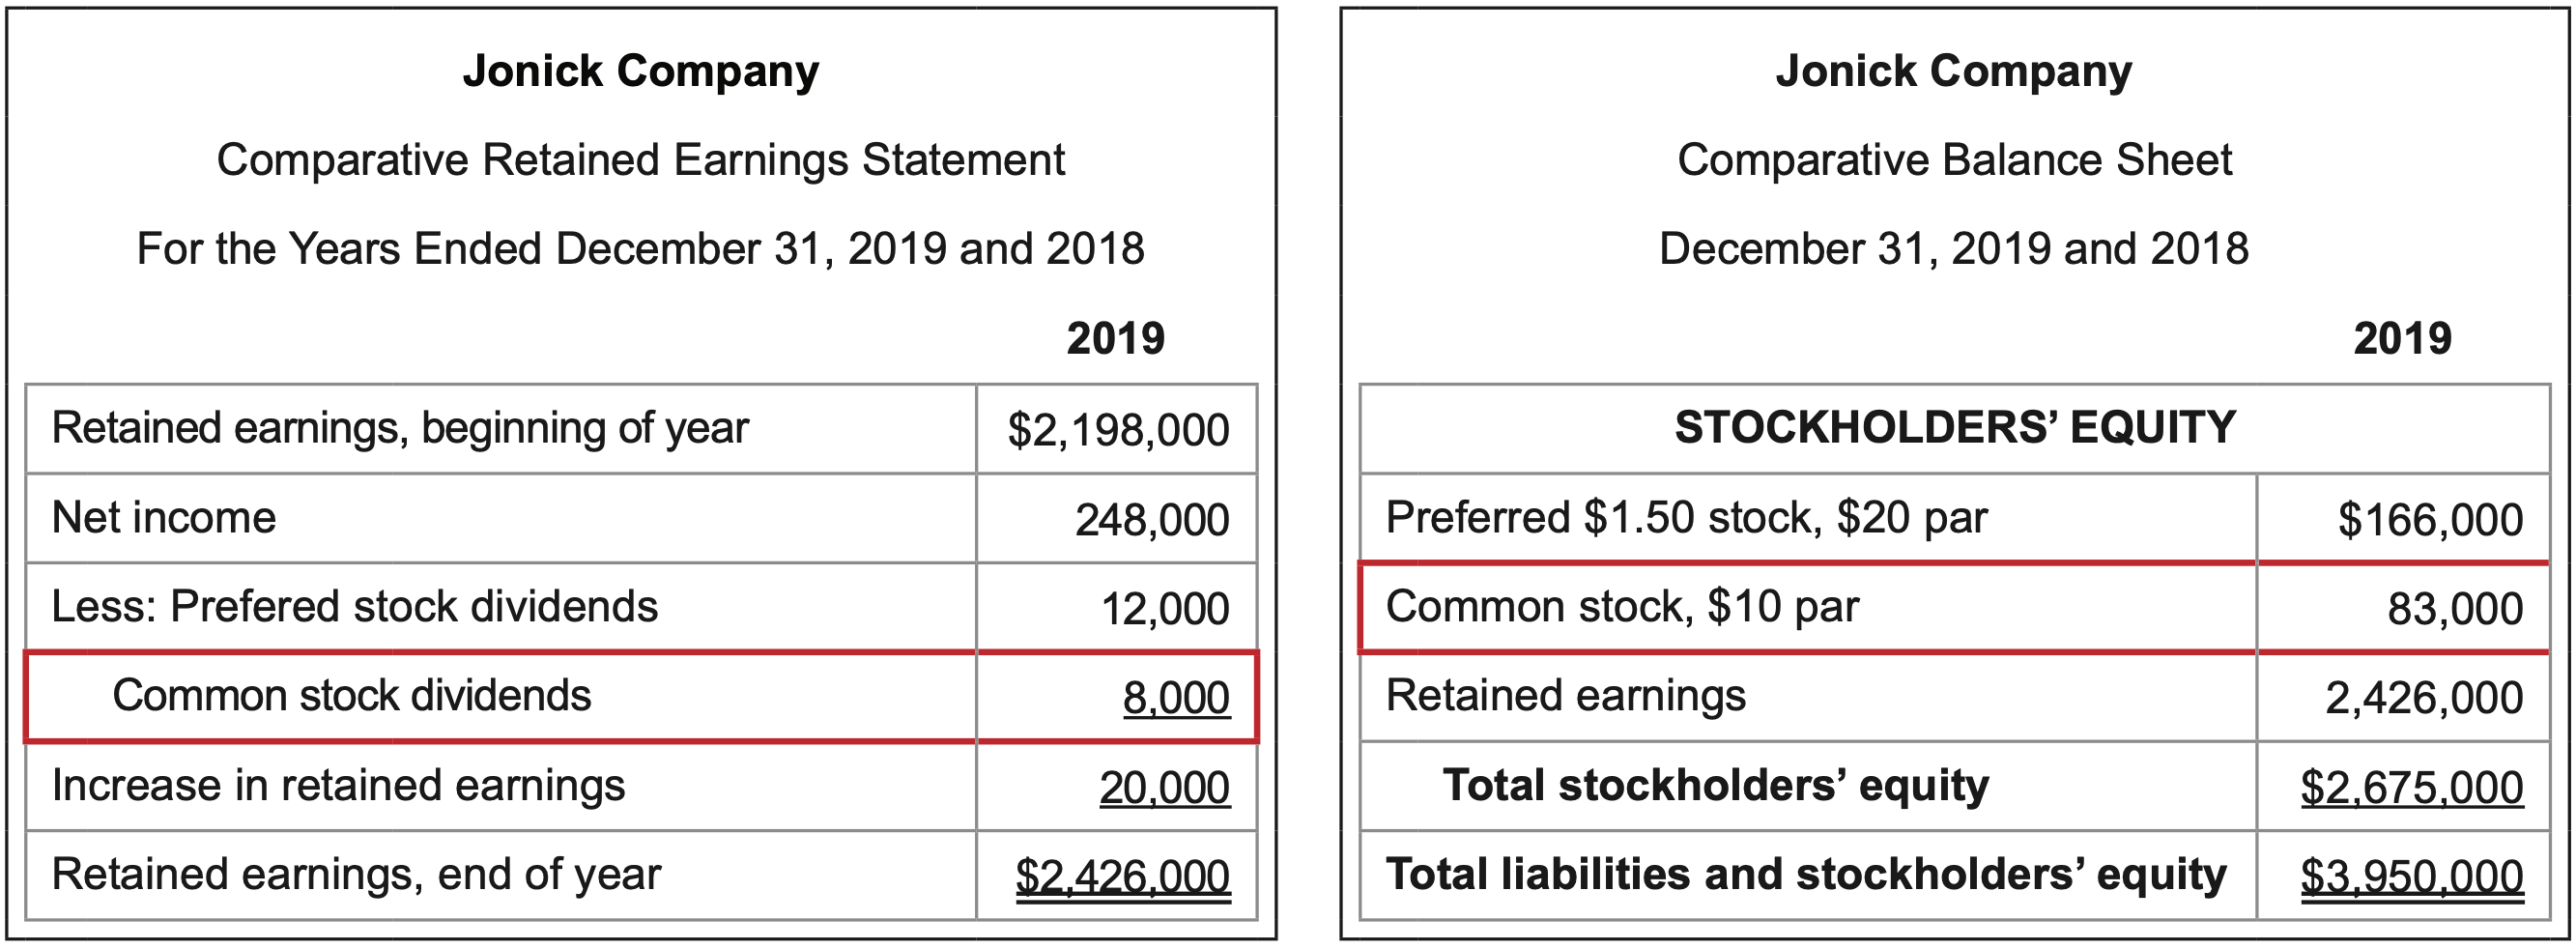
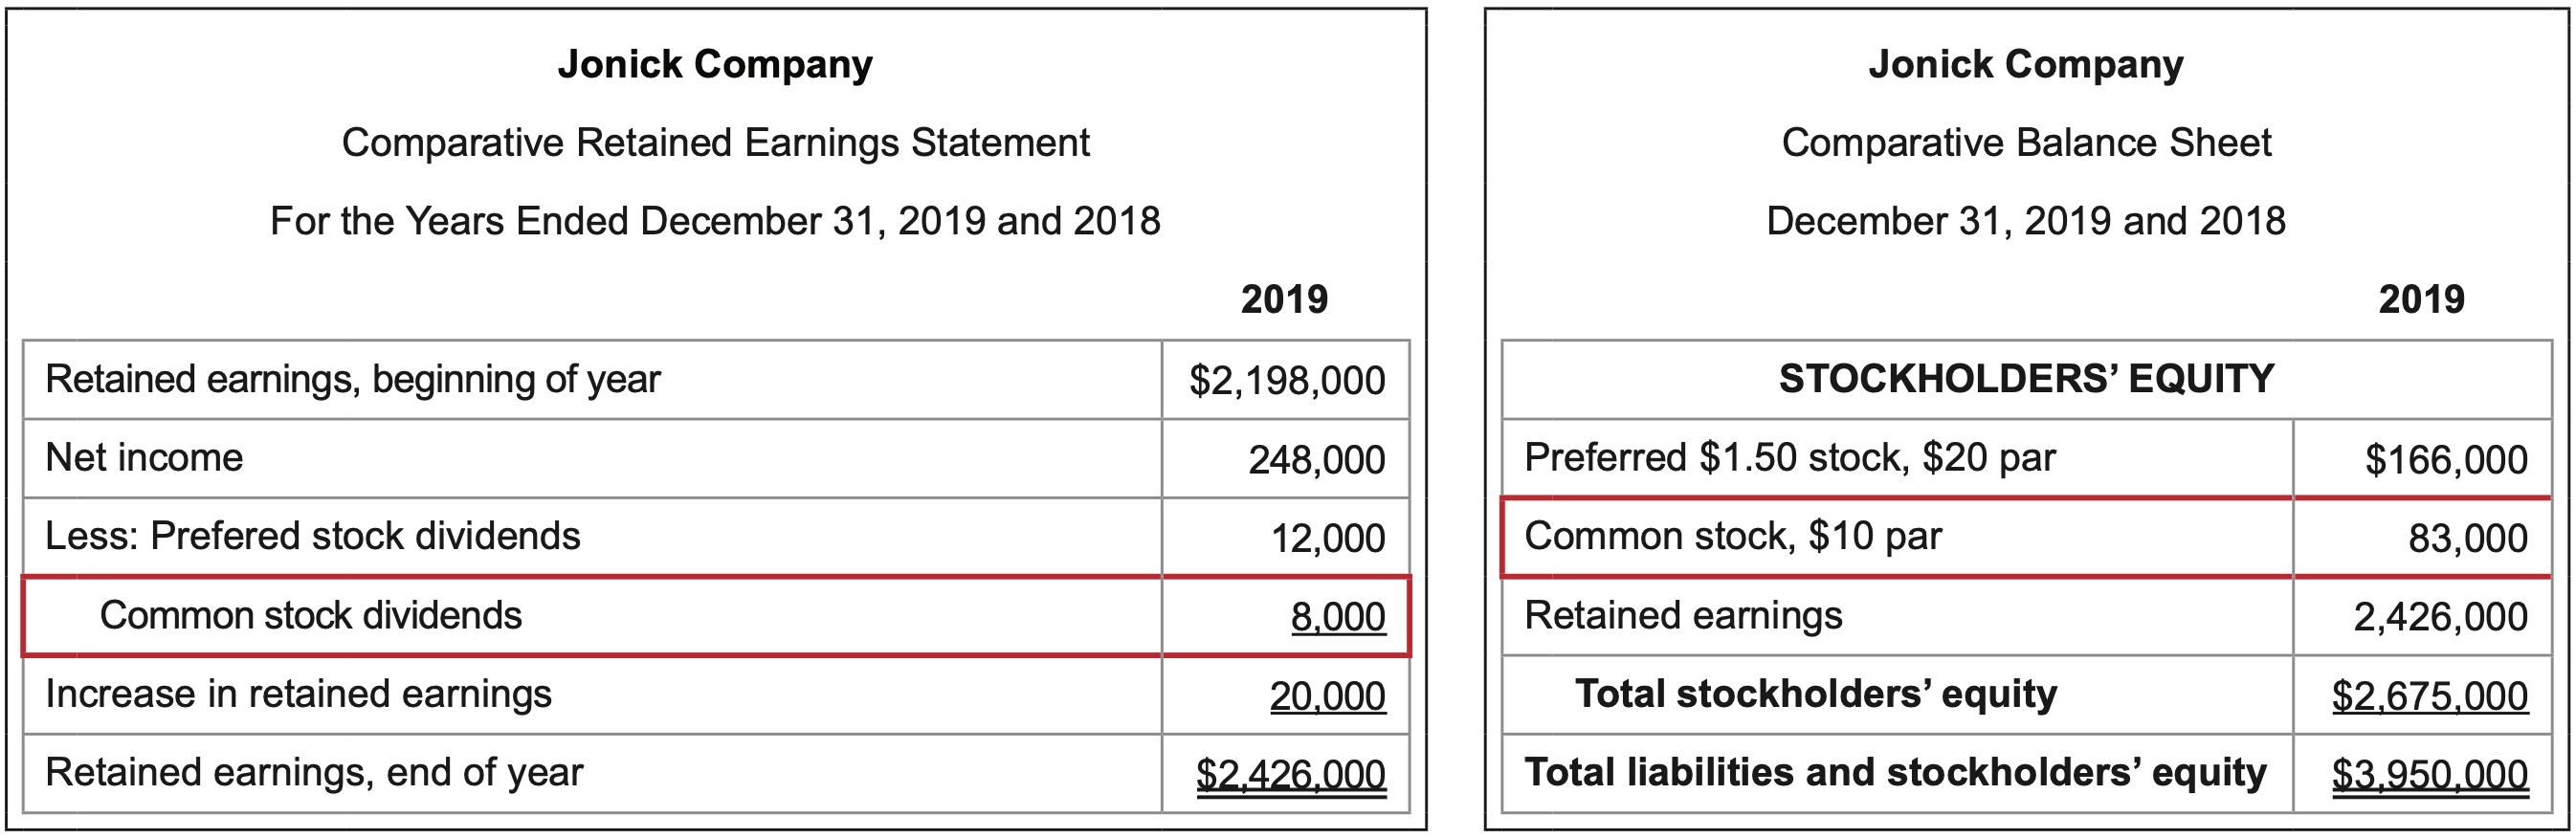
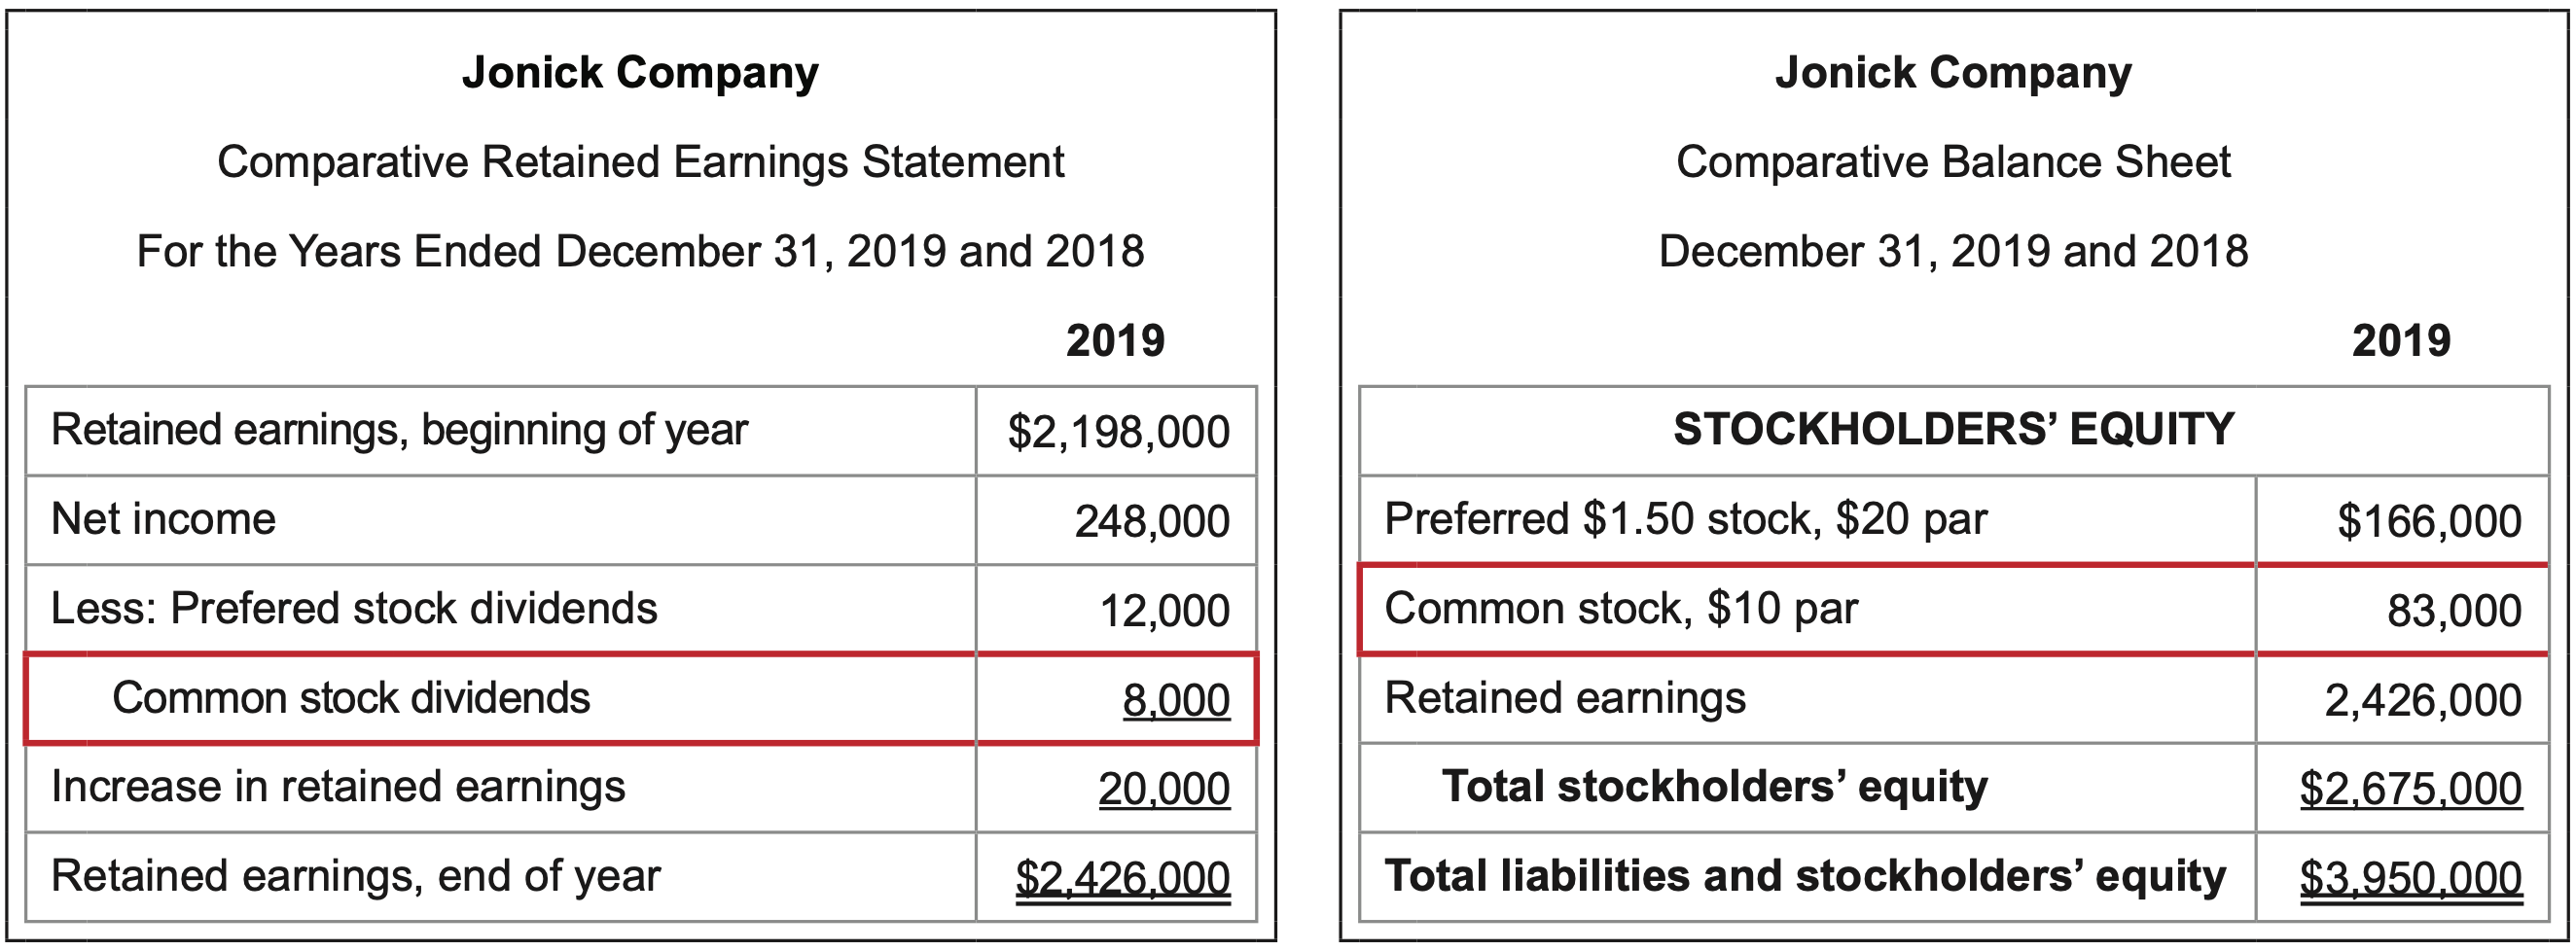
\(\ \text{Calculation}: \frac{\text {Net income }}{\text { Preferred dividends }}=\frac{248,000}{12,000}=20.7\)
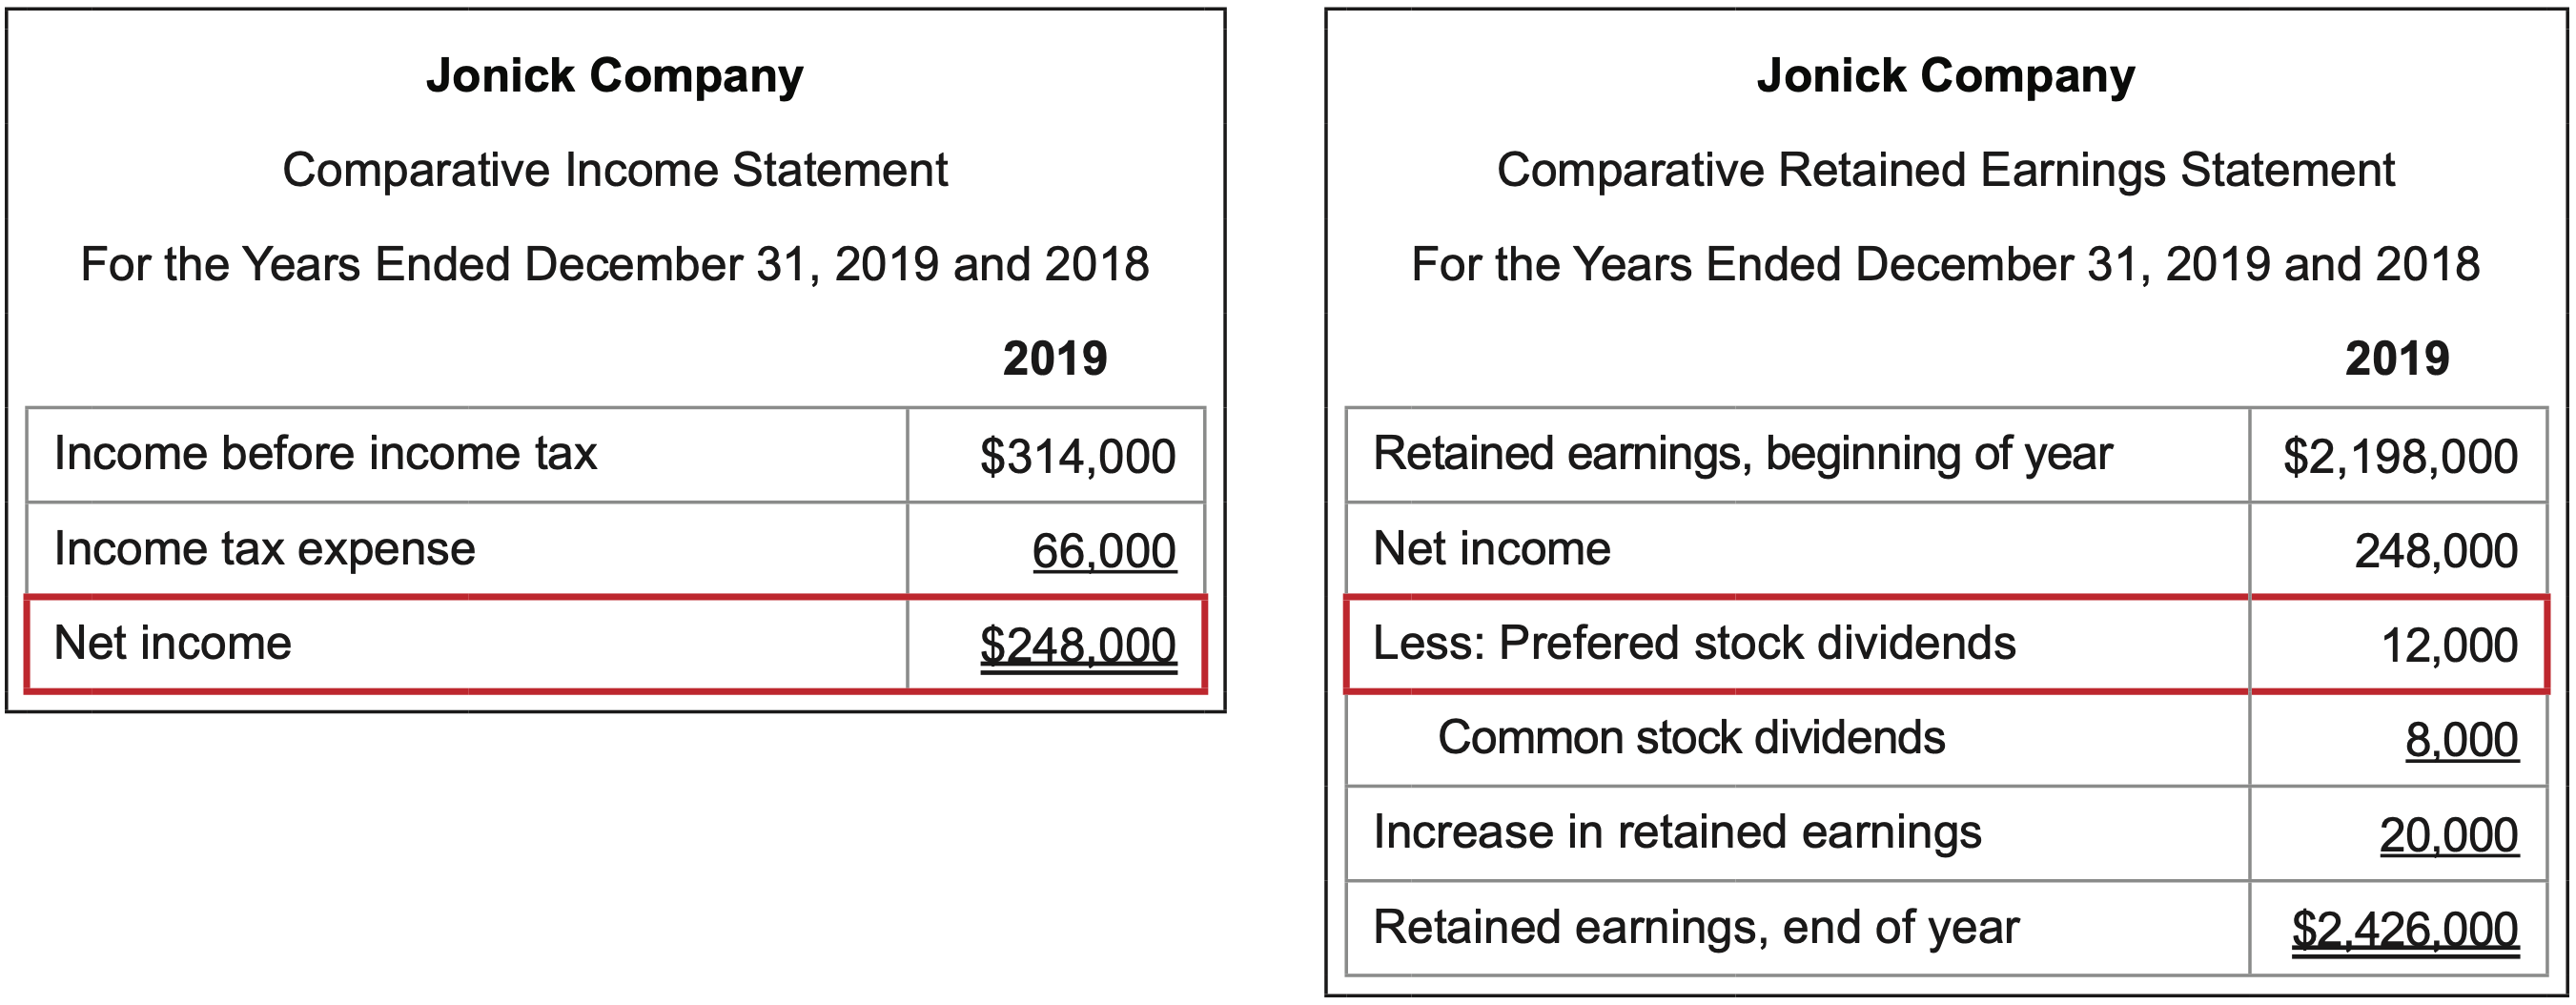
Interpretation: The higher the better.
The ratio looks at net income that is available to pay preferred dividends, which are paid on an after-tax basis, and after all expenses have been covered by the sales that were generated. The number of times anything is earned is always more favorable when it is higher since it impacts the margin of safety and the ability to pay as earnings fluctuate.
Profitability analysis evaluates a corporation’s operational ability to generate revenues that exceed associated costs in a given period of time.
Profitability ratios may incorporate the concept of leverage, which is how effectively one financial element generates a progressively larger return on another element. Thes first five ratios that follow look at how well the assets, liabilities, or equities in the denominator of each ratio are able produce a relatively high value in the respective numerator. Ths final two ratios evaluate how well sales translate into gross profit and net income.
ASSET TURNOVER
What it measures: how effectively a company uses its assets to generate revenue.
\(\ \text{Calculation}: \frac{\text {Sales }}{\text { Average total assets (excluding long-term investments) }}=\frac{994,000}{(3,950,000 - 1,946,000 + 3,606,000 - 1,822,000)/2}=52.5 \)%
Long-term investments are not included in the calculation because they are not productivity assets used to generate sales to customers.
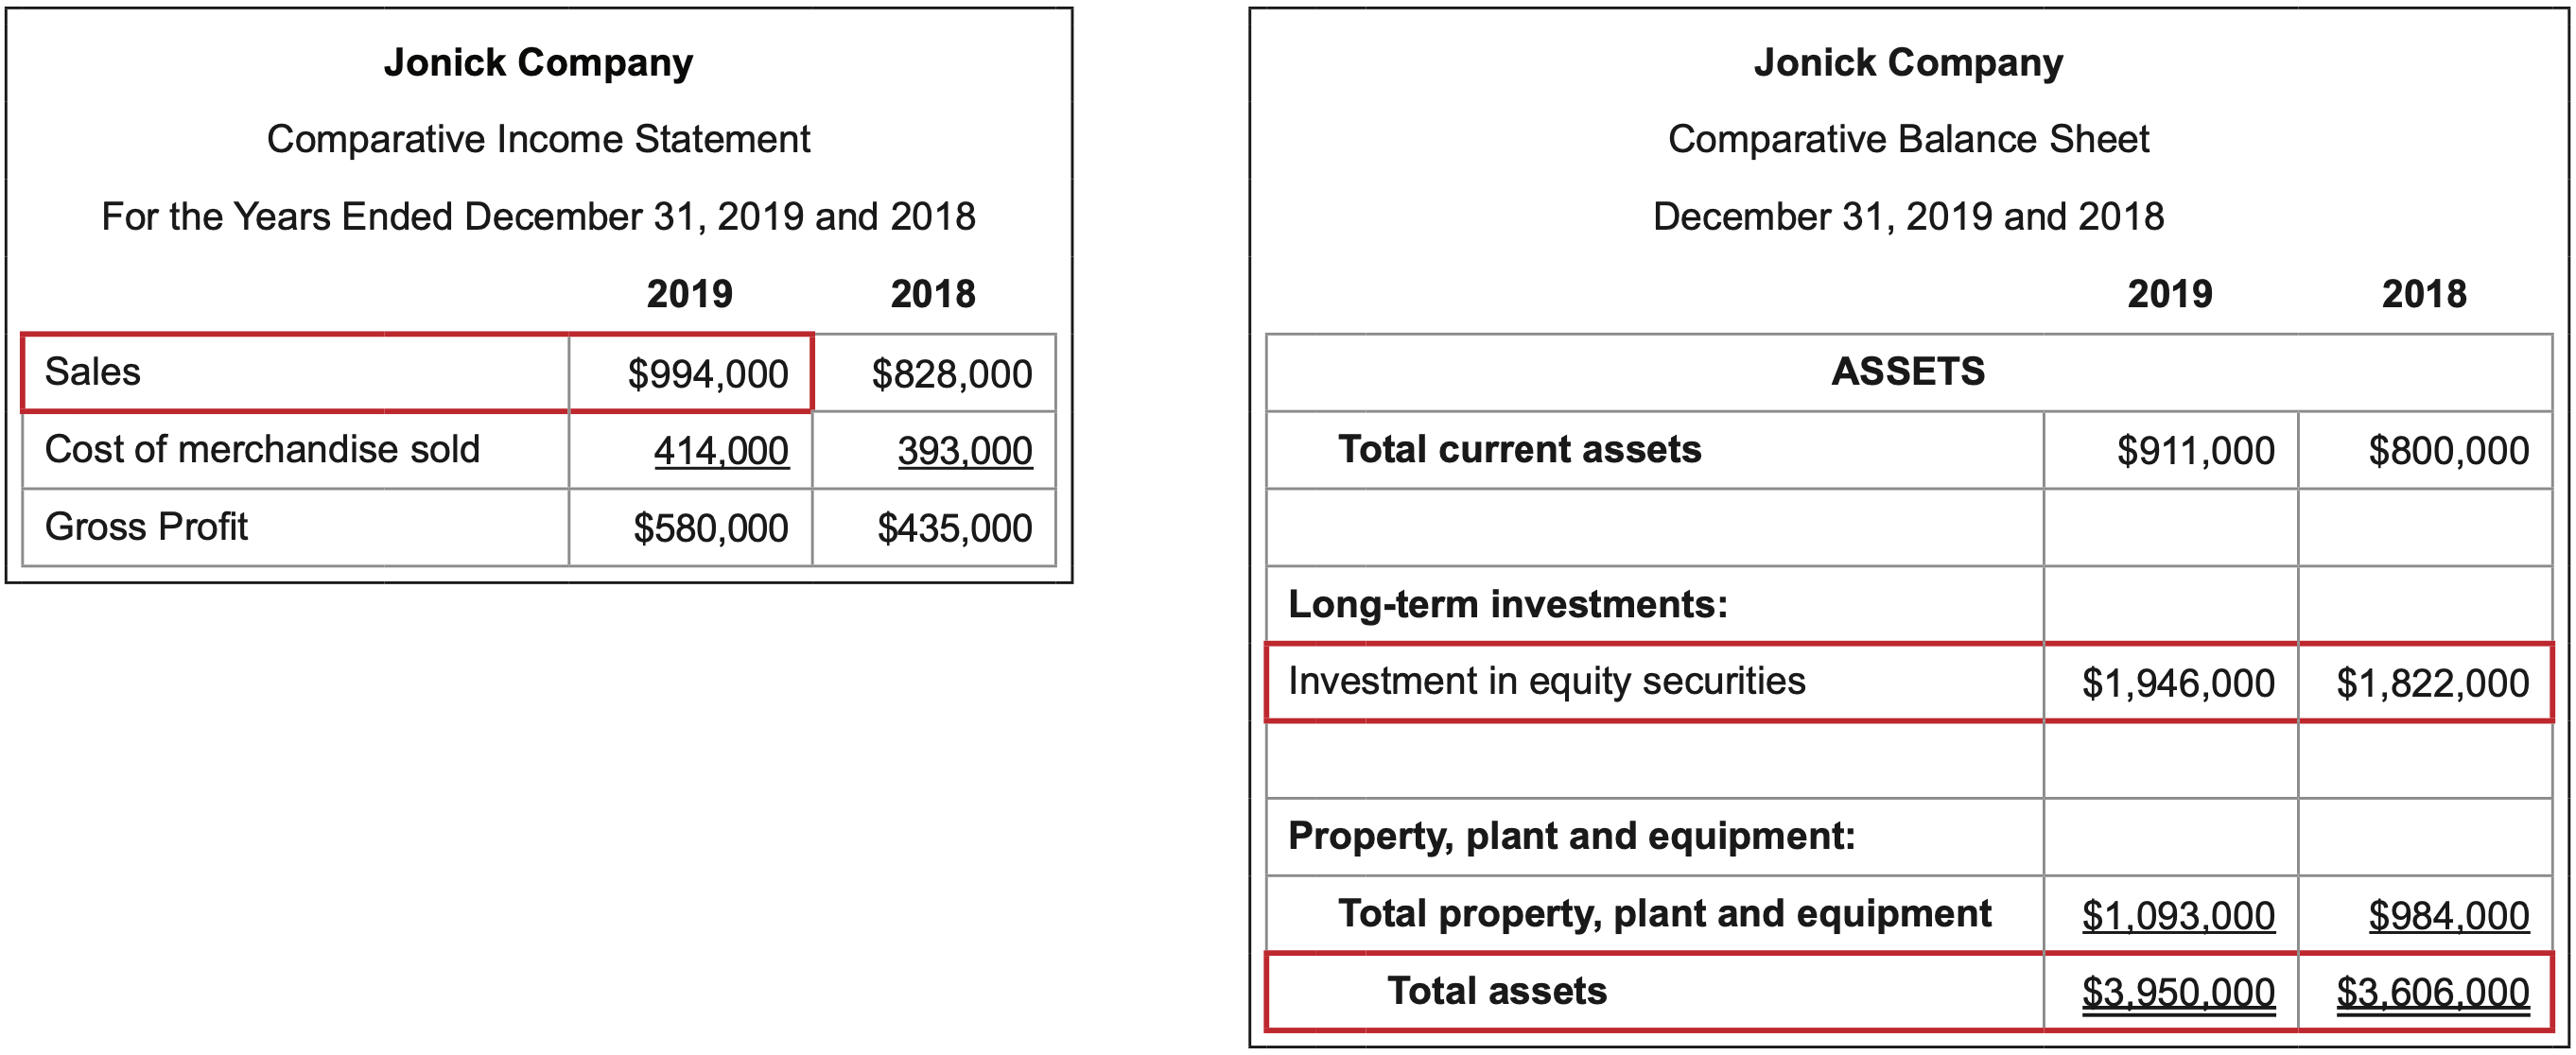
Interpretation: The higher the better.
The ratio looks at the value of most of a company’s assets and how well they are leveraged to produce sales. The goal of owning the assets is that they should generate revenue that ultimately results in cash flow and profit.
RETURN ON TOTAL ASSETS
What it measures: how effectively a company uses its assets to generate net income.
\(\ \text{Calculation}: \frac{\text {Net income + Interest expense }}{\text {Average total assets
}}=\frac{248,000 + 55,000}{(3,950,000 + 3,606,000)/2}=8.0 \)%
Interest expense relates to financed assets, so it is added back to net income since how the assets are paid for should be irrelevant.
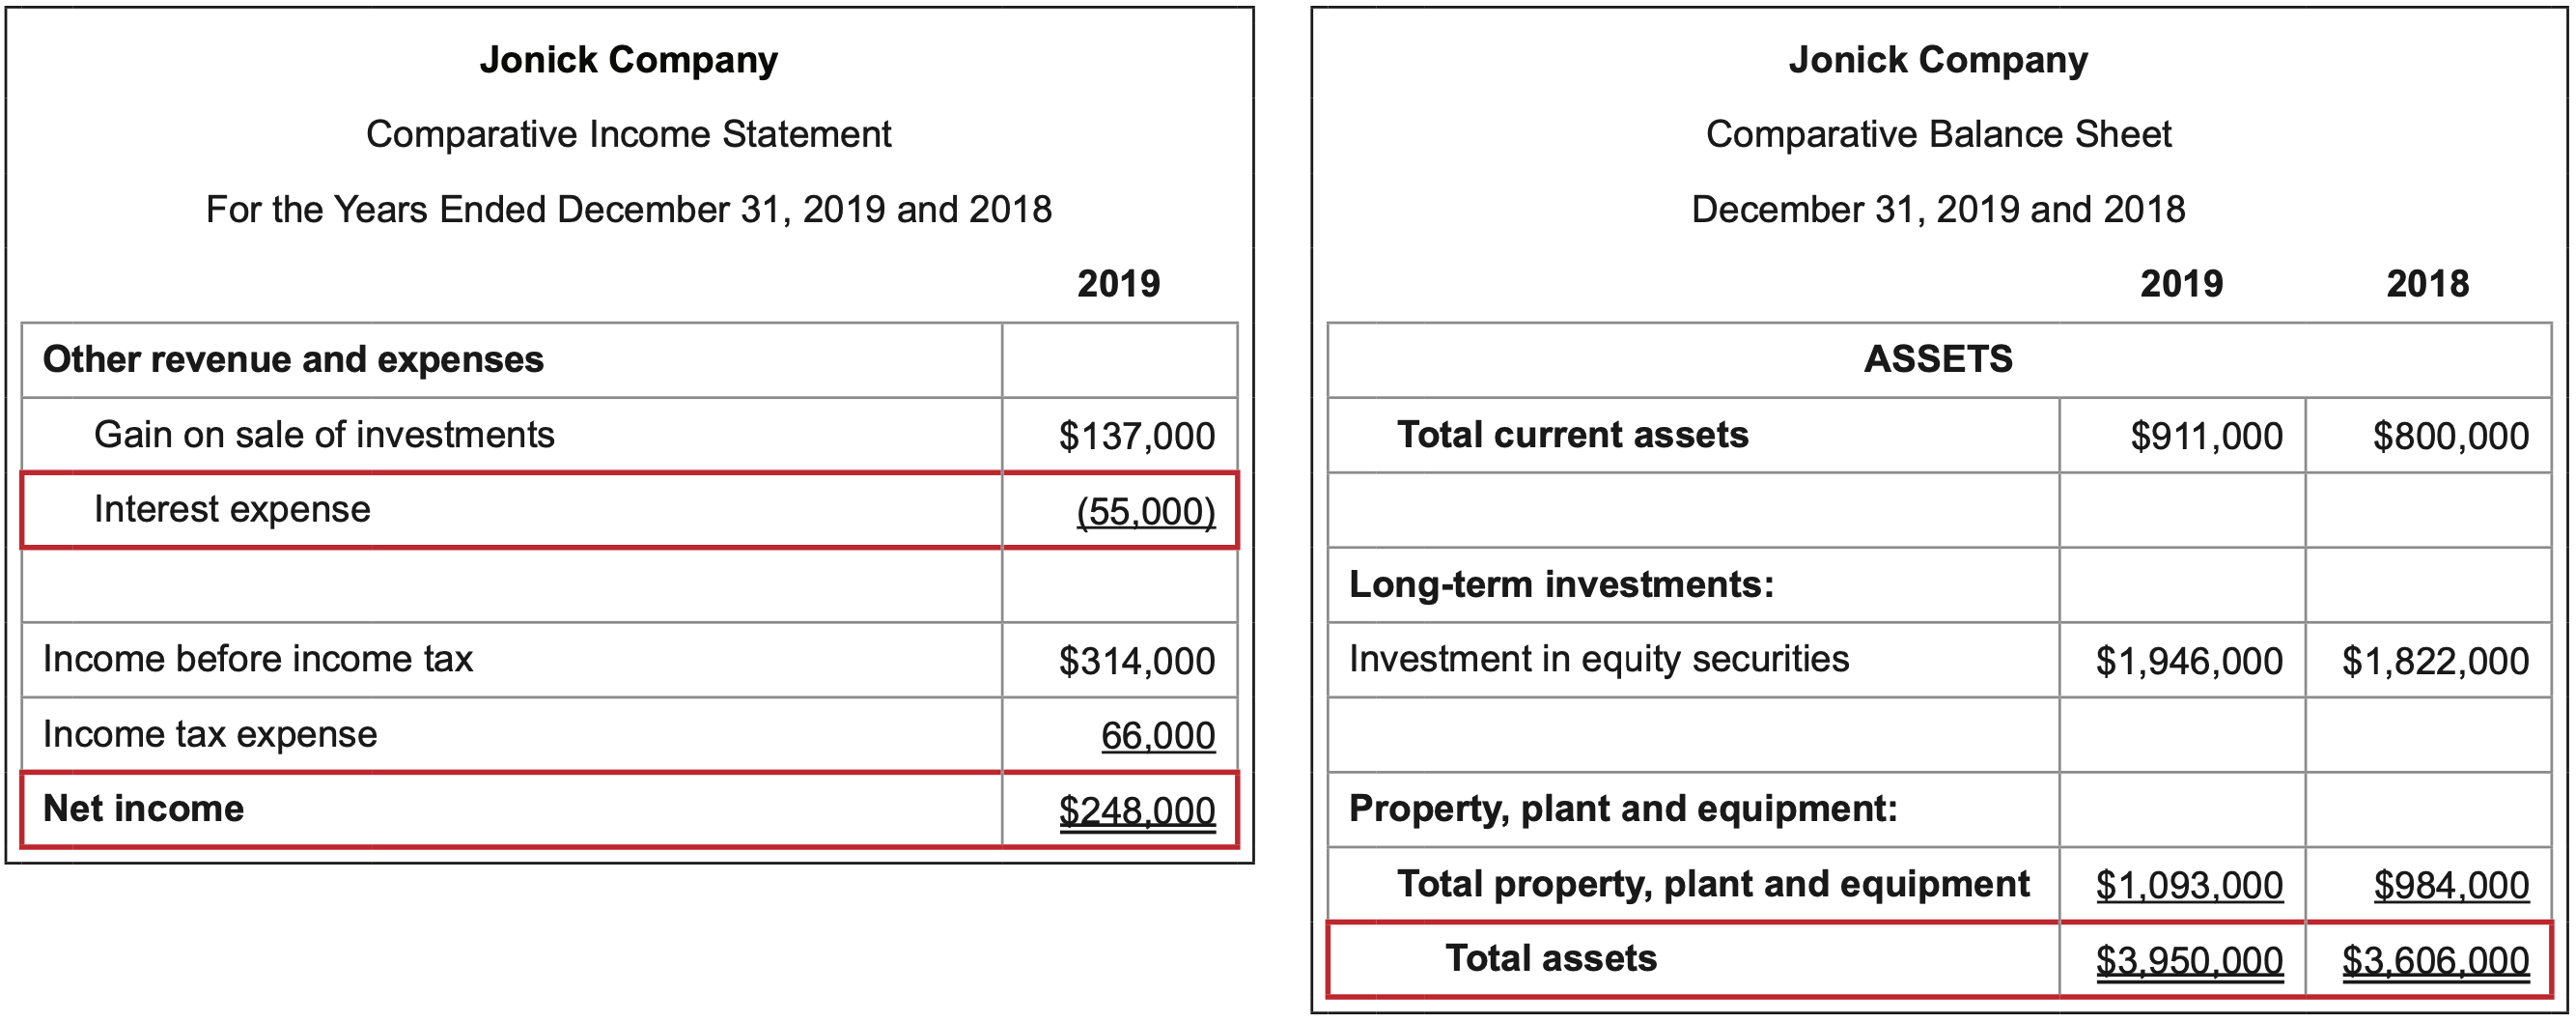
Interpretation: The higher the better.
The ratio looks at the value of a company’s assets and how well they are leveraged to produce net income. The goal of owning the assets is that they should generate cash flow and profit.
RETURN ON STOCKHOLDERS’ EQUITY
What it measures: how effectively a company uses the investment of its owners to generate net income.
\(\ \text{Calculation}: \frac{\text {Net income }}{\text { Average total stockholders’ equity
}}=\frac{248,000}{(2,675,000 + 2,447,000)/2}= 9.7\)%
Interpretation: The higher the better.
The ratio looks at how well the investments of preferred and common stockholders are leveraged to produce net income. One goal of investing in a corporation is for stockholders to accumulate additional wealth as a result of the company making a profit.
RETURN ON COMMON STOCKHOLDERS’ EQUITY (ROE)
What it measures: how effectively a company uses the investment of its common stockholders to generate net income; overall performance of a business.
\(\ \text{Calculation}: \frac{\text {Net income - Preferred dividends }}{\text { Average common stockholders’ equity
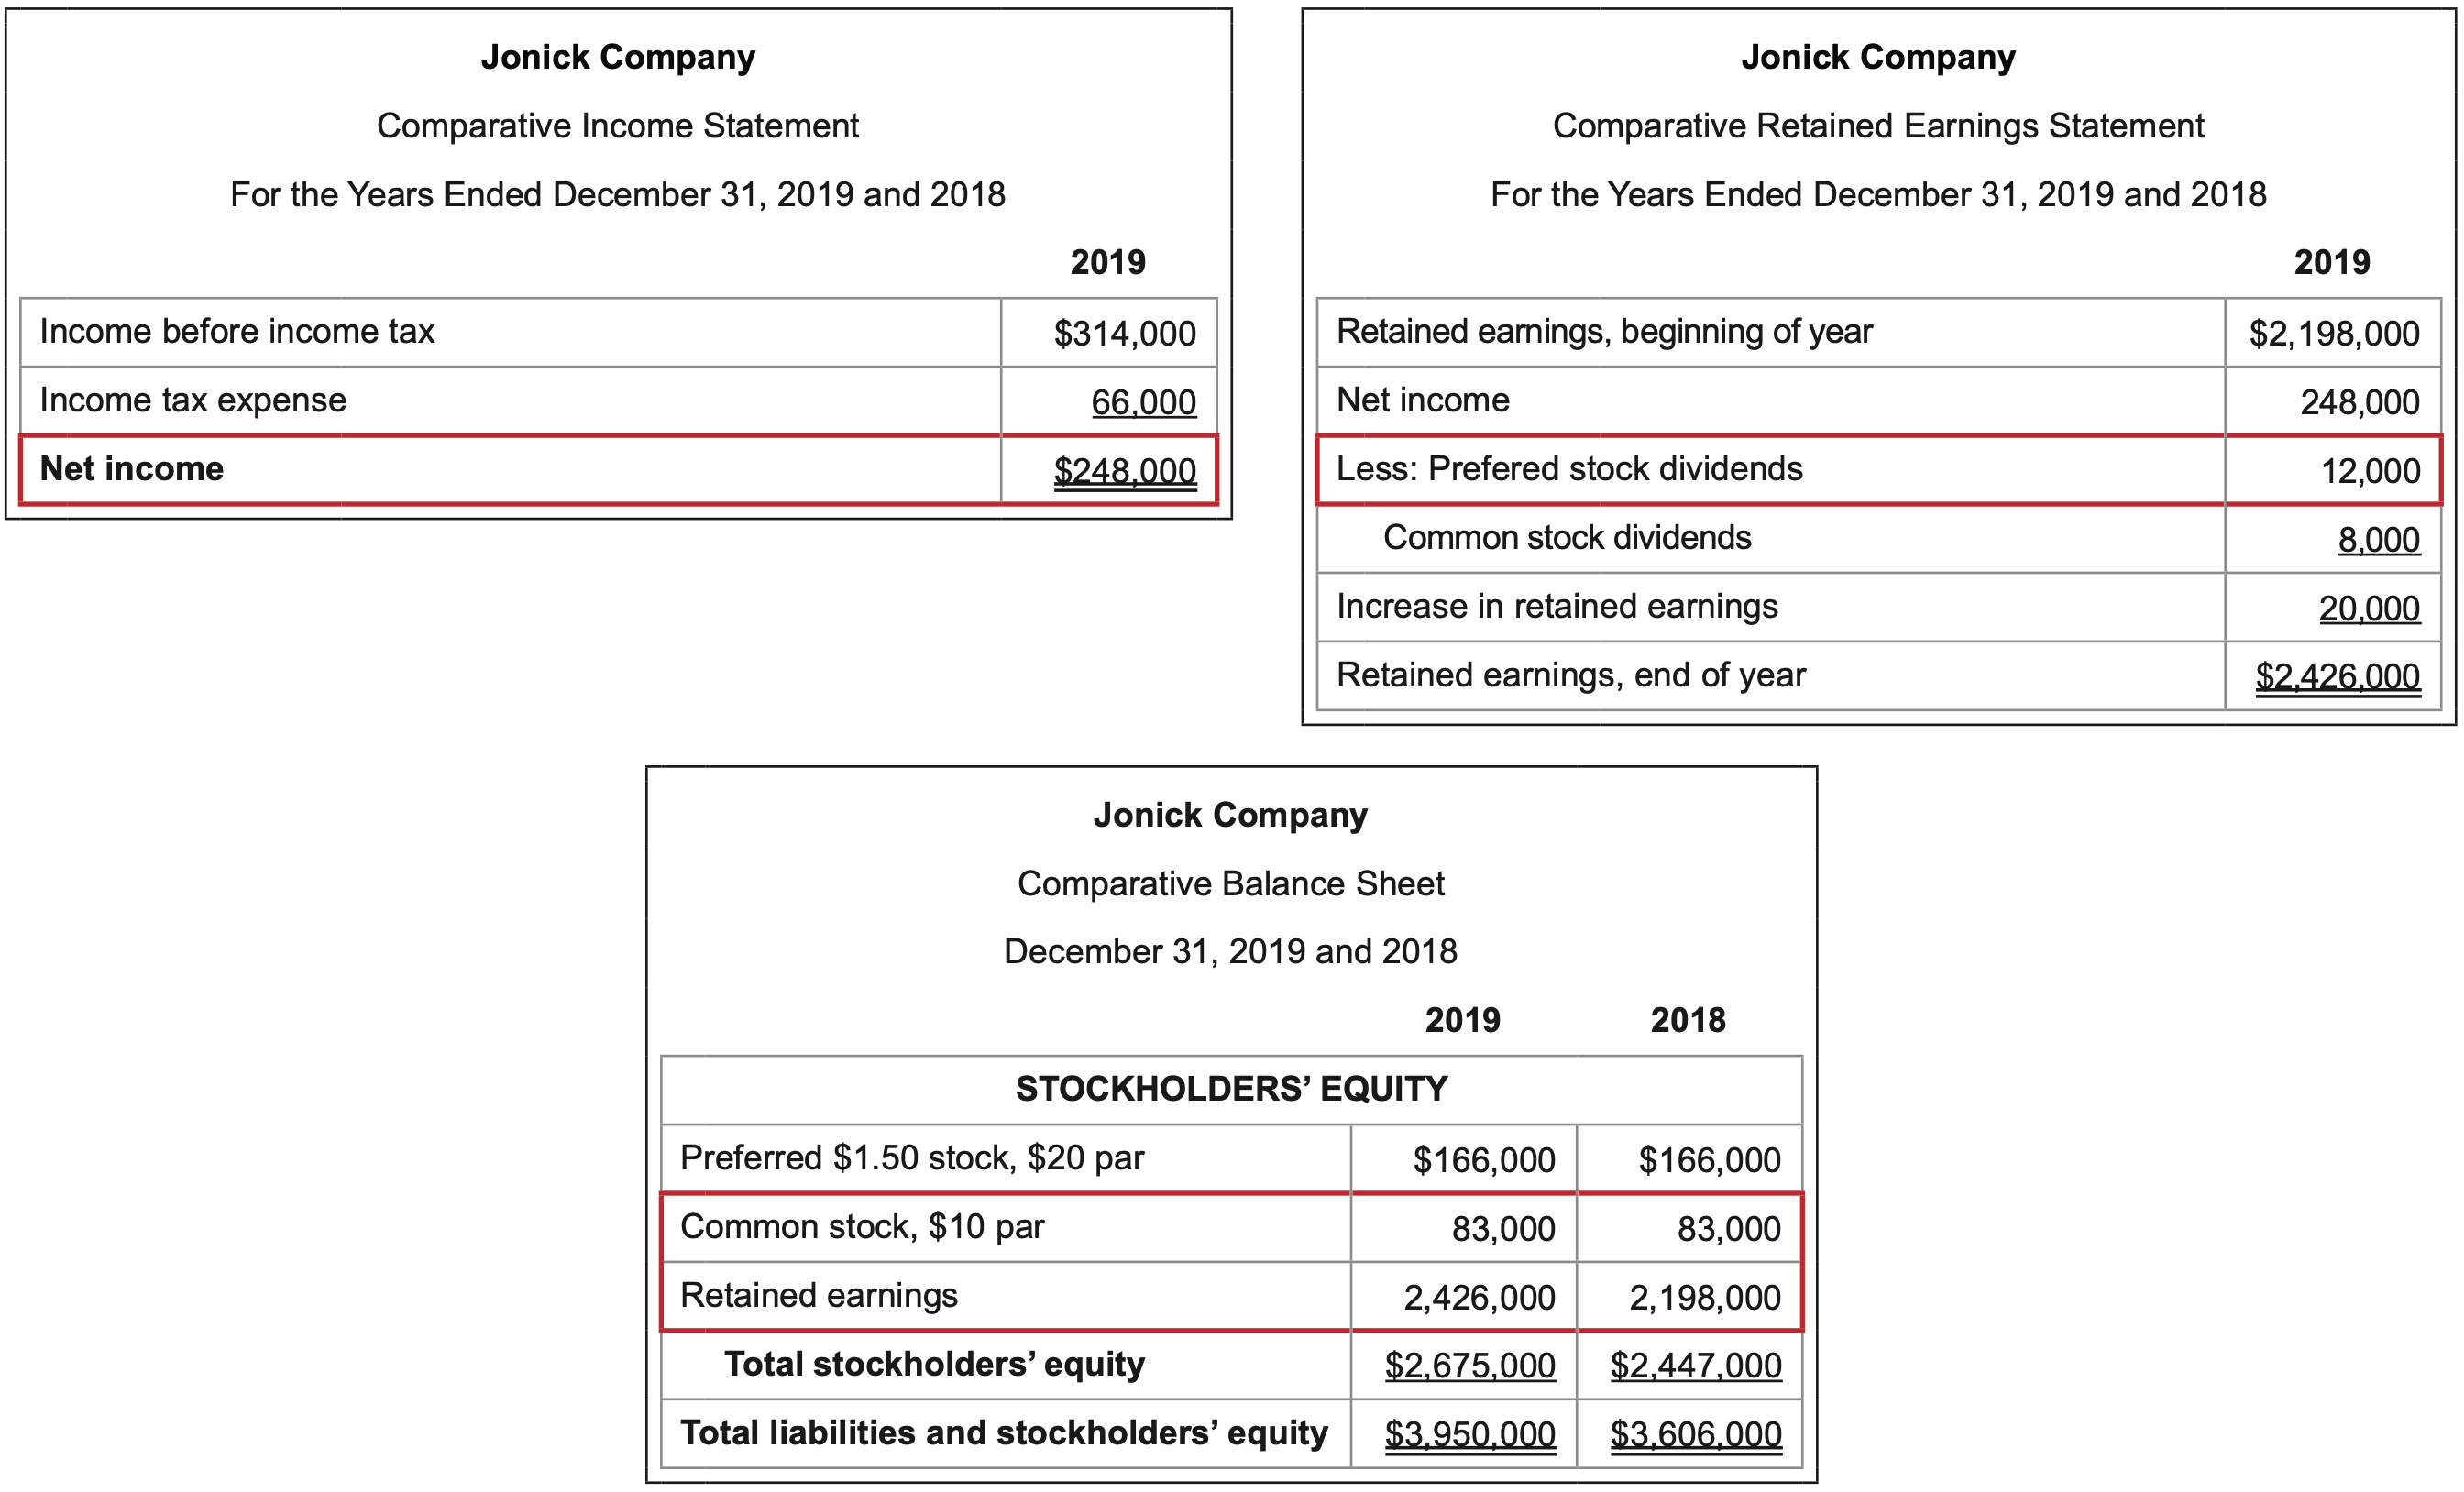
}}=\frac{248,000 - 12,000}{(83,000 + 2,426,000 + 83,000 + 2,198,000)/2}= 9.9\)%
Preferred dividends are removed from the net income amount since they are distributed prior to commonshareholders having any claim on company profits.
In this example, shareholders saw a 9.9% return on their investment. The result indicates that every dollar of common shareholder’s equity earned about $.10 this year.
Interpretation: The higher the better.
The ratio looks at how well the investments of preferred and common stockholders are leveraged to produce net income. One goal of investing in a corporation is for stockholders to accumulate additional wealth as a result of the company making a profit.
EARNINGS PER SHARE ON COMMON STOCK
What it measures: the dollar amount of net income associated with each share of common stock outstanding.
\(\ \text{Calculation}: \frac{\text {Net income - Preferred dividends }}{\text { Number of shares of common stock outstanding
}}=\frac{248,000 - 12,000}{83,000/$10}= $28.43\)
Preferred dividends are removed from the net income amount since they are distributed prior to common shareholders having any claim on company profits.
The number of common shares outstanding is determined by dividing the common stock dollar amount by the par value per share given.
Interpretation: The higher the better.
The ratio is critical in reporting net income at a micro level – per share – rather than in total. A greater net income amount will result in a higher earnings per share given a fixed number of shares.
GROSS PROFIT PERCENTAGE
What it measures: how effectively a company generates gross profit from sales or controls cost of merchandise sold.
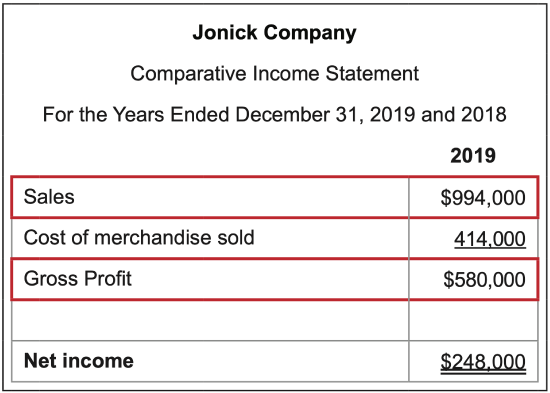
\(\ \text{Calculation}: \frac{\text {Gross profit }}{\text { Sales
}}=\frac{580,000}{994,000}= 58.4\)%
Interpretation: The higher the better.
The ratio looks at the main cost of a merchandising business – what it pays for the items it sells. The lower the cost of merchandise sold, the higher the gross profit, which can then be used to pay operating expenses and to generate profit.
PROFIT MARGIN
What it measures: the amount of net income earned with each dollar of sales generated.
\(\ \text{Calculation}: \frac{\text {Net income }}{\text { Sales
}}=\frac{248,000}{994,000}= 24.9\)%
Interpretation: The higher the better.
The ratio shows what percentage of sales are left over after all expenses are paid by the business.
Finally, a Dupont analysis breaks down three components of the return on equity ratio to explain how a company can increase its return for investors. It may be evaluated on a relative basis, comparing a company’s Dupont results with either another company’s results, with industry standards, or with expected or desired results.
DUPONT ANALYSIS
What it measures: a company’s ability to increase its return on equity by analyzing what is causing the current ROE.
|
Calculation: |
Profit margin |
x |
Total asset turnover |
x |
Financial leverage |
|
(Net income / Sales) |
x |
(Sales / Average total assets) |
x |
(Total assets / Total equity) |
|
|
Example of a simple comparison of two similar companies with the same return on investment of 30%. |
|||||
|
Profit margin |
x |
Total asset turnover |
x |
Financial leverage |
|
|
Company A |
.30 |
.5 |
2.0 |
||
|
Company B |
.15 |
4.0 |
.5 |
||
Results indicate that Company A has a higher profit margin and greater financial leverage. Its weaker position on total asset turnover as compared to Company B is what brings down its ROE. The analysis of the components of ROE provides insight of areas to address for improvement.
Interpretation: Investors are not looking for large or small output numbers from this model. Investors want to analyze and pinpoint what is causing the current ROE to identify areas for improvement. This model breaks down the return on equity ratio to explain how companies can increase their return for investors.
Return-on-investment analysis looks at actual distributions of current earnings or expected future earnings.
DIVIDENDS PER SHARE ON COMMON STOCK
What it measures: the dollar amount of dividends associated with each share of common stock outstanding.
\(\ \text{Calculation}: \frac{\text {Common stock dividends }}{\text { Number of shares of common stock outstanding
}}=\frac{8,000}{83,000/$10}= $0.96\)
The number of common shares outstanding is determined by dividing the common stock dollar amount by the par value per share given.
Interpretation: If stockholders desire maximum dividends payouts, then the higher the better. However, some stockholders prefer to receive minimal or no dividends since dividend payouts are taxable or because they prefer that their returns be reinvested. Then lower payouts would be better.
The ratio reports distributions of net income in the form of cash at a micro level – per share – rather than in total. A greater dividends per share amount will result from a higher net income amount given a fixed number of shares.
DIVIDENDS YIELD
What it measures: the rate of return to common stockholders from cash dividends.
Assume that the market price per share is $70.00.
\(\ \text{Calculation}: \frac{\text {Common dividends / Common shares outstanding }}{\text { Market price per share
}}=\frac{$0.96}{$70.00}= 1.4\)%
The number of common shares outstanding is determined by dividing the common stock dollar amount by the par value per share given.
Interpretation: If stockholders desire maximum dividend payouts, then the higher the better. However, some stockholders prefer to receive minimal or no dividends since dividend payouts are taxable or because they prefer that their returns be reinvested. Then lower payouts would be better.
The ratio compares common stock distributions to the current market price. This conversion allows comparison between different companies and may be of particular interest to investors who wish to maximize dividend revenue.
PRICE EARNINGS RATIO
What it measures: the prospects of future earnings.
Assume that the market price per share is $70.00.
\(\ \text{Calculation}: \frac{\text {Market price per share }}{\text { Common stock earnings per share
}}=\frac{$70.00}{$28.43}= 2.5\)
Recall that earnings per share is (Net income – Preferred stock dividends) / Number of shares of common stock.
Interpretation: The higher the better.
The more the market price exceeds earnings, the greater the prospect of value growth, particularly if this ratio increases over time.All the analytical measures discussed, taken individually and collectively, are used to evaluate a company’s operating performance and financial strength. They are particularly informative when compared over time to expected or desired standards. The ability to learn from the financial statements makes the processes of collecting, analyzing, summarizing, and reporting financial information all worthwhile.