
15.1: Analyzing Comparative Financial Statements
- Page ID
- 62239
\( \newcommand{\vecs}[1]{\overset { \scriptstyle \rightharpoonup} {\mathbf{#1}} } \)
\( \newcommand{\vecd}[1]{\overset{-\!-\!\rightharpoonup}{\vphantom{a}\smash {#1}}} \)
\( \newcommand{\id}{\mathrm{id}}\) \( \newcommand{\Span}{\mathrm{span}}\)
( \newcommand{\kernel}{\mathrm{null}\,}\) \( \newcommand{\range}{\mathrm{range}\,}\)
\( \newcommand{\RealPart}{\mathrm{Re}}\) \( \newcommand{\ImaginaryPart}{\mathrm{Im}}\)
\( \newcommand{\Argument}{\mathrm{Arg}}\) \( \newcommand{\norm}[1]{\| #1 \|}\)
\( \newcommand{\inner}[2]{\langle #1, #2 \rangle}\)
\( \newcommand{\Span}{\mathrm{span}}\)
\( \newcommand{\id}{\mathrm{id}}\)
\( \newcommand{\Span}{\mathrm{span}}\)
\( \newcommand{\kernel}{\mathrm{null}\,}\)
\( \newcommand{\range}{\mathrm{range}\,}\)
\( \newcommand{\RealPart}{\mathrm{Re}}\)
\( \newcommand{\ImaginaryPart}{\mathrm{Im}}\)
\( \newcommand{\Argument}{\mathrm{Arg}}\)
\( \newcommand{\norm}[1]{\| #1 \|}\)
\( \newcommand{\inner}[2]{\langle #1, #2 \rangle}\)
\( \newcommand{\Span}{\mathrm{span}}\) \( \newcommand{\AA}{\unicode[.8,0]{x212B}}\)
\( \newcommand{\vectorA}[1]{\vec{#1}} % arrow\)
\( \newcommand{\vectorAt}[1]{\vec{\text{#1}}} % arrow\)
\( \newcommand{\vectorB}[1]{\overset { \scriptstyle \rightharpoonup} {\mathbf{#1}} } \)
\( \newcommand{\vectorC}[1]{\textbf{#1}} \)
\( \newcommand{\vectorD}[1]{\overrightarrow{#1}} \)
\( \newcommand{\vectorDt}[1]{\overrightarrow{\text{#1}}} \)
\( \newcommand{\vectE}[1]{\overset{-\!-\!\rightharpoonup}{\vphantom{a}\smash{\mathbf {#1}}}} \)
\( \newcommand{\vecs}[1]{\overset { \scriptstyle \rightharpoonup} {\mathbf{#1}} } \)
\( \newcommand{\vecd}[1]{\overset{-\!-\!\rightharpoonup}{\vphantom{a}\smash {#1}}} \)
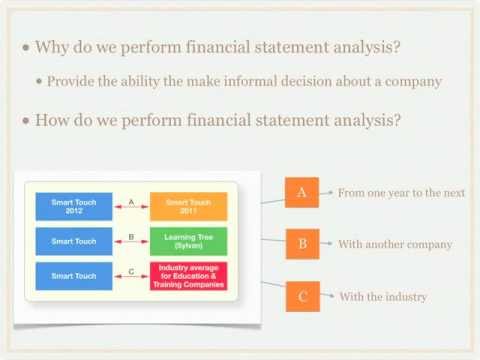
This chapter discusses several common methods of analyzing and relating the data in financial statements and, as a result, gaining a clear picture of the solvency and profitability of a company. Internally, management analyzes a company’s financial statements as do external investors, creditors, and regulatory agencies. Although these users have different immediate goals, their overall objective in financial statement analysis is the same—to make predictions about an organization as an aid in decision making.
A YouTube element has been excluded from this version of the text. You can view it online here: pb.libretexts.org/llfinancialaccounting/?p=308
Objectives of financial statement analysis
Management’s analysis of financial statements primarily relates to parts of the company. Using this approach, management can plan, evaluate, and control operations within the company. Management obtains any information it wants about the company’s operations by requesting special-purpose reports. It uses this information to make difficult decisions, such as which employees to lay off and when to expand operations. Our primary focus in this chapter, however, is not on the special reports accountants prepare for management. Rather, it is on the information needs of persons outside the firm.
Investors, creditors, and regulatory agencies generally focus their analysis of financial statements on the company as a whole. Since they cannot request special-purpose reports, external users must rely on the general-purpose financial statements that companies publish. These statements include a balance sheet, an income statement, a statement of stockholders’ equity, a statement of cash flows, and the explanatory notes that accompany the financial statements.
Financial statement analysis consists of applying analytical tools and techniques to financial statements and other relevant data to obtain useful information. This information reveals significant relationships between data and trends in those data that assess the company’s past performance and current financial position. The information shows the results or consequences of prior management decisions. In addition, analysts use the information to make predictions that may have a direct effect on decisions made by users of financial statements.
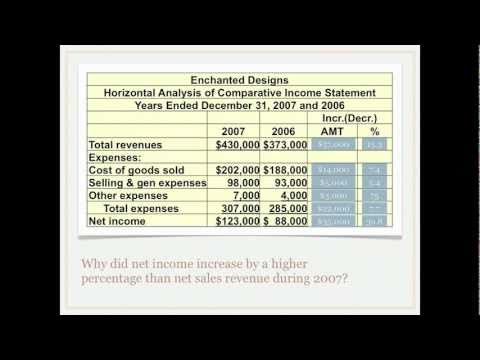
Comparative financial statements present the same company’s financial statements for one or two successive periods in side-by-side columns. The calculation of dollar changes or percentage changes in the statement items or totals is horizontal analysis. This analysis detects changes in a company’s performance and highlights trends.
The good news is you have already been performing the first part of horizontal analysis without realizing it when you were preparing the statement of cash flows. Horizontal analysis consists of 2 things:
- Dollar amount of change (calculated as Current Year amount – Previous Year amount)
- Percentage of change (calculated as Dollar amount of change / previous year amount)
Horizontal analysis is called horizontal because we look at one account at a time across time. We can perform this type of analysis on the balance sheet or the income statement. Let’s look at this video followed by another example.
A YouTube element has been excluded from this version of the text. You can view it online here: pb.libretexts.org/llfinancialaccounting/?p=308
The comparative financial statements of Synotech, Inc., will serve as a basis for an example of horizontal analysis and vertical analysis of a balance sheet and a statement of income and retained earnings. Recall that horizontal analysis calculates changes in comparative statement items or totals. Here is an example of Synotech, Inc. current asset section (in millions) of the balance sheet with horizontal analysis performed:
| 2015 | 2014 | Increase (or Decrease) | Percent of Change | |
| Current assets: | ||||
| Cash | $ 298.00 | $ 250.50 | $ 47.50 | 19.0% |
| Marketable securities | 71.30 | 57.50 | $ 13.80 | 24.0% |
| Receivables, net | 1,277.30 | 1,340.30 | $ (63.00) | -4.7% |
| Inventories | 924.80 | 929.80 | $ (5.00) | -0.5% |
| Other current assets | 275.30 | 254.30 | $ 21.00 | 8.3% |
| Total current assets | $ 2,846.70 | $ 2,832.40 | $ 14.30 | 0.5% |
What does this tell us? Notice total current assets have increased $ 14.3 million, consisting largely of increases in cash, marketable securities, and other current assets despite a $63.0 million decrease in net receivables.
Next, study Column (4), which expresses as a percentage the dollar change in Column (3). Frequently, these percentage increases are more informative than absolute amounts, as illustrated by the current asset changes. The percentages reveal that current assets increased .5% which if we compared this to current liabilities would give us an idea if the company could pay their debt in the future.
Studying the percentages on the balance sheet could lead to several other observations. For instance, if there was a 6.9% decrease in long-term debt indicates that interest charges will be lower in the future, having a positive effect on future net income. An increase in retained earnings could be a sign of increased dividends in the future; in addition, the increase in cash of 19% could support this conclusion.
- Accounting Principles: A Business Perspective. Authored by: James Don Edwards, University of Georgia & Roger H. Hermanson, Georgia State University. Provided by: Endeavour International Corporation. Project: The Global Text Project. License: CC BY: Attribution
- What is Financial Statement Analysis? - Accounting Video. Authored by: Brian Routh TheAccountingDr. Located at: youtu.be/8DmChanpSmw. License: All Rights Reserved. License Terms: Standard YouTube License
- What is Financial Statement Analysis: Horizontal Analysis? - Accounting video . Authored by: Brian Routh TheAccountingDr. Located at: youtu.be/x_ltrzpz4Ew. License: All Rights Reserved. License Terms: Standard YouTube License