12.7: Horizontal and Vertical Trend Analysis
- Page ID
- 98105

- LO2 – Describe horizontal and vertical trend analysis, and explain how they are used to analyze financial statements.
Trend analysis is the evaluation of financial performance based on a restatement of financial statement dollar amounts to percentages. Horizontal analysis and vertical analysis are two types of trend analyses.
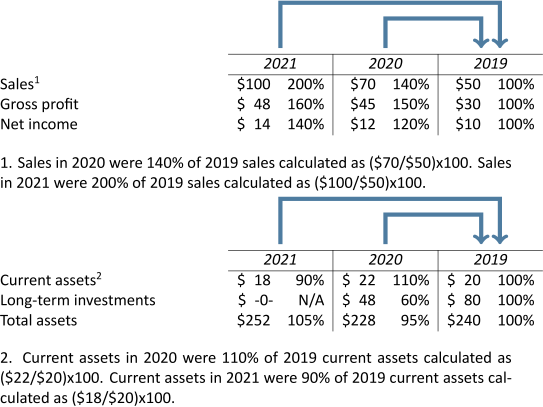
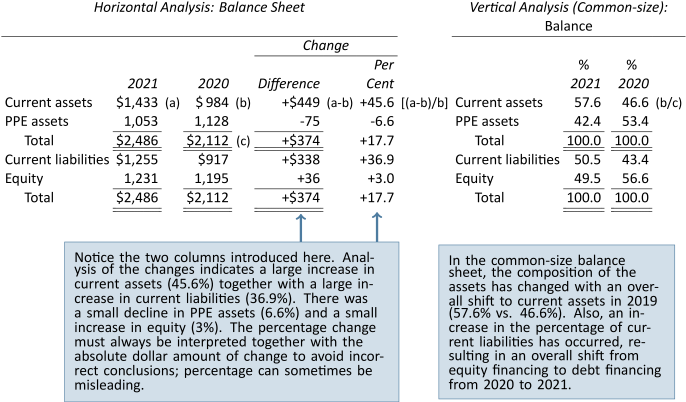
Horizontal analysis involves the calculation of percentage changes from one or more years over the base year dollar amount. The base year is typically the oldest year and is always 100%. The following two examples of horizontal analysis use an abbreviated income statement and balance sheet information where 2019 represents the base year. For demonstration purposes, the percentages have been rounded to the nearest whole number.
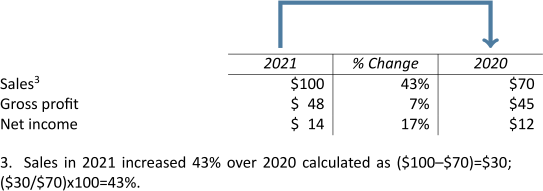
An alternate method of performing horizontal analysis calculations is to simply calculate the percentage change between two years as shown in the following example.
Vertical analysis requires numbers in a financial statement to be restated as percentages of a base dollar amount. For income statement analysis, the base amount used is sales. For balance sheet analysis, total assets, or total liabilities and equity, are used as the base amounts. When financial statements are converted to percentages, they are called common-size financial statements. The following two examples of vertical analysis use information from an abbreviated income statement and balance sheet.
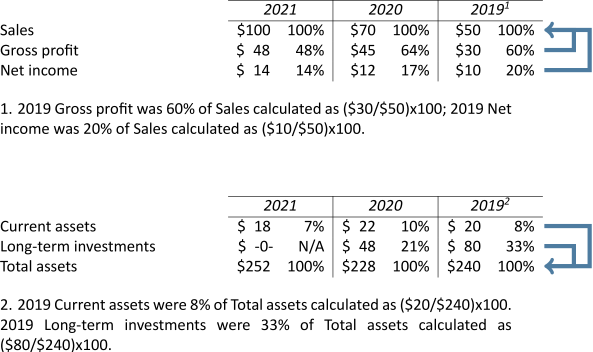
Notice that the same information was used for both the horizontal and vertical analyses examples but that the results are different because of how the dollar amounts are being compared.
Horizontal and vertical analyses of the balance sheets of Big Dog Carworks Corp. are as follows:
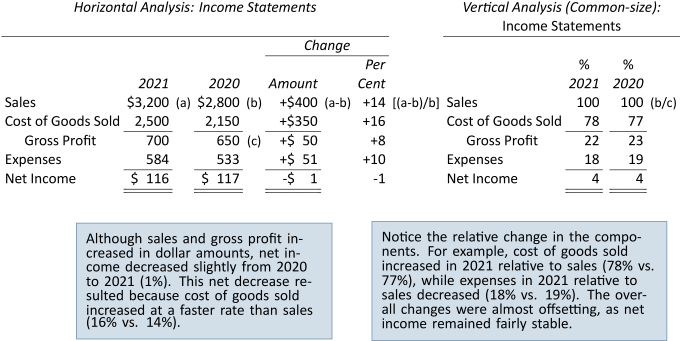
The same analysis of BDCC's income statement is as follows:
The percentages calculated become more informative when compared to earlier years. Further analysis is usually undertaken in order to establish answers to the following questions:
| What caused this change? | How do the percentages of this |
| Is this change favourable or | company compare with other |
| unfavourable? | companies in the same industry? |
| In other industries? |
These and similar questions call attention to areas that require further study. One item of note becomes more apparent as a result of the trend analysis above. Initially, it was stated that operating expenses were increasing between 2019 and 2021. Based on trend analysis, however, these expenses are actually declining as a percentage of sales. As a result, their fluctuations may not be as significant as first inferred. Conversely, the increases each year in cost of goods sold may be worrisome. Initial gross profit ratio calculations seemed to indicate little variation, and thus little effect on income from operations. The increase in cost of goods sold (78% vs. 77% of sales) may warrant further investigation.
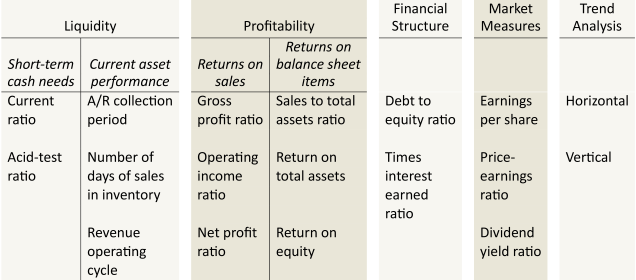
The ratios covered in this chapter are summarized in Figure 12.2.
| Analysis of liquidity: | Calculation of ratio: | Indicates: |
| 1. Working Capital | Current assets – Current liabilities | The excess of current assets available after covering current liabilities (expressed as a dollar amount). |
| 2. Current ratio | The amount of current assets available to pay current liabilities. | |
| 3. Acid-test ratio | Whether the company is able to meet the immediate demands of creditors. (This is a more severe measure of liquidity.) | |
| 4. Accounts receivable collection period | The average time needed to collect receivables. | |
| 5. Number of days of sales in inventory | How many days of sales can be made with existing inventory | |
| 6. Revenue operating cycle | Average number of days to collect receivables + Average number of days of sales inventory | Length of time between the purchase of inventory and the subsequent collection of cash. |
| Analysis of profitability: | Calculation of ratio: | Indicates: |
| 1. Gross profit ratio | The percentage of sales revenue that is left to pay operating expenses, interest, and income taxes after deducting cost of goods sold. | |
| 2. Operating profit ratio | The percentage of sales revenue that is left to pay interest and income taxes expenses after deducting cost of goods sold and operating expenses. | |
| 3. Net profit ratio | The percentage of sales left after payment of all expenses. | |
| 4. Sales to total assets ratio | The adequacy of sales in relation to the investment in assets. | |
| 5. Return on total assets | How efficiently a company uses its assets as resources to earn net income. | |
| 6. Return on equity | The adequacy of net income as a return on equity. |
| Leverage ratios: | Calculation of ratio: | Indicates: |
| 1. Debt ratio | The proportion of total assets financed by debt. | |
| 2. Equity ratio | The proportion of total assets financed by equity. | |
| 3. Debt to equity ratio | The proportion of creditor financing to shareholder financing. | |
| 4. Times interest earned ratio | The ability of a company to pay interest to long-term creditors. |
| Market ratios: | Calculation of ratio: | Indicates: |
| 1. Earnings per share | The amount of net income that has been earned on each common share after deducting dividends to preferred shareholders. | |
| 2. Price-earnings ratio | Market expectations of future profitability. | |
| 3. Dividend yield ratio | The short-term cash return that can be expected from an investment in a company's shares. |