
12.2: Liquidity Ratios- Analyzing Short-term Cash Needs
- Page ID
- 98100

Current (Short-term) versus Non-current (Long-term) Debt
Short-term and long-term financing strategies both have their advantages. The advantage of some short-term debt (repayable within one year of the balance sheet date) is that it often does not require interest payments to creditors. For example, accounts payable may not require payment of interest if they are paid within the first 30 days they are outstanding. Short-term debt also has its disadvantages; payment is required within at least one year, and often sooner. Interest rates on short-term debt are often higher than on long-term debt. An increase in the proportion of short-term debt is more risky because it must be renewed and therefore renegotiated more frequently.
The advantages of long-term debt are that payment may be made over an extended period of time. Risk may be somewhat reduced through the use of a formal contractual agreement that is often lacking with short-term debt. The disadvantages of long-term debt are that interest payments must be made at specified times and the amounts owing may be secured by assets of the company.
Analyzing Financial Structure
As a general rule, long-term financing should be used to finance long-term assets. Note that in BDCC's case, property, plant, and equipment assets amount to $1,053,000 at December 31, 2021 yet the firm has no long-term liabilities. This is unusual. An analysis of the company's balance sheet reveals the following:
| (000s) | |||
| 2021 | 2020 | 2019 | |
| Current Liabilities | $1,255 | $917 | $369 |
| Non-current Liabilities | -0- | -0- | -0- |
2021 information indicates that BDCC's management relies solely on short-term creditor financing, part of which is $382,000 of accounts payable that may bear no interest and $825,000 of borrowings that also need to be repaid within one year. The risk is that management will likely need to replace current liabilities with new liabilities. If creditors become unwilling to do this, the ability of BDCC to pay its short-term creditors may be compromised. As a result, the company may experience a liquidity crisis — the inability to pay its current liabilities as they come due. The ratios used to evaluate liquidity of a corporation are discussed below.
Even though a company may be earning net income each year (as in BDCC's case), it may still be unable to pay its current liabilities as needed because of a shortage of cash. This can trigger various problems related to current and non-current liabilities and equity.
Current Liabilities
- Creditors can refuse to provide any further goods or services on account.
- Creditors can sue for payment.
- Creditors can put the company into receivership or bankruptcy.
Non-current Liabilities
- Long-term creditors can refuse to lend additional cash.
- Creditors can demand repayment of their long-term debts, under some circumstances.
Equity
- Shareholders may be unwilling to invest in additional share capital of the company.
- Shareholders risk the loss of their investments if the company declares bankruptcy.
There are several ratios that can be used to analyze the liquidity of a company.
Working Capital
Working capital is the difference between a company's current assets and current liabilities at a point in time. BDCC's working capital calculation is as follows:
| (000s) | ||||||
| 2021 | 2020 | 2019 | ||||
| Current Assets | ||||||
| Cash | $ | 20 | $ | 30 | $ | 50 |
| Short-term Investments | 36 | 31 | 37 | |||
| Accounts Receivable | 544 | 420 | 257 | |||
| Inventories | 833 | 503 | 361 | |||
| Total Current Assets (a) | 1,433 | 984 | 705 | |||
| Current Liabilities | ||||||
| Borrowings | 825 | 570 | 100 | |||
| Accounts Payable | 382 | 295 | 219 | |||
| Income Taxes Payable | 48 | 52 | 50 | |||
| Total Current Liabilities (b) | 1,255 | 917 | 369 | |||
| Net Working Capital (a-b) | $ | 178 | $ | 67 | $ | 336 |
In the schedule above, working capital amounts to $178,000 at December 31, 2021. Between 2019 and 2021, working capital decreased by $158,000 ($336,000 – 178,000). BDCC is less liquid in 2021 than in 2019, though its liquidity position has improved since 2020 when it was only $67,000.
In addition to calculating an absolute amount of working capital, ratio analysis can also be used. The advantage of a ratio is that it is usually easier to interpret.
Current Ratio
Is BDCC able to repay short-term creditors? The current ratio can help answer this question. It expresses working capital as a proportion of current assets to current liabilities and is calculated as:
![]()
The relevant BDCC financial data required to calculate this ratio is taken from the balance sheet, as follows:
| (000s) | ||||
| 2021 | 2020 | 2019 | ||
| Current Assets | (a) | $1,433 | $984 | $705 |
| Current Liabilities | (b) | 1,255 | 917 | 369 |
| Current Ratio | (a/b) | 1.14:1 | 1.07:1 | 1.91:1 |
This ratio indicates how many current asset dollars are available to pay current liabilities at a point in time. The expression "1.14:1" is read, "1.14 to 1." In this case it means that at December 31, 2021, $1.14 of current assets exist to pay each $1 of current liabilities. This ratio is difficult to interpret in isolation. There are two types of additional information that could help. First, what is the trend within BDCC over the last three years? The ratio declined between 2019 and 2020 (from 1.91 to 1.07), then recovered slightly between the end of 2020 and 2021 (from 1.07 to 1.14). The overall decline may be a cause for concern, as it indicates that in 2021 BDCC had fewer current assets to satisfy current liabilities as they became due.
A second interpretation aid would be to compare BDCC's current ratio to a similar company or that of BDCC's industry as a whole. Information is available from various trade publications and business analysts' websites that assemble financial ratio information for a wide range of industries.
Some analysts consider that a corporation should maintain a 2:1 current ratio, depending on the industry in which the firm operates. The reasoning is that, if there were $2 of current assets to pay each $1 of current liabilities, the company should still be able to pay its current liabilities as they become due, even in the event of a business downturn. However, it is recognized that no one current ratio is applicable to all entities; other factors — such as the composition of current assets — must also be considered to arrive at an acceptable ratio. This is illustrated below.
Composition of Specific Items in Current Assets
In the following example, both Corporation A and Corporation B have a 2:1 current ratio. Are the companies equally able to repay their short-term creditors?
| Corp. A | Corp. B | |||
| Current Assets | ||||
| Cash | $ | 1,000 | $ | 10,000 |
| Accounts Receivable | 2,000 | 20,000 | ||
| Inventories | 37,000 | 10,000 | ||
| Total Current Assets | $ | 40,000 | $ | 40,000 |
| Current Liabilities | $ | 20,000 | $ | 20,000 |
| Current Ratio | 2:1 | 2:1 | ||
The companies have the same dollar amounts of current assets and current liabilities. However, they have different short-term debt paying abilities because Corporation B has more liquid current assets than does Corporation A. Corporation B has less inventory ($10,000 vs. $37,000) and more in cash and accounts receivable. If Corporation A needed more cash to pay short-term creditors quickly, it would have to sell inventory, likely at a lower-than-normal gross profit. So, Corporation B is in a better position to repay short-term creditors.
Since the current ratio doesn't consider the components of current assets, it is only a rough indicator of a company's ability to pay its debts as they become due. This weakness of the current ratio is partly remedied by the acid-test ratio discussed below.
Acid-Test Ratio
A more rigid test of liquidity is provided by the acid-test ratio; also called the quick ratio. To calculate this ratio, current assets are separated into quick current assets and non-quick current assets.
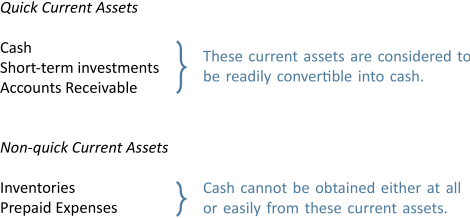
Inventory and prepaid expenses cannot be converted into cash in a short period of time, if at all. Therefore, they are excluded in the calculation of this ratio. The acid-test ratio is calculated as:
The BDCC information required to calculate this ratio is:
| (000s) | |||||||
| 2021 | 2020 | 2019 | |||||
| Cash | $ | 20 | $ | 30 | $ | 50 | |
| Short-term investments | 36 | 31 | 37 | ||||
| Accounts receivable | 544 | 420 | 257 | ||||
| Quick current assets | (a) | $ | 600 | $ | 481 | $ | 344 |
| Current liabilities | (b) | $ | 1,255 | $ | 917 | $ | 369 |
| Acid-test ratio | (a/b) | 0.48:1 | 0.52:1 | 0.93:1 | |||
This ratio indicates how many quick asset dollars exist to pay each dollar of current liabilities. What is an adequate acid-test ratio? It is generally considered that a 1:1 acid test ratio is adequate to ensure that a firm will be able to pay its current obligations. However, this is a fairly arbitrary guideline and is not appropriate in all situations. A lower ratio than 1:1 can often be found in successful companies. However, BDCC's acid-test ratio trend is worrisome.
There were $0.48 of quick assets available to pay each $1 of current liabilities in 2021. This amount appears inadequate. In 2020, the acid-test ratio of $0.52 also seems to be too low. The 2019 ratio of $0.93 is less than 1:1 but may be reasonable. Of particular concern to financial analysts would be BDCC's declining trend of the acid-test ratio over the three years.
Additional analysis can also be performed to determine the source of liquidity issues. These are discussed next.
Accounts Receivable Collection Period
Liquidity is affected by management decisions related to trade accounts receivable. Slow collection of receivables can result in a shortage of cash to pay current obligations. The effectiveness of management decisions relating to receivables can be analyzed by calculating the accounts receivable collection period.
The calculation of the accounts receivable collection period establishes the average number of days needed to collect an amount due to the company. It indicates the efficiency of collection procedures when the collection period is compared with the firm's sales terms (in BDCC's case, the sales terms are net 30 meaning that amounts are due within 30 days of the invoice date).
The accounts receivable collection period is calculated as:
![]()
The BDCC financial information required to make the calculation is shown below (the 2019 calculation cannot be made because 2018 Accounts Receivable amount is not available). Assume all of BDCC's sales are on credit.
| (000s) | |||
| 2021 | 2020 | ||
| Net credit sales | (a) | $3,200 | $2,800 |
| Average accounts receivable | |||
| [(Opening balance + closing balance)/2] | (b) | $ 4823 | $ 338.54 |
| Average collection period | |||
| [(b/a) |
54.98 days | 44.13 days | |
When Big Dog's 30-day sales terms are compared to the 54.98-day collection period, it can be seen that an average 24.98 days of sales (54.98 days – 30 days) have gone uncollected beyond the regular credit period in 2021. The collection period in 2021 is increasing compared to 2020. Therefore, some over-extension of credit and possibly ineffective collection procedures are indicated by this ratio. Quicker collection would improve BDCC's cash position. It may be that older or uncollectible amounts are buried in the total amount of receivables; this would have to be investigated.
Whether the increase in collection period is good or bad depends on several factors. For instance, more liberal credit terms may generate more sales (and therefore profits). The root causes of the change in the ratio need to be investigated. However, the calculation does provide an indication of the change in effectiveness of credit and collection procedures between 2020 and 2021.
Number of Days of Sales in Inventory
The effectiveness of management decisions relating to inventory can be analyzed by calculating the number of days of sales that can be serviced by existing inventory levels.
The number of days of sales in inventory is calculated by dividing average inventory by the cost of goods sold and multiplying the result by 365 days.
![]()
The BDCC financial data for 2020 and 2021 required to calculate this ratio are shown below.
| (000s) | |||
| 2021 | 2020 | ||
| Cost of goods sold | (a) | $2,500 | $2,150 |
| Average inventory | |||
| [(Opening balance + closing balance)/2] | (b) | $ 6685 | $ 4326 |
| Cost of goods sold | 365 | 365 | |
| Number of days sales in inventory | |||
| [(b/a) |
97.53 days | 73.34 days | |
The calculation indicates that BDCC is investing more in inventory in 2021 than in 2020 because there are 97.53 days of sales in inventory in 2021 versus 73.34 days in 2020. BDCC has approximately 3 months of sales with its existing inventory (98 days represents about 3 months). The increase from 2020 to 2021 may warrant investigation into its causes.
A declining number of days of sales in inventory is usually a sign of good inventory management because it indicates that the average amount of assets tied up in inventory is lessening. With lower inventory levels, inventory-related expenses such as rent and insurance are lower because less storage space is often required. However, lower inventory levels can have negative consequences since items that customers want to purchase may not be in inventory resulting in lost sales.
Increasing days of sales in inventory is usually a sign of poor inventory management because an excessive investment in inventory ties up cash that could be used for other purposes. Increasing levels may indicate that inventory is becoming obsolete (consider clothing) or deteriorating (consider perishable groceries). Obsolete and/or deteriorating inventories may be unsalable. However, the possible positive aspect of more days of sales in inventory is that there can be shorter delivery time to customers if more items are in stock.
Whether Big Dog's increasing days of sales in inventory is positive or negative depends on management's objectives. Is management increasing inventory to provide for increased sales in the next year, or is inventory being poorly managed? Remember that ratio analyses identify areas that require investigation. The resulting investigation will guide any required action.
The Revenue Portion of the Operating Cycle
As discussed in Chapter 4, the sale of inventory and resulting collection of receivables are part of a business's operating cycle as shown in Figure 12.1.
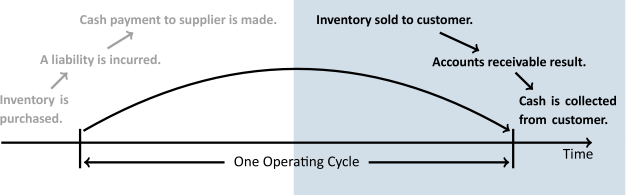
A business's revenue operating cycle is a subset of the operating cycle and includes the purchase of inventory, the sale of inventory and creation of an account receivable, and the generation of cash when the receivable is collected. The length of time it takes BDCC to complete one revenue operating cycle is an important measure of liquidity and can be calculated by adding the number of days of sales in inventory plus the number of days it takes to collect receivables. The BDCC financial data required for this calculation follows.
| 2021 | 2020 | |
| Average number of days of sales in inventory | 97.53 days | 73.34 days |
| Average number of days to collect receivables | 54.98 days | 44.13 days |
| Number of days to complete the revenue cycle | 152.51 days | 117.47 days |
In 2021, 152.51 days were required to complete the revenue cycle, compared to 117.47 days in 2020. So, if accounts payable terms require payment within 60 days, BDCC may not be able to pay them because the number of days to complete the revenue cycle for both 2020 (117.47 days) and 2021 (152.51 days) are significantly greater than 60 days.
Analysis of BDCC's Liquidity
Reflecting on the results of all the liquidity ratios, it appears that Big Dog Carworks Corp. is growing less liquid. Current assets, especially quick assets, are declining relative to current liabilities. The revenue operating cycle is increasing.