
8.6: Portfolio Planning and Corporate-Level Strategy
- Page ID
- 53998

Executives in charge of firms involved in many different businesses must figure out how to manage such portfolios. General Electric (GE), for example, competed in a very wide variety of industries, including financial services, insurance, television, theme parks, electricity generation, lightbulbs, robotics, medical equipment, railroad locomotives, and aircraft jet engines. When leading a company such as GE, executives must decide which units to grow, which ones to shrink, and which ones to abandon.
Portfolio planning can be a useful tool. Portfolio planning is a process that helps executives assess their firms’ prospects for success within each of its industries, offers suggestions about what to do within each industry, and provides ideas for how to allocate resources across industries. Portfolio planning first gained widespread attention in the 1970s, and it remains a popular tool among executives today.
The Boston Consulting Group Matrix
The Boston Consulting Group (BCG) Matrix is the best-known approach to portfolio planning (Table 8.5). Using the matrix requires a firm’s businesses to be categorized as high or low along two dimensions: its share of the market and the growth rate of its industry. The BCG Matrix has four quadrants or categories:
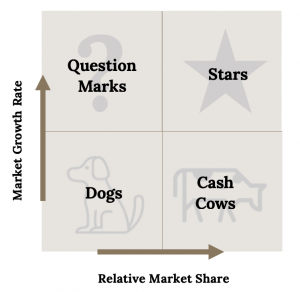
- Cash Cows: High market share units within slow-growing industries are called cash cows. Because their industries have bleak prospects, profits from cash cows should not be invested back into cash cows but rather diverted to more promising businesses.
- Dogs: Low market share units within slow-growing industries are called dogs. These units are good candidates for divestment.
- Stars: High market share units within fast-growing industries are called stars. These units have bright prospects and thus are good candidates for growth.
- Question Marks: Finally, low-market-share units within fast-growing industries are called question marks. Executives must decide whether to build these units into stars, hold them, or to divest them.
Figure 8.12 shows how the BCG Matrix is laid out. The various business units that a company has are plotted on the matrix. Once plotted, decisions can be made about the portfolio of businesses the company operates, such as where more investment would be beneficial, and which units may be candidates to divest.
The Boston Consulting Group matrix is the best-known approach to portfolio planning—assessing a firm’s prospects for success within the industries in which it competes. The matrix categorizes businesses as high or low along two dimensions—the firm’s market share in each industry and the growth rate of each industry. Suggestions are then offered about how to approach each industry.
| Low Relative Market Share | High Relative Market Share | |
| High Industry Growth Rate | Question marks should be resolved by executives by deciding whether to foster or sell these units. | Stars should be funded and encouraged to grow. |
| Low Industry Growth Rate | It sounds mean, but dogs should be sold if possible and abandoned if necessary. | Cash cows should be “milked” to supply funds to more promising businesses. |

To use the BCG Matrix, the company needs to know the market share for each of its business lines and the relative growth rate. It is important to set the scales on both axes so that the midpoints are roughly in the middle of the range of the market share and growth rates of the business units. Once the axes are set, the business units are plotted on the matrix relative to each other. Figure 8.14 shows a BCG Matrix for the Coca-Cola company and its various products. Notice that sometimes the market share axis is reversed, as it is in Figure 8.12.
Sometimes a third dimension is plotted on the BCG Matrix, using the size of the circle. The circle sizes might represent the business units’ proportion of total company revenues or proportion of total company profit generated. This added dimension can assist in decision making regarding the business units. For example, if a business unit in the Dog quadrant also represents 40% of the company’s revenue and 35% of its profit, divesting it would mean a significant downsizing of the company with implications for many other support functions.
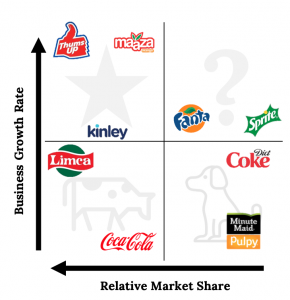
Once plotted, company leadership can evaluate its portfolio and make decisions on how to optimize its company. For example, in Figure 8.13, the two products in the Cash Cow quadrant have little opportunity for growth, given the socio-cultural force toward more healthy foods. Since they already have a high market share, it may be best to use their profits to invest in other business lines with more growth and market share potential. The products in the Question Marks and Dogs categories also are impacted by the trend toward healthy eating, so investment there is questionable. Usually, if investment in Question Marks can result in greater market share, it can be a wise move. Dogs are sometimes considered for divestment, however, Diet Coke has such high revenues and profit margins, divesting it would have a negative impact on the company. Investing in the Stars, where Kinley water products leverage the trend toward healthy beverages, and Thumbs Up is booming in India, would be a good decision.
Limitations to Portfolio Planning
Although portfolio planning is a useful tool, this tool has important limitations. First, portfolio planning oversimplifies the reality of competition by focusing on just two dimensions when analyzing a company’s operations within an industry. Many dimensions are important to consider when making strategic decisions, not just two. Second, portfolio planning can create motivational problems among employees. For example, if workers know that their firm’s executives believe in the BCG Matrix and that their subsidiary is classified as a dog, then they may give up any hope for the future. Similarly, workers within cash cow units could become dismayed once they realize that the profits that they help create will be diverted to boost other areas of the firm. Third, portfolio planning does not help identify new opportunities. Because this tool only deals with existing businesses, it cannot reveal what new industries a firm should consider entering.
Key Takeaway
- Portfolio planning is a useful tool for analyzing a firm’s various business units, but this tool has limitations. The BCG matrix is one of the most widely used approaches to portfolio planning.
Exercises
- Is market share a good dimension to use when analyzing the prospects of a business? Why or why not?
- What might executives do to keep employees within dog units motivated and focused on their jobs?
Image Credits
Figure 8.12: Kindred Grey (2020). “The BCG Matrix.” CC BY-SA 4.0. Retrieved from: https://commons.wikimedia.org/wiki/File:The_BCG_Matrix.png.
Figure 8.13: Kriz, Jonathan. “Puppy.” CC BY 2.0. Retrieved from https://flic.kr/p/8SUChJ.
Figure 8.14: Kindred Grey (2020). “BCG Matrix examples with CocaCola.” CC BY-SA 4.0. Retrieved from: https://commons.wikimedia.org/wiki/File:BCG_Matrix_examples_with_CocaCola.png Adapted from: https://image.slidesharecdn.com/cokers-151203095234-lva1-app6892/95/coke-15-638.jpg?cb=1449136402.