
5.2: Cost Behavior Patterns
- Page ID
- 859
- Identify typical cost behavior patterns.
Question: To predict what will happen to profit in the future at Bikes Unlimited, we must understand how costs behave with changes in the number of units sold (sales volume). Some costs will not change at all with a change in sales volume (e.g., monthly rent for the production facility). Some costs will change with a change in sales volume (e.g., materials for the mountain bikes). What are the three cost behavior patterns that help organizations identify which costs will change and which will remain the same with changes in sales volume?
- Answer
-
The three basic cost behavior patterns are known as variable, fixed, and mixed. Each of these cost patterns is described next.
Variable Costs
Question: We know that some costs vary with changes in activity. What do we call this type of cost behavior?
- Answer
-
This cost behavior pattern is called a variable cost. A variable cost1 describes a cost that varies in total with changes in volume of activity. The activity in this example is the number of bikes produced and sold. However, the activity can take many different forms depending on the organization. The two most common variable costs are direct materials and direct labor. Other examples include indirect materials and energy costs.
Assume the cost of direct materials (wheels, seats, frames, and so forth) for each bike at Bikes Unlimited is $40. If Bikes Unlimited produces one bike, total variable cost for direct materials amounts to $40. If Bikes Unlimited doubles its production to two bikes, total variable cost for direct materials also doubles to $80. Variable costs typically change in proportion to changes in volume of activity. If volume of activity doubles, total variable costs also double, while the cost per unit remains the same. It is important to note that the term variable refers to what happens to total costs with changes in activity, not to the cost per unit.
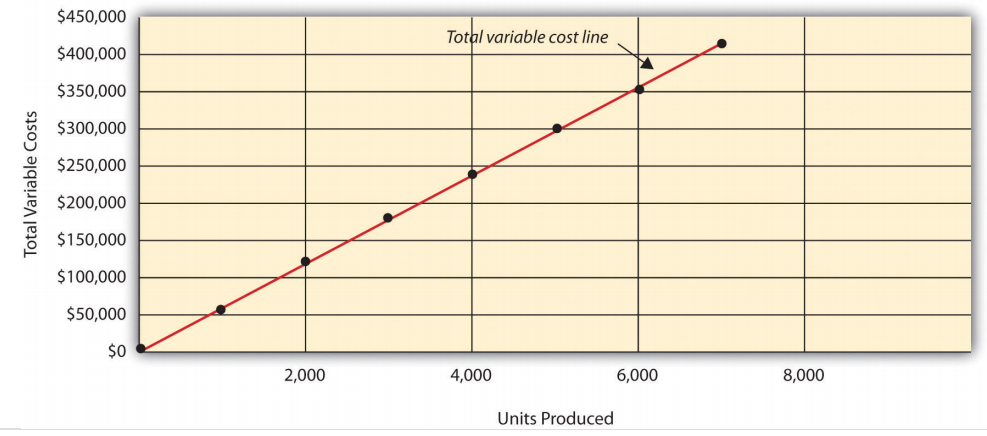
Taking it one step further for Bikes Unlimited, let’s consider all variable costs related to production. Assume direct materials, direct labor, and all other variable production costs amount to $60 per unit. Table 5.1 provides the total and per unit variable costs at three different levels of production, and Figure 5.1 graphs the relation of total variable costs (y-axis) to units produced (x-axis). Note that the slope of the line represents the variable cost per unit of $60 (slope = change in variable cost ÷ change in units produced).
| Units Produced | Total Variable Costs | Per Unit Variable Cost |
|---|---|---|
| 1 | $ 60 | $60 |
| 2,000 | $120,000 | $60 |
| 4,000 | $240,000 | $60 |
Using Different Activities to Measure Variable Costs
Question: At Bikes Unlimited, it is reasonable to assume that the activity, number of units produced, will affect total variable costs for direct materials and direct labor. However, companies often use a different activity to estimate total variable costs. What types of activities might be used to estimate variable costs?
- Answer
-
The type of activity used to estimate variable costs depends on the cost. For example, a law firm might use the number of labor hours to estimate labor costs. An airline such as American Airlines might use hours of flying time to estimate fuel costs. A mail delivery service such as UPS might use the number of packages processed to estimate labor costs associated with sorting packages. A retail store such as Best Buy might use sales dollars to estimate cost of goods sold.
Variable costs are affected by different activities depending on the organization. The goal is to find the activity that causes the variable cost so that accurate cost estimates can be made.
Fixed Costs
Question: Costs that vary in total with changes in activity are called variable costs. What do we call costs that remain the same in total with changes in activity?
- Answer
-
This cost behavior pattern is called a fixed cost. A fixed cost2 describes a cost that is fixed (does not change) in total with changes in volume of activity. Assuming the activity is the number of bikes produced and sold, examples of fixed costs include salaried personnel, building rent, and insurance.
Assume Bikes Unlimited pays $8,000 per month in rent for its production facility. In addition, insurance for the same building is $2,000 per month and salaried production personnel are paid $6,000 per month. All other fixed production costs total $4,000. Thus Bikes Unlimited has total fixed costs of $20,000 per month related to its production facility (= $8,000 + $2,000 + $6,000 + $4,000). If only one bike is produced, Bikes Unlimited still must pay $20,000 per month. If 5,000 bikes are produced, Bikes Unlimited still pays $20,000 per month. The fixed costs remain unchanged in total as the level of activity changes.
Question: What happens to fixed costs on a per unit basis as production levels change?
- Answer
-
If Bikes Unlimited only produces one bike, the fixed cost per unit would amount to $20,000 (= $20,000 total fixed costs ÷ 1 bike). If Bikes Unlimited produces two bikes, the fixed cost per unit would be $10,000 (= $20,000 ÷ 2 bikes). As activity increases, the fixed costs are spread out over more units, which results in a lower cost per unit.
Table 5.2 provides the total and per unit fixed costs at three different levels of production, and Figure 5.2 graphs the relation of total fixed costs (y-axis) to units produced (x-axis). Note that regardless of the activity level, total fixed costs remain the same.
Table 5.3 - Mixed Cost Behavior for Bikes Unlimited Units Produced Total Fixed Costs Per Unit Fixed Cost 1 $20,000 $20,000 2,000 $20,000 $10 4,000 $20,000 $5 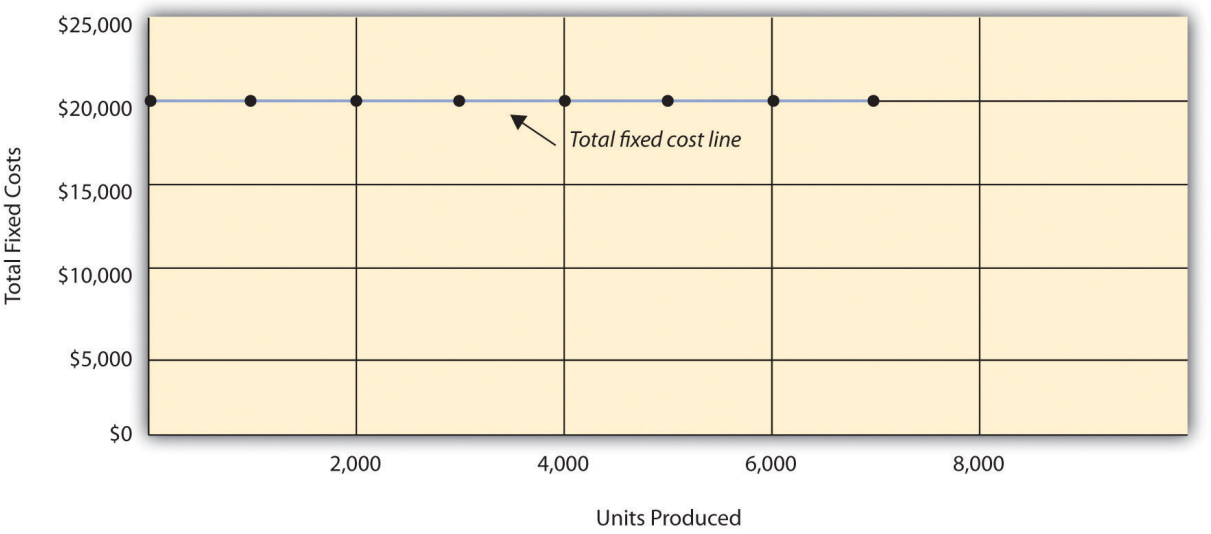
Figure \(\PageIndex{2}\): Total Fixed Production Costs for Bikes Unlimited
United Airlines is the second largest air carrier in the world. It has hubs in Chicago, Denver, Los Angeles, San Francisco, and New York and flies to 109 destinations in 23 countries. Destinations include Tokyo, London, and Frankfurt.
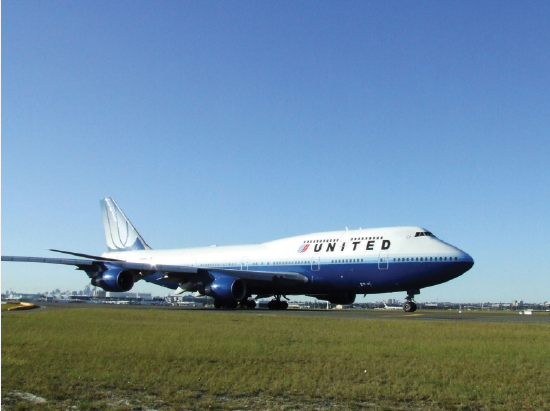
Source: Photo courtesy of Simon_sees, http://www.flickr.com/photos/39551170@N02/3696524201/.
Back in 2002, United filed for bankruptcy. Industry analysts reported that United had relatively high fixed costs, making it difficult for the company to cut costs quickly in line with its reduction in revenue. A few years later, United emerged from bankruptcy, and in 2010 merged with Continental Airlines. Although financial information was presented separately for each company (United and Continental) in 2010, both companies are now owned by United Continental Holdings, Inc. The following financial information for United Airlines is from the company’s income statement for the year ended December 31, 2010 (amounts are in millions). Review this information carefully. Which costs are likely to be fixed?
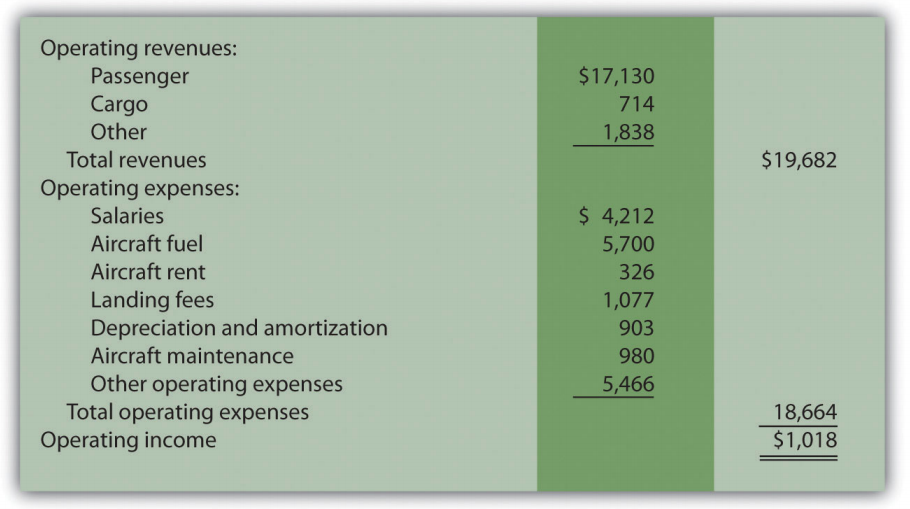
Although we cannot identify all fixed costs with certainty, several costs likely fall into this category: salaries (for union employees, such as pilots, flight crews, and mechanics); aircraft fuel (assuming flights are not easily canceled); aircraft rent; and depreciation. These costs total $11.1 billion, or 60 percent of total operating expenses (rounded). Fixed costs are clearly a large component of total operating expenses, which makes it difficult for airline companies like United Airlines to make short-term cuts in expenses when revenue declines.
Source: United Continental, Inc., form 10K for 2010.
Committed Versus Discretionary Fixed Costs
Question: Organizations often view fixed costs as either committed or discretionary. What is the difference between these two types of fixed costs?
- Answer
-
A committed fixed cost3 is a fixed cost that cannot easily be changed in the short run without having a significant impact on the organization. For example, assume Bikes Unlimited has a five-year lease on the company’s production facility, which costs $8,000 per month. This is a committed fixed cost because the lease cannot easily be broken, and the company is committed to using this facility for years to come. Other examples of committed fixed costs include salaried employees with long-term contracts, depreciation on buildings, and insurance.
A discretionary fixed cost4 is a fixed cost that can be changed in the short run without having a significant impact on the organization. For example, assume Bikes Unlimited contributes $10,000 each year toward charitable organizations. Management has the option of changing this amount in the short run without causing a significant impact on the organization. Other examples of discretionary fixed costs include advertising, research and development, and training programs (although an argument can be made that reducing these expenditures could have a significant impact on the company depending on the amount of the cuts).
In general, management looks to cut discretionary fixed costs when sales and profits are declining, since cuts in this area tend not to have as significant an impact on the organization as cutting committed fixed costs. Difficulties arise when struggling organizations go beyond cutting discretionary fixed costs and begin looking at cutting committed fixed costs.
Mixed Costs
Question: We have now learned about two types of cost behavior patterns—variable costs and fixed costs. However, there is a third type of cost that behaves differently in that both total and per unit costs change with changes in activity. What do we call this type of cost?
- Answer
-
This cost behavior pattern is called a mixed cost. The term mixed cost5 describes a cost that has a mix of fixed and variable costs. For example, assume sales personnel at Bikes Unlimited are paid a total of $10,000 in monthly salary plus a commission of $7 for every bike sold. This is a mixed cost because it has a fixed component of $10,000 per month and a variable component of $7 per unit.
Table 5.3 provides the total and per unit fixed costs at three different levels of production, and Figure 5.3 graphs the relation of total mixed costs (y-axis) to units produced (x-axis). The point at which the line intersects the y-axis represents the total fixed cost ($10,000), and the slope of the line represents the variable cost per unit ($7).
Units Sold Total Mixed Costs Per Unit Mixed Cost 1 $10,007 $10,007.00 2,000 $24,000 $12.00 4,000 $38,000 $9.50 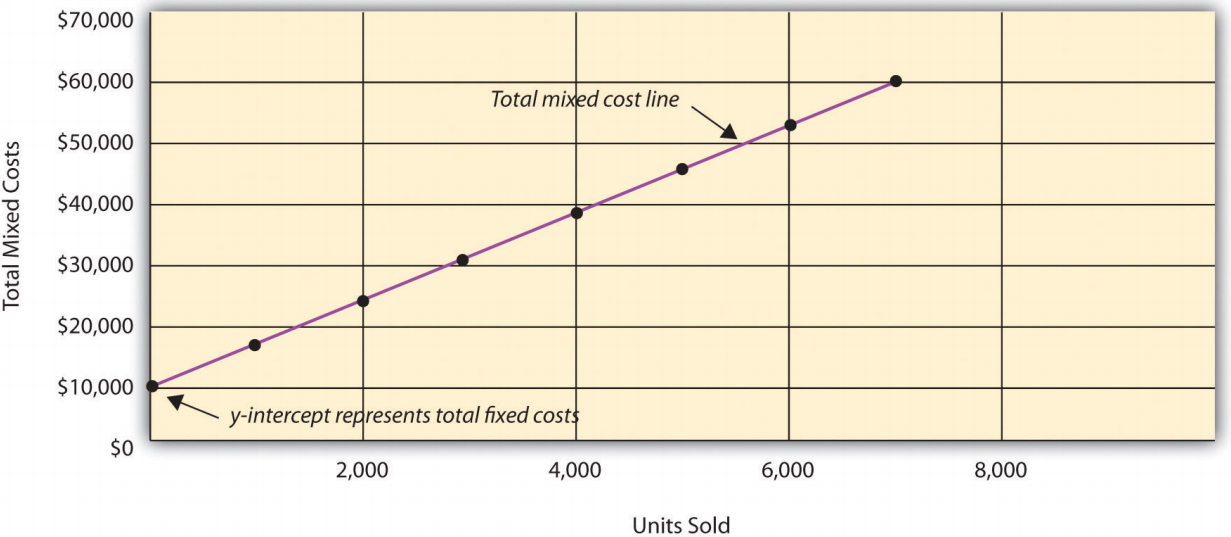
Figure \(\PageIndex{3}\): Total Mixed Sales Compensation Costs for Bikes Unlimited Because this cost is depicted with a straight line, we can use the equation for a straight line to describe a mixed cost:
\[\text{Total mixed cost} = \text{Total fixed cost} + \text{(Unit variable cost} \times \text{Number of units)}\]
or
\[\text{Y} = \mathcal{f} + \mathcal{v} \text{X}\]
where
\(\text{Y}\) = total mixed costs (this is the y-axis in Figure 5.3)
\(\mathcal{f}\) = total fixed costs
\(\mathcal{v}\) = variable cost per unit
\(\text{X}\) = level of activity (this is the x-axis in Figure 5.3)
For Bikes Unlimited, the mixed cost equation is Y = $10,000 + $7X. If Bikes Unlimited sells 4,000 bikes (X) in one month, the total mixed cost (Y) for sales personnel compensation would be $38,000 [= $10,000 + ($7 × 4,000 units)].
Short Term Versus Long Term and the Relevant Range
We now introduce two important concepts that must be considered when estimating costs: short term versus long term, and the relevant range.
Short Term Versus Long Term
Question: When identifying cost behavior patterns, we assume that management is using the cost information to make short-term decisions. Why is this short-term decision making assumption so important?
- Answer
-
Variable, fixed, and mixed cost concepts are useful for short-term decision making and therefore apply to a specific period of time. This short-term period will vary depending on the company’s current production capacity and the time required to change capacity. In the long term, all cost behavior patterns will likely change.
For example, suppose Bikes Unlimited’s production capacity is 8,000 units per month, and management plans to expand capacity in two years by renting a new production facility and hiring additional personnel. This is a long-term decision that will change the cost behavior patterns identified earlier. Variable production costs will no longer be $60 per unit, fixed production costs will no longer be $20,000 per month, and mixed sales compensation costs will also change. All these costs will change because the estimates are accurate only in the short term.
The Relevant Range
Question: Another important concept we use when estimating costs is called the relevant range. What is the relevant range and why is it so important when estimating costs?
- Answer
-
The relevant range6 is the range of activity for which cost behavior patterns are likely to be accurate. The variable, fixed, and mixed costs identified for Bikes Unlimited will only be accurate within a certain range of activity. Once the firm goes outside that range, cost estimates are not necessarily accurate and often must be reevaluated and recalculated.
For example, assume Bikes Unlimited’s mixed sales compensation costs of $10,000 per month plus $7 per unit is only valid up to 4,000 units per month. If unit sales increase beyond 4,000 units, management will hire additional salespeople and the total monthly base salary will increase beyond $10,000. Thus the relevant range for this mixed cost is from zero to 4,000 units. Once the company exceeds sales of 4,000 units per month, it is out of the relevant range, and the mixed cost must be recalculated.
We discuss the relevant range concept in more detail later in the chapter. For now, remember that the accuracy of cost behavior patterns is limited to a certain range of activity called the relevant range.
Using Excel to Create Charts
Managers typically use computer applications on a daily basis to perform a variety of functions. For example, they often use Excel to generate tables, graphs, and charts. You could use Excel to create the charts shown in Figure 5.1, Figure 5.2, and Figure 5.3. Here’s how:
- Enter the data. Open a new Excel document and enter the data in two columns: one column for the x-axis (horizontal axis), and one column for the y-axis (vertical axis). Let’s suppose you want to create the chart shown in Figure 5.1. In that case, the x-axis represents units produced, and the y-axis represents total variable costs. An excerpt from your Excel document would appear as follows:
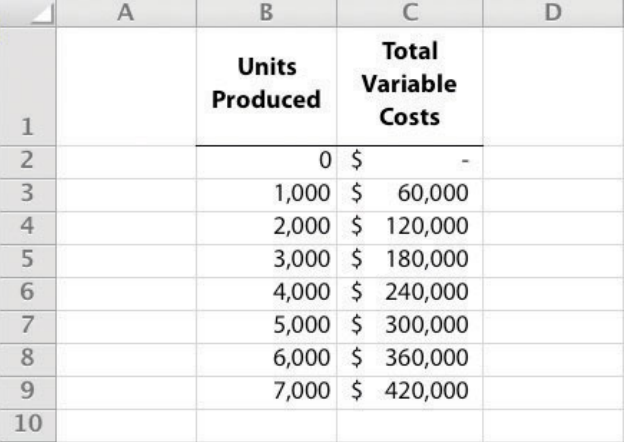
- Create the chart. After you have entered the data, highlight the appropriate data cells (including headings and labels) and click on Insert, Chart, Scatter. Choose Scatter with Smooth Lines and Markers. The chart that results is linked to your data points. If you change the data, the chart changes, too. (In earlier versions of Excel, the chart wizard walks you through the steps necessary to create the chart.)
- Format the chart. Now that you have created the chart, select it and use Chart Tools to format it with background shading, text inserts, font size, chart size, and other more advanced features. If you want to display the chart within some other document (e.g., a Word document), you can copy it (highlight the chart and select Edit, Copy from the menu bar) and paste it into the document (select Edit, Paste or Paste Special).
The Excel document created by following these three steps would look like the one shown in Figure 5.1.
How Cost Behavior Patterns Are Used
Question: How do managers use cost behavior patterns to make better decisions?
- Answer
-
Accurately predicting what costs will be in the future can help managers answer several important questions. For example, managers at Bikes Unlimited might ask the following:
- We expect to see a 5 percent increase in unit sales next year. How will this affect revenues and costs?
- We are applying for a loan with a bank, and bank managers think our sales estimates are high. What happens to our revenues and costs if we lower estimates by 20 percent?
- What happens to revenues and costs if we add a racing bike to our product line?
- How will costs behave in the future if we increase automation in the production process?
The only way to accurately predict costs is to understand how costs behave given changes in activity. To make good decisions, managers must know how costs are structured (fixed, variable, or mixed). The next section explains how to estimate fixed and variable costs, and how to identify the fixed and variable components of mixed costs.
Budget Cuts at an Elementary School District

© Thinkstock
A school district outside Sacramento, California, was faced with making budget cuts because of a reduction in state funding. To reduce costs, the school district’s administration decided to consider closing one of the smaller elementary schools in the district. According to an initial estimate, closing this school would reduce costs by $500,000 to $1,000,000 per year. However, further analysis identified only $100,000 to $150,000 in cost savings.
Why did the analysis yield lower savings than the initial estimate? Most of the costs were committed fixed costs (e.g., teachers’ salaries and benefits) and could not be eliminated in the short term. In fact, teachers and students at the school being considered for closure were to be moved to other schools in the district, and so no savings on teachers’ salaries and benefits would result. The only real short-term cost savings would be in not having to maintain the classrooms, computer lab, and library (nonunion employees would be let go) and in utilities (heat and air conditioning would be turned off).
The school district ultimately decided not to close the school because of the large committed fixed costs involved, as well as a lack of community support, and budget cuts were made in other areas throughout the district.
Sierra Company is trying to identify the behavior of the three costs shown in the following table. The following cost information is provided for six months. Calculate the cost per unit, and then identify how each cost behaves (fixed, variable, or mixed). Explain your answers.
| Cost 1 | Cost 2 | Cost 3 | |||||
|---|---|---|---|---|---|---|---|
| Month | Units Produced | Total Costs | Cost per Unit | Total Costs | Cost per Unit | Total Costs | Cost per Unit |
| 1 | 50 | $100 | $2.00 | $100 | $2.00 | $100 | $2.00 |
| 2 | 100 | $200 | $2.00 | $100 | $1.00 | $150 | $1.50 |
| 3 | 150 | $300 | $100 | $200 | |||
| 4 | 200 | $400 | $100 | $250 | |||
| 5 | 250 | $500 | $100 | $300 | |||
| 6 | 300 | $600 | $100 | $350 | |||
- Answer
-
As shown in the following table, cost 1 is a variable cost because as the number of units produced changes, total costs change (in proportion to changes in activity) and per unit cost remains the same. Cost 2 is a fixed cost because as the number of units produced changes, total costs remain the same and per unit costs change. Cost 3 is a mixed cost because as the number of units produced changes, total cost changes (but not in proportion to changes in activity) and per unit cost changes.
Cost 1 Cost 2 Cost 3 Month Units Produced Total Costs Cost per Unit Total Costs Cost per Unit (rounded) Total Costs Cost per Unit (rounded) 1 50 $100 $2.00 $100 $2.00 $100 $2.00 2 100 $200 $2.00 $100 $1.00 $150 $1.50 3 150 $300 $2.00 $100 $0.67 $200 $1.33 4 200 $400 $2.00 $100 $0.50 $250 $1.25 5 250 $500 $2.00 $100 $0.40 $300 $1.20 6 300 $600 $2.00 $100 $0.33 $350 $1.17
Definitions
- A cost that varies in total with changes in activity and remains constant on a per unit basis with changes in activity.
- A cost that remains constant in total with changes in activity and varies on a per unit basis with changes in activity.
- A fixed cost that cannot easily be changed in the short run without having a significant impact on the organization.
- A fixed cost that can be changed in the short run without having a significant impact on the organization.
- A cost that has a combination of fixed and variable costs.
- The range of activity for which the cost behavior patterns are likely to be accurate.