1.9: Income Statements for Manufacturing Companies
- Page ID
- 831
- Describe how to prepare an income statement for a manufacturing company.
Question: Companies that provide services, such as Ernst & Young (accounting) and Accenture LLP (consulting), do not sell goods and therefore have no inventory. The accounting process and income statement for service companies are relatively simple. Merchandising companies (also called retail companies) like Macy’s and Home Depot buy and sell goods but typically do not manufacture goods. Since merchandising companies must account for the purchase and sale of goods, their accounting systems are more complex than those of service companies. Manufacturing companies, such as Johnson & Johnson and Honda Motor Company, produce and sell goods. Such companies require an accounting system that goes well beyond accounting solely for the purchase and sale of goods. Why are accounting systems more complex for manufacturing companies?
- Answer
-
Accounting systems are more complex for manufacturing companies because they need a system that tracks manufacturing costs throughout the production process to the point at which goods are sold. Since income statements for manufacturing companies tend to be more complex than for service or merchandising companies, we devote this section to income statements for manufacturing companies. Understanding income statements in a manufacturing setting begins with the inventory cost flow equation.
Inventory Cost Flow Equation
Question: How do companies use the cost flow equation to calculate unknown balances?
- Answer
-
We can use the basic cost flow equation to calculate unknown balances for just about any balance sheet account (e.g., cash, accounts receivable, and inventory). The equation is as follows: $$Beginning balance (BB) + Transfers in (TI) – Ending balance (EB) = Transfers out (TO)$$We will apply this equation to the three inventory asset accounts discussed earlier (raw materials, work in process, and finished goods) to calculate the cost of raw materials used in production, cost of goods manufactured, and cost of goods sold.
Raw materials used in production shows the cost of direct and indirect materials placed into the production process. Cost of goods manufactured represents the cost of goods completed and transferred out of work-in-process (WIP) inventory into finished goods inventory. Cost of goods sold represents the cost of goods that are sold and transferred out of finished goods inventory into cost of goods sold.
Accountants need all these amounts—raw materials placed in production, cost of goods manufactured, and cost of goods sold—to prepare an income statement for a manufacturing company. We describe how to calculate these amounts using three formal schedules in the following order:
- Schedule of raw materials placed in production
- Schedule of cost of goods manufactured
- Schedule of cost of goods sold
Question: The basic cost flow equation can be used in three supporting schedules to help us determine the cost of goods sold amount on the income statement for manufacturing companies. What information is included in these schedules, and what do they look like for Custom Furniture Company?
- Answer
-
Figure 1.7 shows these three schedules for Custom Furniture Company for the month of May. As you review these schedules, note that each schedule provides information required for the next schedule, as indicated by the arrows. Remember the inventory cost flow equation is used for each schedule. This is why you see abbreviations for each element of the equation: beginning balance (BB), transfers in (TI), ending balance (EB), and transfers out (TO).
The goal of going through the process shown in Figure 1.7 is to arrive at a cost of goods sold amount, which is presented on the income statement. Custom Furniture Company’s income statement for the month ended May 31 is shown in Figure 1.8 . As you review Figure 1.7 and Figure 1.8 , look back at Figure 1.6 to see how costs flow through the three inventory accounts and the cost of goods sold account.
In Chapter 2, we provide the detailed information necessary to prepare the schedules and income statement presented in Figure 1.7 and Figure 1.8. At this point, your job is to understand how we use the inventory cost flow equation to calculate raw materials placed in production, cost of goods manufactured, and cost of goods sold. (Note: Companies using a perpetual inventory system do not necessarily prepare these formal schedules because perpetual systems update records immediately when inventory is transferred from one inventory account to another. However, these companies take a physical count periodically to ensure the accuracy of inventory accounts and use the cost flow equation and similar schedules to ensure their perpetual system balances are accurate. Note 1.62 "Business in Action 1.8" shows how the cost flow equation can be used to analyze the effects of fraud that was allegedly committed at Rite Aid.)
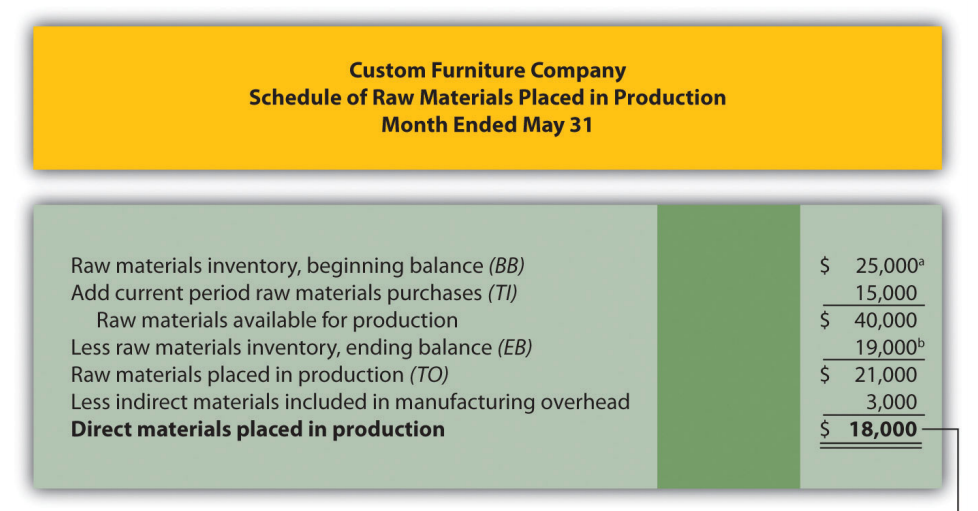

a From the company’s balance sheet at April 30 (April 30 ending balance is the same as May 1 beginning balance).
b From the company’s balance sheet at May 31.
c This is actual manufacturing overhead for the period and includes indirect materials, indirect labor, factory rent, factory utilities, and other factory-related expenses for the month. In Chapter 2, we look at an alternative approach to recording manufacturing overhead called normal costing.
Figure 1.7 - Income Statement Schedules for Custom Furniture Company
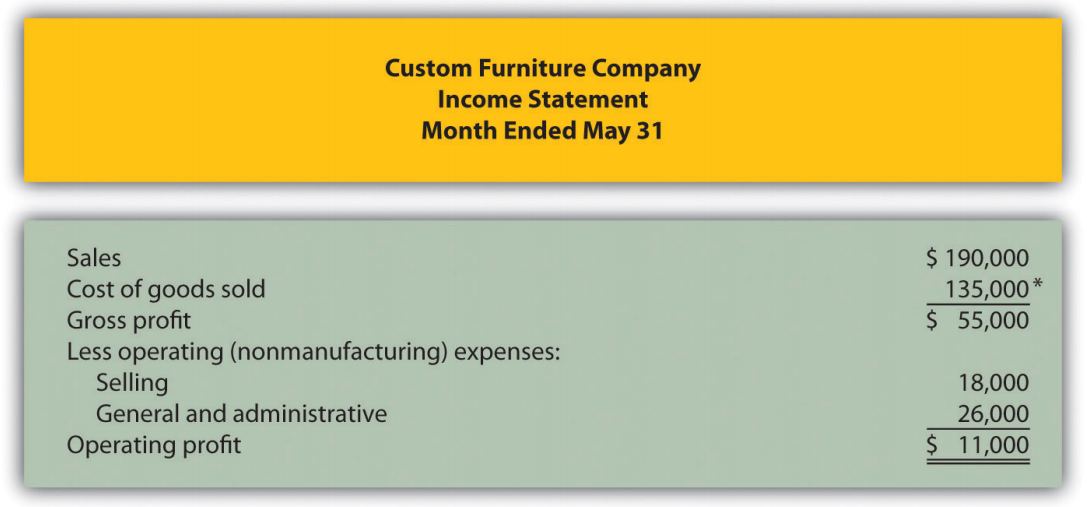
Figure 1.8 - Income Statement for Custom Furniture Company
Using the Cost Flow Equation to Analyze Fraud
Rite Aid Corporation operates 3,400 drug stores in the United States. In 2002, the Securities and Exchange Commission (SEC) filed accounting fraud charges against several former executives of Rite Aid. The SEC complaint alleged that Rite Aid had significantly overstated income for several years.
According to the complaint, Rite Aid executives committed financial fraud in several areas, one of which involved inventory. At the end of the company’s fiscal year, the physical inventory count showed $9,000,000 less than Rite Aid’s inventory balance on the books, presumably due to physical deterioration of the goods or theft. Rite Aid executives allegedly failed to record this shrinkage, thereby overstating ending inventory on the balance sheet and understating cost of goods sold on the income statement.
Using the cost flow equation, you can see how failing to record the $9,000,000 loss would understate cost of goods sold.
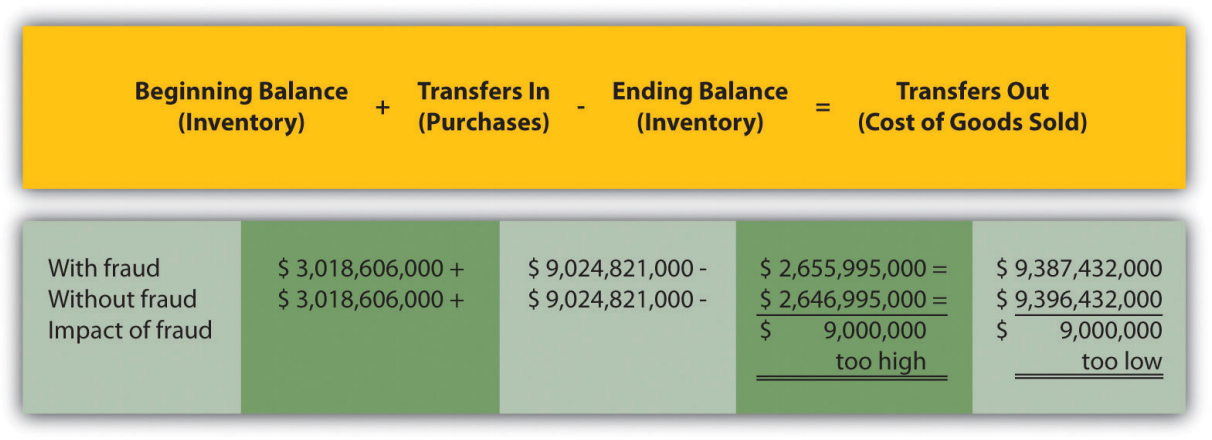
By failing to record the inventory loss, Rite Aid overstated inventory (an asset) on the balance sheet by $9,000,000 and understated cost of goods sold (an expense) by $9,000,000 on the income statement. This ultimately increased profit by $9,000,000 because reported expenses were too low.
This inventory fraud was a relatively small part of the fraud allegedly committed by Rite Aid executives. In fact, Rite Aid’s net income was restated downward by $1,600,000,000 in 2002. Several former executives pled guilty to conspiracy charges. The former chief executive, Martin Grass, was sentenced to eight years in prison and the former chief financial officer, Franklyn Bergonzi, was sentenced to 28 months in prison. Rite Aid’s stock fell from a high of $50 per share to $5 per share in 2003.
Sources: Securities and Exchange Commission, “Release 2002–92,” news release, http://www.sec.gov; AP wires dated July 10, 2003, and May 27, 2004.
Manufacturing Versus Merchandising Income Statements
Question: Manufacturing companies clearly have more complex accounting systems to account for all the costs involved in producing products. However, the income statement for a manufacturing company is not all that much different than the income statement for a merchandising company. What are primary differences between manufacturing and merchandising company income statements?
- Answer
-
The primary differences are as follows:
- Merchandising companies do not calculate the raw materials placed in production or cost of goods manufactured (shown in the top section of Figure 1.7).
- Merchandisers purchase goods from suppliers instead of manufacturing goods. The cost of these purchases from suppliers is often called net purchases in the income statement, in contrast to cost of goods manufactured in a manufacturer’s income statement. The net purchases line consists of purchases, purchases returns and allowances, purchases discounts, and freight in.
- Merchandisers do not use the schedule of cost of goods manufactured (and related schedule of raw materials placed in production).
- Merchandisers use an account called merchandise inventory, or simply inventory, instead of finished goods inventory. This reflects that merchandisers do not produce goods.
Table 1.5 summarizes the differences in income statement terminology between manufacturing companies and merchandising companies.
| The following terms are used by manufacturing and merchandising companies: sales, cost of goods available for sale, cost of goods sold, operating expenses, selling, general and administrative, and operating profit. | |
| Finished goods inventory is used by manufacturing companies. | Merchandise inventory is used by merchandising companies. |
| Cost of goods manufactured is used by manufacturing companies. | Net purchases is used by merchandising companies. |
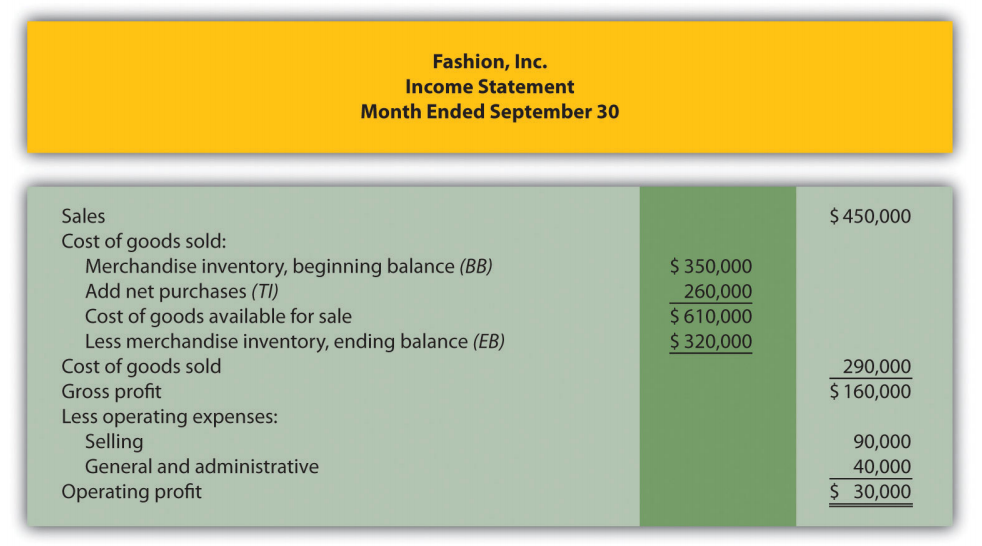
Figure 1.9 presents an income statement for Fashion, Inc., a retail company that sells clothing. Notice that the schedule of cost of goods manufactured (and related schedule of raw materials placed in production) is not needed for merchandising companies, and the terms merchandise inventory and net purchases are used instead of finished goods inventory and cost of goods manufactured. Also, the schedule of cost of goods sold is simply included in the income statement. Many companies prefer this approach because it means they do not have to prepare a separate schedule.
Three schedules are necessary to prepare an income statement for a manufacturing company, in the following order:
- Schedule of raw materials placed in production, which shows cost of direct materials added to work-in-process inventory and cost of indirect materials added to manufacturing overhead
- Schedule of cost of goods manufactured, which shows cost of goods completed and transferred out of work-in-process inventory into finished goods inventory
- Schedule of cost of goods sold, which shows cost of goods sold and transferred out of finished goods inventory into cost of goods sold
The income statements of merchandising companies differ from those of manufacturing companies in several areas. Merchandising companies do not use a schedule of raw materials placed in production or a schedule of cost of goods manufactured, and they use a merchandise inventory account instead of a finished goods inventory account. In addition, they use the term net purchases instead of cost of goods manufactured and often include the schedule of cost of goods sold in the income statement rather than presenting it separately.
Fine Cabinets, Inc., produces custom cabinets. The following inventory balances appeared on its balance sheet. (Note that the most current financial information is presented in the first column.)
| December 31, 2012 | December 31, 2012 | |
| Raw materials inventory | $ 8,000 | $ 10,000 |
| Work-in-process inventory | $ 600,000 | $ 550,000 |
| Finished goods inventory | $ 350,000 | $ 410,000 |
Fine Cabinets had $1,265,000 in sales for the year ended December 31, 2012. The company also had the following costs for the year:
| Selling | $ 90,000 |
| General and administrative | $240,000 |
| Raw materials purchases | $100,000 |
| Direct labor used in production | $125,000 |
| Manufacturing overhead | $630,000 |
Of the total raw materials placed in production for the year, $12,000 was for indirect materials and must be deducted to find direct materials placed in production.
Required:
- Prepare the schedules listed in the following for the year ended December 31, 2012. Use the format shown in Figure 1.7 . (Note that Figure 1.7 shows information for a month and this review problem presents information for a year.)
- Schedule of raw materials placed in production
- Schedule of cost of goods manufactured
- Schedule of cost of goods sold
- Prepare an income statement for the year ended December 31, 2012. Use the format shown in Figure 1.8.
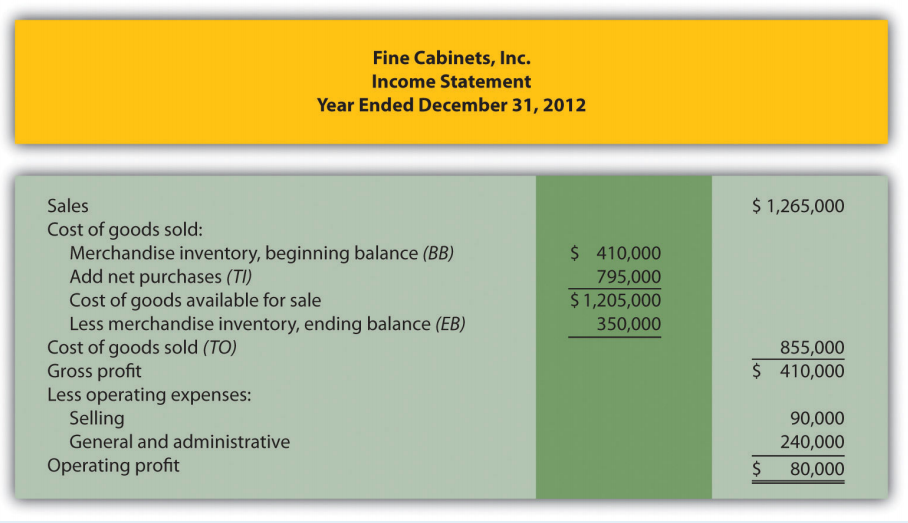
- Assume Fine Cabinets, Inc., is a merchandising company that purchases its cabinets from a manufacturer. Use the information from the schedule of cost of goods sold prepared in requirement 1 and the income statement prepared in requirement 2 to prepare an income statement. Use the format shown in Figure 1.9.
- Answer
-
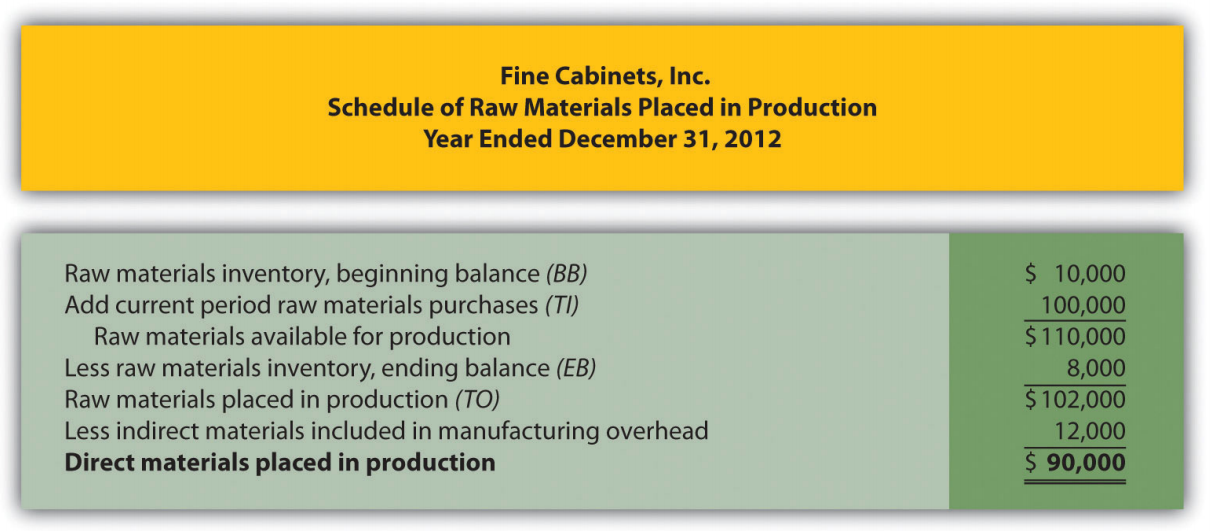
Figure \(\PageIndex{1}\): .8.2.png" /> *$90,000 comes from the direct materials placed in production in part 1a
1.3)
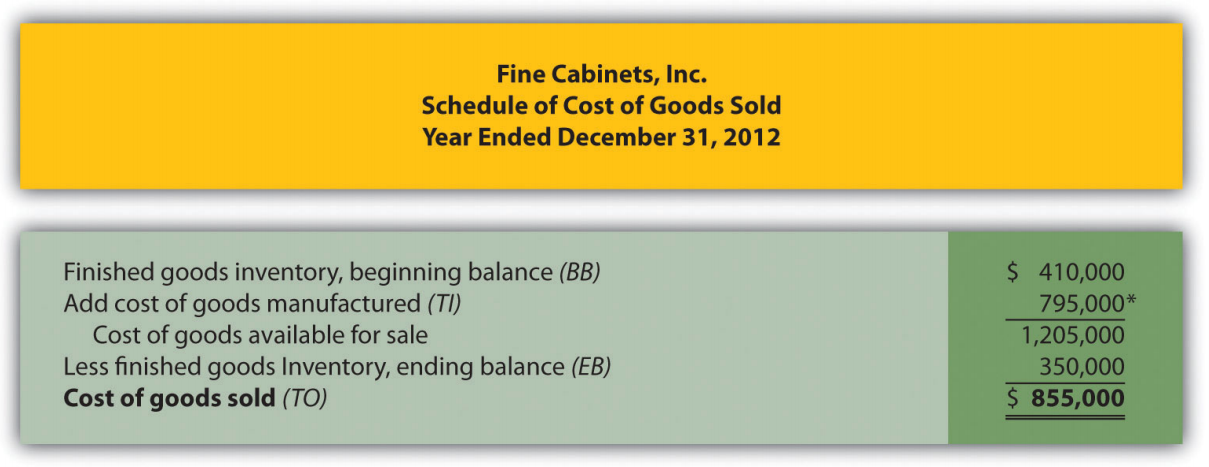
*$795,000 comes from the cost of goods manufactured (TO) in part 1b.
1.4)
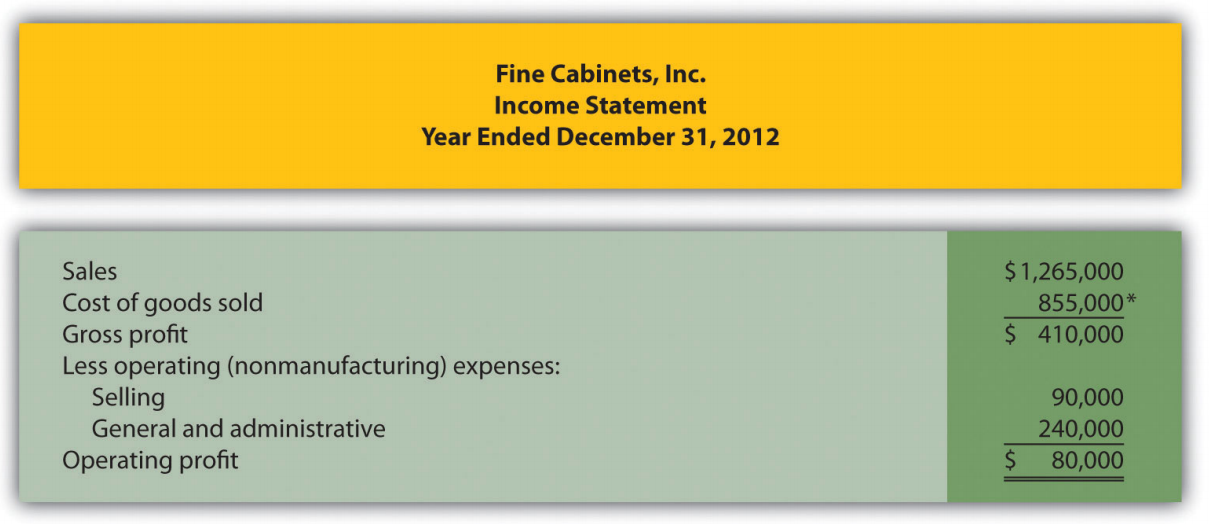
*$855,000 comes from the cost of goods sold (TO) in part 1c.
1.5)