
10.22.2: Implications for Monetary Policy
- Page ID
- 59654
- In the short term, what is the difference between monetary and fiscal stimulus and why is it important?
- What happens when the IS-LM model is used to tackle the long term by taking changes in the price level into account?
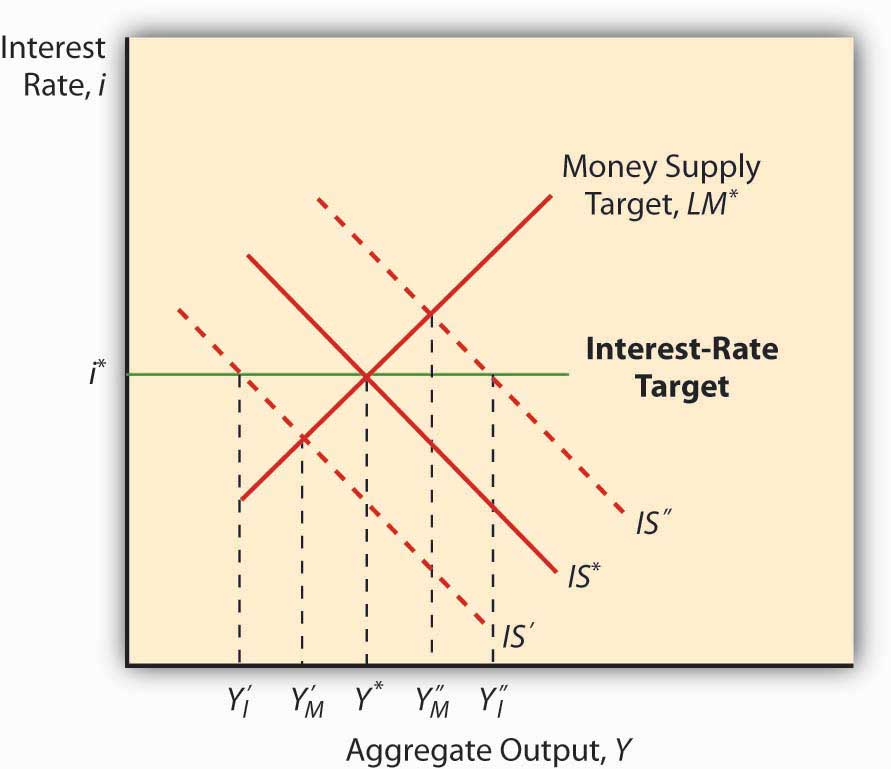
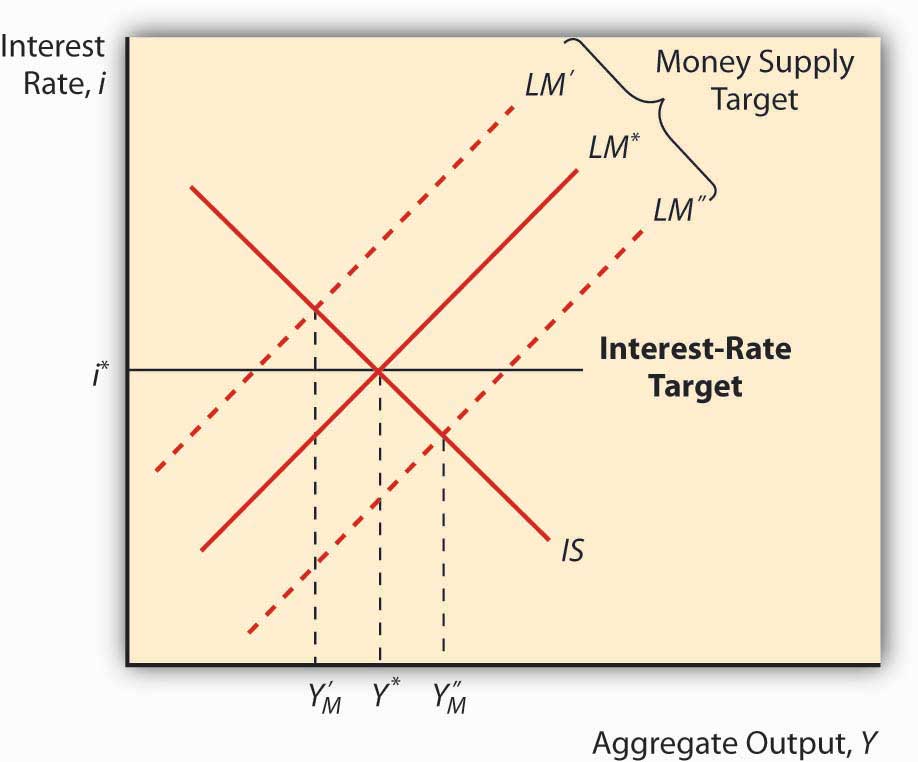
The IS-LM model has a major implication for monetary policy: when the IS curve is unstable, a money supply target will lead to greater output stability, and when the LM curve is unstable, an interest rate target will produce greater macro stability. To see this, look at Figure 22.4 and Figure 22.5 . Note that when LM is fixed and IS moves left and right, an interest rate target will cause Y to vary more than a money supply target will. Note too that when IS is fixed and LM moves left and right, an interest rate target keeps Y stable but a money supply target (shifts in the LM curve) will cause Y to swing wildly. This helps to explain why many central banks abandoned money supply targeting in favor of interest rate targeting in the 1970s and 1980s, a period when autonomous shocks to LM were pervasive due to financial innovation, deregulation, and loophole mining. An important implication of this is that central banks might find it prudent to shift back to targeting monetary aggregates if the IS curve ever again becomes more unstable than the LM curve.
As noted in Chapter 21, the policy power of the IS-LM is severely limited by its short-run assumption that the price level doesn’t change. Attempts to tweak the IS-LM model to accommodate price level changes led to the creation of an entirely new model called aggregate demand and supply. The key is the addition of a new concept, called the natural rate level of output, Ynrl, the rate of output at which the price level is stable in the long run. When actual output (Y*) is below the natural rate, prices will fall; when it is above the natural rate, prices will rise.
The IS curve is stated in real terms because it represents equilibrium in the goods market, the real part of the economy. Changes in the price level therefore do not affect C, I, G, T, or NX or the IS curve. The LM curve, however, is affected by changes in the price level, shifting to the left when prices rise and to the right when they fall. This is because, holding the nominal MS constant, rising prices decrease real money balances, which we know shifts the LM curve to the left.
So suppose an economy is in equilibrium at Ynrl, when some monetary stimulus in the form of an increased MS shifts the LM curve to the right. As noted above, in the short term, interest rates will come down and output will increase. But because Y* is greater than Ynrl, prices will rise, shifting the LM curve back to where it started, give or take. So output and the interest rate are the same but prices are higher. Economists call this long-run monetary neutrality.
Fiscal stimulus, as we saw above, shifts the IS curve to the right, increasing output but also the interest rate. Because Y* is greater than Ynrl, prices will rise and the LM curve will shift left, reducing output, increasing the interest rate higher still, and raising the price level! You just can’t win in the long run, in the sense that policymakers cannot make Y* exceed Ynrl. Rendering policymakers impotent did not win the IS-LM model many friends, so researchers began to develop a new model that relates the price level to aggregate output.
Stop and Think Box
Under the gold standard (GS), money flows in and out of countries automatically, in response to changes in the price of international bills of exchange. From the standpoint of the IS-LM model, what is the problem with that aspect of the GS?
As noted above, decreases in MS lead to a leftward shift of the LM curve, leading to higher interest rates and lower output. Higher interest rates, in turn, could lead to a financial panic or a decrease in C or I, causing a shift left in the IS curve, further reducing output but relieving some of the pressure on i. (Note that NX would not be affected under the GS because the exchange rate was fixed, moving only within very tight bands, so a higher i would not cause the domestic currency to strengthen.)
- Monetary stimulus, that is, increasing the money supply, causes the LM curve to shift right, resulting in higher output and lower interest rates.
- Fiscal stimulus, that is, increasing government spending and/or decreasing taxes, shifts the IS curve to the right, raising interest rates while increasing output.
- The higher interest rates are problematic because they can crowd out C, I, and NX, moving the IS curve left and reducing output.
- The IS-LM model predicts that, in the long run, policymakers are impotent.
- Policymakers can raise the price level but they can’t get Y* permanently above Ynrl or the natural rate level of output.
- That is because whenever Y* exceeds Ynrl, prices rise, shifting the LM curve to the left by reducing real money balances (which happens when there is a higher price level coupled with an unchanged MS).
- That, in turn, eradicates any gains from monetary or fiscal stimulus.