
14.15: Labor Market Power by Employers
- Page ID
- 48489
Learning Objectives
- Explain how wages and employment are determined in labor markets where employers have market power (monopsonies)
In the modules on market structure (i.e. perfectly competition, monopoly, oligopoly, and monopolistic competition), we observed that while economists use the theory of perfect competition as an ideal case of market structure, there are very few examples of perfectly competitive output markets in the real world. What about labor markets? How many labor markets are perfectly competitive? There are probably more examples of perfectly competitive labor markets than perfectly competitive product markets, but that doesn’t mean that all labor markets are competitive.
When a job applicant is bargaining with an employer for a position, the applicant is often at a disadvantage—needing the job more than the employer needs that particular applicant. John Bates Clark (1847–1938), often named as the first great American economist, wrote in 1907: “In the making of the wages contract the individual laborer is always at a disadvantage. He has something which he is obliged to sell and which his employer is not obliged to take, since he [that is, the employer] can reject single men with impunity.”
To give workers more power, the U.S. government has passed, in response to years of labor protests, a number of laws to create a more equal balance of power between workers and employers. These laws include some of the following:
- Setting minimum hourly wages
- Setting maximum hours of work (at least before employers pay overtime rates)
- Prohibiting child labor
- Regulating health and safety conditions in the workplace
- Preventing discrimination on the basis of race, ethnicity, gender, sexual orientation, and age
- Requiring employers to provide family leave
- Requiring employers to give advance notice of layoffs
- Covering workers with unemployment insurance
- Setting a limit on the number of immigrant workers from other countries
Table 1 lists some prominent U.S. workplace protection laws. Many of the laws listed in the table were only the start of labor market regulations in these areas and have been followed, over time, by other related laws, regulations, and court rulings.
| Law | Protection |
|---|---|
| National Labor- Management Relations Act of 1935 (the “Wagner Act”) | Establishes procedures for establishing a union that firms are obligated to follow; sets up the National Labor Relations Board for deciding disputes |
| Social Security Act of 1935 | Under Title III, establishes a state-run system of unemployment insurance, in which workers pay into a state fund when they are employed and received benefits for a time when they are unemployed |
| Fair Labor Standards Act of 1938 | Establishes the minimum wage, limits on child labor, and rules requiring payment of overtime pay for those in jobs that are paid by the hour and exceed 40 hours per week |
| Taft-Hartley Act of 1947 | Allows states to decide whether all workers at a firm can be required to join a union as a condition of employment; in the case of a disruptive union strike, permits the president to declare a “cooling-off period” during which workers have to return to work |
| Civil Rights Act of 1964 | Title VII of the Act prohibits discrimination in employment on the basis of race, gender, national origin, religion, or sexual orientation |
| Occupational Health and Safety Act of 1970 | Creates the Occupational Safety and Health Administration (OSHA), which protects workers from physical harm in the workplace |
| Employee Retirement and Income Security Act of 1974 | Regulates employee pension rules and benefits |
| Pregnancy Discrimination Act of 1978 | Prohibits discrimination against women in the workplace who are planning to get pregnant or who are returning to work after pregnancy |
| Immigration Reform and Control Act of 1986 | Prohibits hiring of illegal immigrants; requires employers to ask for proof of citizenship; protects rights of legal immigrants |
| Worker Adjustment and Retraining Notification Act of 1988 | Requires employers with more than 100 employees to provide written notice 60 days before plant closings or large layoffs |
| Americans with Disabilities Act of 1990 | Prohibits discrimination against those with disabilities and requires reasonable accommodations for them on the job |
| Family and Medical Leave Act of 1993 | Allows employees to take up to 12 weeks of unpaid leave per year for family reasons, including birth or family illness |
| Pension Protection Act of 2006 | Penalizes firms for underfunding their pension plans and gives employees more information about their pension accounts |
| Lilly Ledbetter Fair Pay Act of 2009 | Restores protection for pay discrimination claims on the basis of sex, race, national origin, age, religion, or disability |
There are two sources of imperfect competition in labor markets. These are demand side sources, that is, labor market power by employers, and supply side sources: labor market power by employees. Let’s begin by discussing demand side sources.
A competitive labor market is one where there are many potential employers for a given type of worker, say a secretary or an accountant. Suppose there is only one employer in a labor market. Because that employer has no direct competition in hiring, if they offer lower wages than would exist in a competitive market, employees will have few options. If they want a job, they must accept the offered wage rate. Since the employer is exploiting its market power, we call the firm a monopsony. The classical example of monopsony is the sole coal company in a West Virginia town. If coal miners want to work, they must accept what the coal company is paying. This is not the only example of monopsony. Think about surgical nurses in a town with only one hospital. Employers that have at least some market power over potential employees is not that unusual. After all, most firms have many employees while there is only one employer. Thus, even if there is some competition for workers, it may not feel that way to potential employees unless they do their research and find the opposite.
How does market power by an employer affect labor market outcomes? Intuitively, one might think that wages will be lower than in a competitive labor market. Let’s prove it. We will tell the story for a monopsonist, but the results will be qualitatively similar, although less extreme for any firm with labor market power.
Think back to monopoly. The good news is that because the monopolist is the sole supplier in the market, it can charge any price it wishes. The bad news is that if it wants to sell a greater quantity of output, it must lower the price it charges. Monopsony is analogous. Because the monopsonist is the sole employer in a labor market, it can offer any wage that it wishes. However, because they face the market supply curve for labor, if they want to hire more workers, they must raise the wage they pay. This creates a quandary, which we can understand by introducing a new concept: the marginal cost of labor. The marginal cost of labor is the cost to the firm of hiring one more worker. However, here is the thing: we assume that the firm is determining how many workers to hire in total. They are not hiring sequentially. Let’s look how this plays out with the example in Table 2.
| Supply of Labor | 1 | 2 | 3 | 4 | 5 |
| Wage Rate | $1 per hour | $2 per hour | $3 per hour | $4 per hour | $5 per hour |
| Total Cost of Labor | $1 | $4 | $9 | $16 | $25 |
| Marginal Cost of Labor | $1 | $3 | $5 | $7 | $9 |
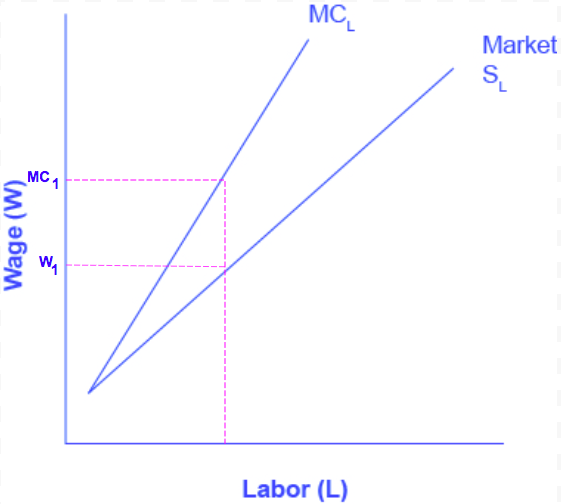
There are a couple of things to notice from the table. First, the marginal cost increases faster than the wage rate. In fact, the marginal cost of hiring an additional worker (beyond the first one) is always greater than the wage necessary to pay them. This is shown in Figure 1, where the MCL is above the supply curve of labor for any quantity of workers (again, beyond the first). This is because to hire one more worker requires paying a higher wage rate, not just for the new worker but for all the previous hires who would have accepted the lower wage. We can see this graphically in Figure 1.
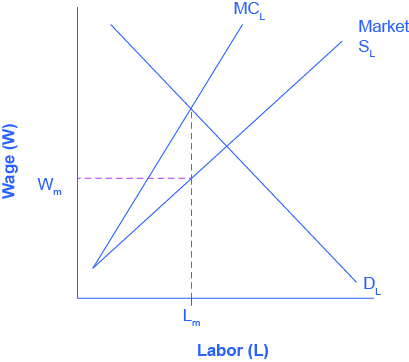
If the firm wants to maximize profits, it will hire labor up to the point Lm where DL = VMP (or MRP) = MCL, as Figure 2 below shows. Then, the supply curve for labor shows the wage the firm will have to pay to attract Lm workers. Graphically, we can draw a vertical line up from Lm to the Supply Curve for label and then read the wage Wm off the vertical axis to the left.
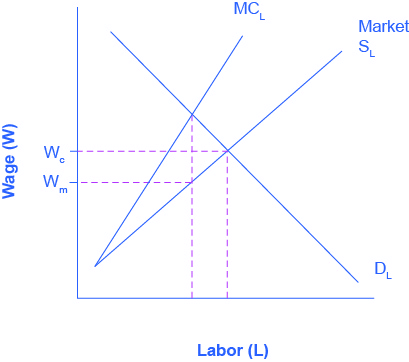
How does this outcome compare to what would occur in a perfectly competitive market? A competitive market would operate where DL = SL, hiring Lc workers and paying Wc wage. In other words, under monopsony employers hire fewer workers and pay a lower wage. While pure monopsony may be rare, many employers have some degree of market power in labor markets. The outcomes for those employers will be qualitatively similar though not as extreme as monopsony.
Learning Objectives
[glossary-page][glossary-term]marginal cost of labor: [/glossary-term]
[glossary-definition]the cost to the firm of hiring one more worker[/glossary-definition][glossary-term]monopsony:[/glossary-term]
[glossary-definition] a labor market where there is only one employer[/glossary-definition][/glossary-page]
Contributors and Attributions
- Wages and Employment in an Imperfectly Competitive Labor Market. Authored by: OpenStax College. Located at: https://cnx.org/contents/vEmOH-_p@4.44:ZfDzMimj@11/Market-Power-on-the-Supply-Sid. License: CC BY: Attribution. License Terms: Download for free at http://cnx.org/contents/bc498e1f-efe...69ad09a82@4.44