
11.12: Financial Markets
- Page ID
- 45423
- Distinguish between bonds and bank loans as methods of borrowing
- Distinguish between private and public companies
- Define “stock”
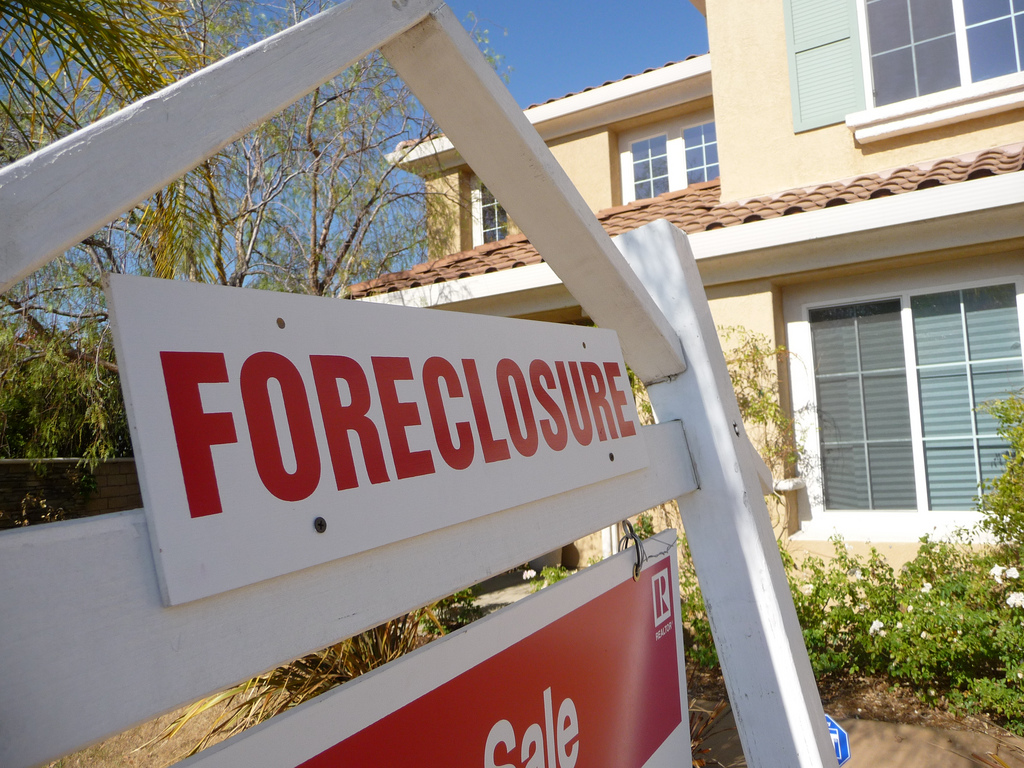
In 2006, housing equity in the United States peaked at $13 trillion. That means that the market prices of homes, less what was still owed on the loans used to buy these houses, equaled $13 trillion. This was a very good number, since the equity represented the value of the financial asset most U.S. citizens owned.
However, by 2008 this number had gone down to $8.8 trillion, and it declined further still in 2009. Combined with the decline in value of other financial assets held by U.S. citizens, by 2010, U.S. homeowners’ wealth had declined by $14 trillion! This is a staggering loss, and it affected millions of lives: people had to alter their retirement decisions, housing decisions, and other important consumption decisions. Just about every other large economy in the world suffered a decline in the market value of financial assets, as a result of the global financial crisis of 2008–2009.
This section will explain why people buy houses (other than as a place to live), why they buy other types of financial assets, and why businesses sell those financial assets in the first place. The section will also give us insight into why financial markets and assets go through boom-and-bust cycles like the one described here.
When a firm needs to buy new equipment or build a new facility, it often must go to the financial market to raise funds. Usually firms will add capacity during an economic expansion when profits are on the rise and consumer demand is high. Business investment is one of the critical ingredients needed to sustain economic growth. Even in the sluggish economy of 2009, U.S. firms invested $1.4 trillion in new equipment and structures, in the hope that those investments would generate profits in the years ahead.
Between the end of the recession in 2009 through the second quarter 2013, profits for the S&P 500 companies grew to 9.7 percent despite the weak economy, with much of that amount driven by cost cutting and reductions in input costs, according to the Wall Street Journal. Figure 1, below, shows corporate profits after taxes (adjusted for inventory and capital consumption). Despite the steep decline in quarterly net profit in 2008, profits have recovered and surpassed pre-Recession levels.

Many firms, from huge companies like General Motors to start-up firms writing computer software, do not have the financial resources within the firm to make all the investments they want. These firms need financial capital from outside investors, and they are willing to pay interest for the opportunity to get a rate of return on the investment for that financial capital.
On the other side of the financial capital market, suppliers of financial capital, like households, wish to use their savings in a way that will provide a return. Individuals cannot, however, take the few thousand dollars that they save in any given year, write a letter to General Motors or some other firm, and negotiate to invest their money with that firm. Financial capital markets bridge this gap: That is, they find ways to take the inflow of funds from many separate suppliers of financial capital and transform it into the funds desired by demanders of financial capital. Such financial markets include stocks, bonds, bank loans, and other financial investments.
Contributors and Attributions
- Revision and adaptation. Authored by: Linda S. Williams and Lumen Learning. License: CC BY: Attribution
- Introduction to Financial Markets from Principles of Microeconomics for AP Courses. Authored by: OpenStax. Provided by: Rice University. Located at: http://cnx.org/contents/yjROLWcx@4.109:3n9XhclX@3/Introduction-to-Financial-Mark. License: CC BY: Attribution
- Foreclosure. Authored by: BasicGov. Located at: https://www.flickr.com/photos/basicgov/3993310255/. License: CC BY-SA: Attribution-ShareAlike