
13.16: Positive Externalities and Technology
- Page ID
- 48470
Learning Objectives
- Identify and explain positive externalities, including new technology
- Show how differences between private benefits and social benefits cause market failure
Individual demand reflects the marginal benefits a consumer receives from some product. When we sum all individual demands, we get the market demand. Market demand captures the marginal private benefits (MPB) of the product, since it measures the benefits received by the consumers who purchase the product. Figure 1 shows the market demand curve as MPB.
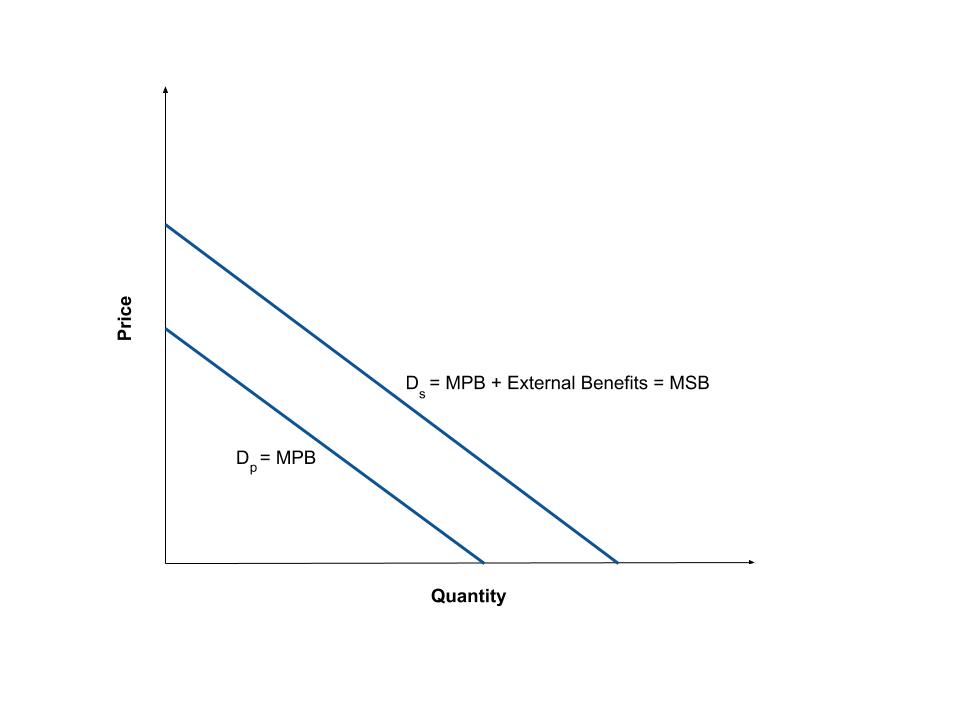
Some products provide both private and external benefits. External benefits are benefits received by someone who didn’t purchase the product, but received some benefits as a spillover or side effect of the consumer’s purchasing the product. When external benefits exist, we describe the situation as a positive externality, where the marginal benefit to society is greater than the marginal benefits to the consumers who purchased the product. The marginal social benefits (MSB) are the marginal private benefits plus the external benefits. Figure 1 shows the social demand curve as MSB. Failure to consider those external benefits results in a market failure. In this section we examine some examples.
Positive Externalities and Private Benefits
Market competition can provide an incentive for discovering new technology because a firm can earn higher profits by finding a way to produce products more cheaply or to create products with characteristics consumers want. As Gregory Lee, CEO of Samsung said, “Relentless pursuit of new innovation is the key principle of our business and enables consumers to discover a world of possibilities with technology.” An innovative firm knows that it will usually have a temporary edge over its competitors and thus an ability to earn above-normal profits before competitors can catch up.
In certain cases, however, competition can discourage new technology, especially when other firms can quickly copy a new idea. Consider a pharmaceutical firm deciding to develop a new drug. On average, it can cost $800 million and take more than a decade to discover a new drug, perform the necessary safety tests, and bring the drug to market. If the research and development (R&D) effort fails—and every R&D project has some chance of failure—then the firm will suffer losses and could even be driven out of business. If the project succeeds, then the firm’s competitors may figure out ways of adapting and copying the underlying idea, but without having to pay the costs themselves. As a result, the innovative company will bear the much higher costs of the R&D and will enjoy at best only a small, temporary advantage over the competition.
Many inventors over the years have discovered that their inventions brought them less profit than they might have reasonably expected.
- Eli Whitney (1765–1825) invented the cotton gin, but then southern cotton planters built their own seed-separating devices with a few minor changes in Whitney’s design. When Whitney sued, he found that the courts in southern states would not uphold his patent rights.
- Thomas Edison (1847–1931) still holds the record for most patents granted to an individual. His first invention was an automatic vote counter, and despite the social benefits, he could not find a government that wanted to buy it.
- Gordon Gould (1920–2005) came up with the idea behind the laser in 1957. He put off applying for a patent and, by the time he did apply, other scientists had laser inventions of their own. A lengthy legal battle resulted, in which Gould spent $100,000 on lawyers, before he eventually received a patent for the laser in 1977. Compared to the enormous social benefits of the laser, Gould received relatively little financial reward.
A variety of studies by economists have found that the original inventor receives one-third to one-half of the total economic benefits from innovations, while other businesses and new product users receive the rest.
Positive Externalities of New Technology
Will private firms in a market economy under invest in research and technology? If a firm builds a factory or buys a piece of equipment, the firm receives all the economic benefits that result from the investments. However, when a firm invests in new technology, the private benefits, or profits, that the firm receives are only a portion of the overall social benefits. The social benefits of an innovation take into account the value of all the positive externalities of the new idea or product, whether enjoyed by other companies or society as a whole, as well as the private benefits received by the firm that developed the new technology. Positive externalities are beneficial spillovers to a third party, or parties.
Consider the example of the Big Drug Company, which is planning its R&D budget for the next year. Economists and scientists working for Big Drug have compiled a list of potential research and development projects and estimated rates of return. (The rate of return is the estimated payoff from the project.) Figure 2 shows how the calculations work. The downward-sloping DPrivate curve represents the firm’s demand for financial capital and reflects the company’s willingness to borrow to finance research and development projects at various interest rates. Suppose that this firm’s investment in research and development creates a spillover benefit to other firms and households. After all, new innovations often spark other creative endeavors that society also values. If we add the spillover benefits society enjoys to the firm’s private demand for financial capital, we can draw DSocial that lies above DPrivate.
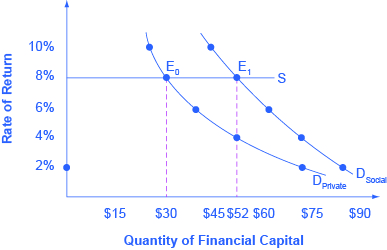
If there was a way for the firm to fully monopolize those social benefits by somehow making them unavailable to the rest of us, the firm’s private demand curve would be the same as society’s demand curve. According to Figure 2 and Table 1, if the going rate of interest on borrowing is 8%, and the company can receive the private benefits of innovation only, then the company would finance $30 million. Society, at the same rate of 8%, would find it optimal to have $52 million of borrowing. Unless there is a way for the company to fully enjoy the total benefits, then it will borrow less than the socially optimal level of $52 million.
| Table 1. Return and Demand for Capital | ||
|---|---|---|
| Rate of Return | DPrivate (in millions) | DSocial (in millions) |
| 2% | $72 | $84 |
| 4% | $52 | $72 |
| 6% | $38 | $62 |
| 8% | $30 | $52 |
| 10% | $26 | $44 |
Big Drug’s original demand for financial capital (DPrivate) is based on the profits received by the firm. However, other pharmaceutical firms and health care companies may learn new lessons about how to treat certain medical conditions and are then able to create their own competing products. The social benefit of the drug takes into account the value of all the positive externalities of the drug. If Big Drug were able to gain this social return instead of other companies, its demand for financial capital would shift to the demand curve DSocial, and it would be willing to borrow and invest $52 million. However, if Big Drug is receiving only 50 cents of each dollar of social benefits, the firm will not spend as much on creating new products. The amount it would be willing to spend would fall somewhere in between DPrivate and DSocial.
Why Invest in Human Capital?
The investment in anything, whether it is the construction of a new power plant or research in a new cancer treatment, usually requires a certain upfront cost with an uncertain future benefit. The investment in education, or human capital, is no different. Over the span of many years, a student and her family invest significant amounts of time and money into that student’s education. The idea is that higher levels of educational attainment will eventually serve to increase the student’s future productivity and subsequent ability to earn. Once the numbers are crunched, does this investment pay off for the student?
Almost universally, economists have found that the answer to this question is a clear “Yes.” For example, several studies of the return to education in the United States estimate that the rate of return to a college education is approximately 10-15%. Data in Table 2, from the U.S. Bureau of Labor Statistics’ Usual Weekly Earnings of Wage and Salary Workers, Third Quarter 2016, demonstrate that median weekly earnings are higher for workers who have completed more education. While these rates of return will beat equivalent investments in Treasury bonds or savings accounts, the estimated returns to education go primarily to the individual worker, so these returns are private rates of return to education.
| Less than a High School Degree | High School Degree, No College | Bachelor’s Degree | |
|---|---|---|---|
| Median Weekly Earnings (full-time workers over the age of 25) | $519 | $698 | $1,270 |
What does society gain from investing in the education of another student? After all, if the government is spending taxpayer dollars to subsidize public education, society should expect some kind of return on that spending. Economists like George Psacharopoulos have found that, across a variety of nations, the social rate of return on schooling is also positive. After all, positive externalities exist from investment in education. While not always easy to measure, according to Walter McMahon, the positive externalities to education typically include better health outcomes for the population, lower levels of crime, a cleaner environment and a more stable, democratic government. For these reasons, many nations have chosen to use taxpayer dollars to subsidize primary, secondary, and higher education. Education clearly benefits the person who receives it, but a society where most people have a good level of education provides positive externalities for all.
Other Examples of Positive Externalities
Although technology may be the most prominent example of a positive externality, it is not the only one. For example, being vaccinated against disease is not only a protection for the individual, but it has the positive spillover of protecting others who may become infected. When a number of homes in a neighborhood are modernized, updated, and restored, not only does it increase the value of those homes, but the value of other properties in the neighborhood may increase as well.
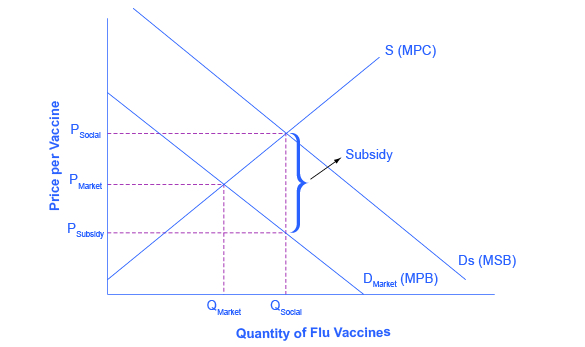
Figure 3 shows the market for flu shots. The market demand curve DMarket for flu shots reflects only the marginal private benefits (MPB) that the vaccinated individuals receive from the shots. Assuming that there are no spillover costs in the production of flu shots, the market supply curve is given by the marginal private cost (MPC) of producing the vaccinations.
The equilibrium quantity of flu shots produced in the market, where MPB is equal to MPC, is QMarket and the price of flu shots is PMarket. However, spillover benefits exist in this market because others, those who chose not to purchase a flu shot, receive a positive externality in a reduced chance of contracting the flu. When we add the spillover benefits to the marginal private benefit of flu shots, the marginal social benefit (MSB) of flu shots is given by DSocial. Because the MSB is greater than MPB, we see that the socially optimal level of flu shots is greater than the market quantity (QSocial exceeds QMarket) and the corresponding price of flu shots, if the market were to produce QSocial, would be at PSocial. Unfortunately, the marketplace does not recognize the positive externality and flu shots will go under produced and under consumed.
How can government try to move the market level of output closer to the socially desirable level of output? One policy would be to provide a subsidy, like a voucher, to any citizen who wishes to get vaccinated. This voucher would act as “income” that one could use purchase only a flu shot and, if the voucher were exactly equal to the per-unit spillover benefits, would increase market equilibrium to a quantity of QSocial and a price of PSocial where MSB equals MSC. Suppliers of the flu shots would receive payment of PSocial per vaccination, while consumers of flu shots would redeem the voucher and only pay a price of PSubsidy. When the government uses a subsidy in this way, it produces the socially optimal quantity of vaccinations.
Watch IT
Watch this video to see how positive externalities increase the overall social benefits to society and cause the supply and demand graph to change.
Try It
These questions allow you to get as much practice as you need, as you can click the link at the top of the first question (“Try another version of these questions”) to get a new set of questions. Practice until you feel comfortable doing the questions.
[ohm_question sameseed=1]155264-155265-155266-155267-155268-155275[/ohm_question]
Learning Objectives
[glossary-page][glossary-term]external benefits (or positive externalities):[/glossary-term]
[glossary-definition]beneficial spillovers to a third party of parties, who did not purchase the good or service that provided the externalities[/glossary-definition]
[glossary-term]marginal private benefits (MPB):[/glossary-term][glossary-definition]the benefits obtained by consumers from purchasing additional units of some product; shown by the market demand curve[/glossary-definition]
[glossary-term]marginal social benefits (MSP):[/glossary-term][glossary-definition]the sum of the private and external benefits when additional units of some product are purchased; also known as the social demand curve[/glossary-definition][glossary-term]positive externalities:[/glossary-term]
[glossary-definition]beneficial spillovers to a third party or parties[/glossary-definition][glossary-term]private benefits:[/glossary-term]
[glossary-definition]the benefits a person who consumes a good or service receives, or a new product’s benefits or process that a company invents that the company captures[/glossary-definition][glossary-term]private rates of return:[/glossary-term]
[glossary-definition]when the estimated rates of return go primarily to an individual; for example, earning interest on a savings account[/glossary-definition][glossary-term]social benefits:[/glossary-term]
[glossary-definition]the sum of private benefits and external benefits[/glossary-definition][glossary-term]social rate of return:[/glossary-term]
[glossary-definition]when the estimated rates of return go primarily to society; for example, providing free education[/glossary-definition][/glossary-page]
Contributors and Attributions
- Modification, adaptation, and original content. Provided by: Lumen Learning. License: CC BY: Attribution
- Why the Private Sector Underinvests in Innovation. Authored by: OpenStax College. Located at: https://cnx.org/contents/vEmOH-_p@4.44:TwbO_eSX@4/Why-the-Private-Sector-Underin. License: CC BY: Attribution. License Terms: Download for free at http://cnx.org/contents/bc498e1f-efe...69ad09a82@4.44
- Positive externalities | Consumer and producer surplus | Microeconomics | Khan Academy. Provided by: Khan Academy. Located at: https://www.youtube.com/watch?v=TSTLLFJbaA4. License: Other. License Terms: Standard YouTube License