
5.21: Factors Affecting Demand
- Page ID
- 48320
Learning Objectives
- Describe which factors cause a shift in the demand curve and explain why the shift occurs
- Define and give examples of substitutes and complements
- Draw a demand curve and graphically represent changes in demand
We know that a change in prices affects the quantity demanded. Price, however, is not the only thing that influences demand. For example, how is demand for vegetarian food affected if, say, health concerns cause more consumers to avoid eating meat?
Effect of Income on Demand
Let’s use income as an example of how factors other than price affect demand. Figure 1 shows the initial demand for automobiles as D0. At point Q, for example, if the price is $20,000 per car, the quantity of cars demanded is 18 million. D0 also shows how the quantity of cars demanded would change as a result of a higher or lower price. For example, if the price of a car rose to $22,000, the quantity demanded would decrease to 17 million, at point R.
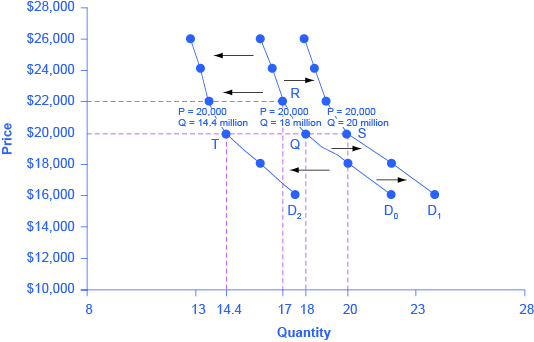
The original demand curve D0, like every demand curve, is based on the ceteris paribus assumption that no other economically relevant factors change. Now imagine that the economy expands in a way that raises the incomes of many people, making cars more affordable. How will this affect demand? How can we show this graphically?
Return to Figure 1. The price of cars is still $20,000, but with higher incomes, the quantity demanded has now increased to 20 million cars, shown at point S. As a result of the higher income levels, the demand curve shifts to the right to the new demand curve D1, indicating an increase in demand. Table 1, below, shows clearly that this increased demand would occur at every price, not just the original one.
| Price | Decrease to D2 | Original Quantity Demanded D0 | Increase to D1 |
|---|---|---|---|
| $16,000 | 17.6 million | 22.0 million | 24.0 million |
| $18,000 | 16.0 million | 20.0 million | 22.0 million |
| $20,000 | 14.4 million | 18.0 million | 20.0 million |
| $22,000 | 13.6 million | 17.0 million | 19.0 million |
| $24,000 | 13.2 million | 16.5 million | 18.5 million |
| $26,000 | 12.8 million | 16.0 million | 18.0 million |
Now, imagine that the economy slows down so that many people lose their jobs or work fewer hours, reducing their incomes. In this case, the decrease in income would lead to a lower quantity of cars demanded at every given price, and the original demand curve D0 would shift left to D2. The shift from D0 to D2 represents such a decrease in demand: At any given price level, the quantity demanded is now lower. In this example, a price of $20,000 means 18 million cars sold along the original demand curve, but only 14.4 million sold after demand fell.

When a demand curve shifts, it does not mean that the quantity demanded by every individual buyer changes by the same amount. In this example, not everyone would have higher or lower income and not everyone would buy or not buy an additional car. Instead, a shift in a demand curve captures a pattern for the market as a whole: Increased demand means that at every given price, the quantity demanded is higher, so that the demand curve shifts to the right from D0 to D1. And, decreased demand means that at every given price, the quantity demanded is lower, so that the demand curve shifts to the left from D0 to D2.
We just argued that higher income causes greater demand at every price. This is true for most goods and services. For some—luxury cars, vacations in Europe, and fine jewelry—the effect of a rise in income can be especially pronounced. A product whose demand rises when income rises, and vice versa, is called a normal good. A few exceptions to this pattern do exist, however. As incomes rise, many people will buy fewer generic-brand groceries and more name-brand groceries. They are less likely to buy used cars and more likely to buy new cars. They will be less likely to rent an apartment and more likely to own a home, and so on. A product whose demand falls when income rises, and vice versa, is called an inferior good. In other words, when income increases, the demand curve shifts to the left.
Try It
https://assessments.lumenlearning.co...sessments/7111
https://assessments.lumenlearning.co...sessments/7112
Watch It
A change in price does not shift the demand curve. It only shows a difference in the quantity demanded. The demand curve will move left or right when there is an underlying change in demand at all prices.
Other Factors That Shift Demand Curves
Income is not the only factor that causes a shift in demand. Other things that change demand include tastes and preferences, the composition or size of the population, the prices of related goods, and even expectations. A change in any one of the underlying factors that determine what quantity people are willing to buy at a given price will cause a shift in demand. Graphically, the new demand curve lies either to the right (an increase) or to the left (a decrease) of the original demand curve. Let’s look at these factors.
Changing Tastes or Preferences

From 1980 to 2012, the per-person consumption of chicken by Americans rose from 33 pounds per year to 81 pounds per year, and consumption of beef fell from 77 pounds per year to 57 pounds per year, according to the U.S. Department of Agriculture (USDA). Changes like these are largely due to shifts in taste, which change the quantity of a good demanded at every price: That is, they shift the demand curve for that good—rightward for chicken and leftward for beef.
Changes in the Composition of the Population
The proportion of elderly citizens in the United States population is rising. It rose from 9.8 percent in 1970 to 12.6 percent in 2000 and will be a projected (by the U.S. Census Bureau) 20 percent of the population by 2030. A society with relatively more children, like the United States in the 1960s, will have greater demand for goods and services like tricycles and day care facilities. A society with relatively more elderly persons, as the United States is projected to have by 2030, has a higher demand for nursing homes and hearing aids. Similarly, changes in the size of the population can affect the demand for housing and many other goods. Each of these changes in demand will be shown as a shift in the demand curve.
Changes in the Prices of Related Goods
The demand for a product can also be affected by changes in the prices of related goods such as substitutes or complements. A substitute is a good or service that can be used in place of another good or service. As electronic books become more available, you would expect to see a decrease in demand for traditional printed books. A lower price for a substitute decreases demand for the other product. For example, in recent years as the price of tablet computers has fallen, the quantity demanded has increased (because of the law of demand). Since people are purchasing tablets, there has been a decrease in demand for laptops, which can be shown graphically as a leftward shift in the demand curve for laptops. A higher price for a substitute good has the reverse effect.

Other goods are complements for each other, meaning that the goods are often used together, because consumption of one good tends to enhance consumption of the other. Examples include breakfast cereal and milk; notebooks and pens or pencils, golf balls and golf clubs; gasoline and sport utility vehicles; and the five-way combination of bacon, lettuce, tomato, mayonnaise, and bread. If the price of golf clubs rises, since the quantity of golf clubs demanded falls (because of the law of demand), demand for a complement good like golf balls decreases, too. Similarly, a higher price for skis would shift the demand curve for a complement good like ski resort trips to the left, while a lower price for a complement has the reverse effect.
Changes in Expectations About Future Prices
While it is clear that the price of a good affects the quantity demanded, it is also true that expectations about the future price (or expectations about tastes and preferences, income, and so on) can affect demand. For example, if people hear that a hurricane is coming, they may rush to the store to buy flashlight batteries and bottled water. If people learn that the price of a good like coffee is likely to rise in the future, they may head for the store to stock up on coffee now. These changes in demand are shown as shifts in the curve. Therefore, a shift in demand happens when a change in some economic factor (other than the current price) causes a different quantity to be demanded at every price.
Try It
https://assessments.lumenlearning.co...sessments/7113
https://assessments.lumenlearning.co...sessments/7114
Exercise: Shift in Demand Due to Income Increase
A shift in demand means that at any price (and at every price), the quantity demanded will be different than it was before. Following is a graphic illustration of a shift in demand due to an income increase.
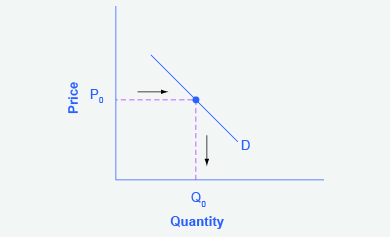
Step 1. Draw the graph of a demand curve for a normal good like pizza. Pick a price (like P0). Identify the corresponding Q0. An example is shown in Figure 5.
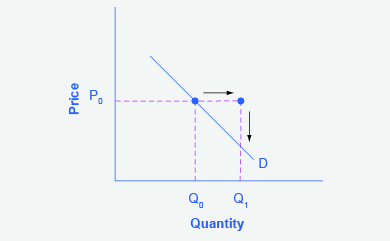
Step 2. Suppose income increases. As a result of the change, are consumers going to buy more or less pizza? The answer is more. Draw a dotted horizontal line from the chosen price, through the original quantity demanded, to the new point with the new Q1. Draw a dotted vertical line down to the horizontal axis and label the new Q1. An example is provided in Figure 6.
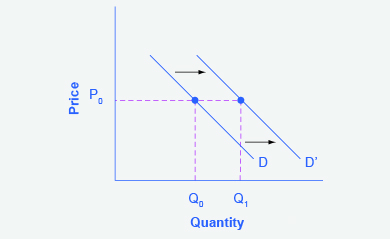
Step 3. Now, shift the curve through the new point. You will see that an increase in income causes an upward (or rightward) shift in the demand curve, so that at any price, the quantities demanded will be higher, as shown in Figure 7.

Summary: What Factors Shift Demand?
Six factors that can shift demand curves are summarized in Figure 9, below. The direction of the arrows indicates whether the demand curve shifts represent an increase in demand or a decrease in demand. Notice that a change in the price of the good or service itself is not listed among the factors that can shift a demand curve. A change in the price of a good or service causes a movement along a specific demand curve, and it typically leads to some change in the quantity demanded, but it does not shift the demand curve.

Try It
https://assessments.lumenlearning.co...sessments/7115
https://assessments.lumenlearning.co...sessments/7116
Learning Objectives
[glossary-page][glossary-term]complements: [/glossary-term]
[glossary-definition]goods or services that are used together because the use of one enhances the use of the other[/glossary-definition][glossary-term]substitutes: [/glossary-term][glossary-definition]goods or services that can be used in place of one another[/glossary-definition][glossary-term]inferior good: [/glossary-term][glossary-definition]good or service whose demand decreases when a consumer’s income increases and demand increases when income decreases[/glossary-definition][glossary-term]normal good: [/glossary-term][glossary-definition]good or service whose demand increases when a consumer’s income increases and demand decreases when income decreases[/glossary-definition]
[/glossary-page]
Contributors and Attributions
- Revision and adaptation. Provided by: Lumen Learning. License: CC BY: Attribution
- Office stationary. Located at: http://www.publicdomainpictures.net/view-image.php?image=1889&picture=office-stationary. License: CC0: No Rights Reserved
- Shifts in Demand and Supply for Goods and Services. Authored by: OpenStax College. Located at: https://cnx.org/contents/vEmOH-_p@4.44:yVLuEBEj@7/Shifts-in-Demand-and-Supply-fo. License: CC BY: Attribution. License Terms: Download for free at http://cnx.org/contents/bc498e1f-efe...69ad09a82@4.44
- family at shopping center. Authored by: vborodinova . Provided by: Pixabay. Located at: https://pixabay.com/en/family-shopping-center-purchase-2923690/. License: CC BY: Attribution
- Grilled Chicken Feet. Authored by: Joe Ross. Located at: https://www.flickr.com/photos/51241294@N00/7234340366/in/photostream/. License: CC BY: Attribution
- Diagonal shift test folds. Authored by: Rebecca Gieseking. Located at: https://www.flickr.com/photos/rgieseking/9595911874/. License: Public Domain: No Known Copyright