
7.20: Calculating Inflation with Index Numbers
- Page ID
- 47380
Learning Objectives
- Explain what a price index is and how to compute one
- Calculate inflation rates using price indices
The Price of a Basket of Goods

If inflation is the percentage change of the price level, what is the “price level”? When economists talk about the price level, what they mean is the average level of prices. To calculate the price level, they begin with the concept of a market basket of goods and services. Imagine a weekly trip to the grocery store. Think about the items you place in your shopping cart (or basket) to buy. That is your market basket. More formally, when economists talk about a market basket of goods and services, they are referring to the different items individuals, businesses, or organizations typically buy.
The next step is to identify the prices of those items, and create a weighted average of the prices. Changes in the prices of goods for which people spend a larger share of their incomes will matter more than changes in the prices of goods for which people spend a smaller share of their incomes. For example, an increase of 10% in the rental rate on housing matters more to most people than whether the price of carrots rises by 10%. To construct an overall measure of the price level, economists compute a weighted average of the prices of the items in the basket, where the weights are based on the actual quantities of goods and services people buy.
Index Numbers
The numerical results of a calculation based on a basket of goods can get a little messy. To simplify the task, the price level in each period is typically reported as an index number, rather than as the dollar amount for buying the basket of goods. Index numbers are unit-free measures of economic indicators. Index numbers are based on a value of 100, which makes it easy to measure percent changes. We’ll explain this shortly.
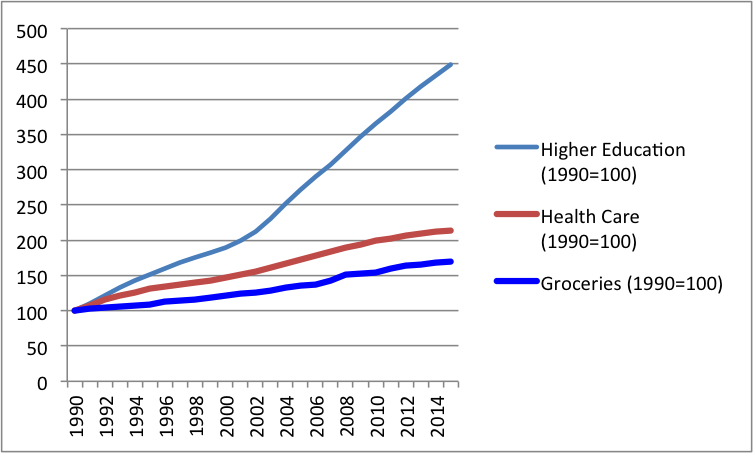
Index numbers for prices are called price indices. A price index is essentially the weighted average of prices of a certain type of good or service. Price indices can measure a narrow range of goods and services or a broader range of goods and services. There are price indices for restaurant meals, for groceries, for consumer goods and services, or for everything included in GDP. Figure 2 shows price indices for U.S. higher education, healthcare and groceries, for the period 1990-2015, which are computed by the Bureau of Economic Analysis in the U.S. Commerce Department. Each price index has a base year of 1990 and increases over time. The price index for groceries increased by 70% over the 25-year period. You can see this since the price index increased from a value of 100 in 1990 to a value of 170 in 2015. The price index for healthcare increased by 213% over the same period, and the price index for higher education, which includes tuition, room, board, textbooks and other fees, increased nearly 450% over the period.
Price indices are created to help calculate the percent change in prices over time. To convert the money spent on the basket to a price index, economists arbitrarily choose one year to be the base year, or starting point from which we measure changes in prices. The base year, by definition, has an index value equal to 100. This sounds complicated, but it is really a simple math trick.
Let’s look at a simple example.
Calculating a Price index
Suppose we look at a simple basket of goods consisting of hamburgers, aspirin and movie tickets, three items that a college student might buy. Say that in any given month, a college student typically purchases 20 hamburgers, one bottle of aspirin, and five movies. Prices for these items over four years are given below. Prices of some goods in the basket may rise while others fall. In this example, the price of aspirin does not change over the four years, while movies increase in price and hamburgers bounce up and down. Each year, the cost of buying the given basket of goods at the prices prevailing at that time is shown.
To calculate the price index in this example, first compute how much money is spent on each good in Year 1.
| Year 1 | Amount | Price | Total |
| Hamburgers | 20 | $3 | $60 |
| Aspirin | 1 | $10 | $10 |
| Movies | 5 | $6 | $30 |
Next compute the total cost of the market basket in Year 1:
$60 + $10 + $30 = $100
Next, do the same computations for Years 2 through 4.
| Year 2 | Amount | Price | Total |
| Hamburgers | 20 | $3.20 | $64 |
| Aspirin | 1 | $10 | $10 |
| Movies | 5 | $6.50 | $32.50 |
Total cost of the market basket in Year 2:
$64 + $10 + $32.50 = $106.50
| Year 3 | Amount | Price | Total |
| Hamburgers | 20 | $3.10 | $62 |
| Aspirin | 1 | $10 | $10 |
| Movies | 5 | $7 | $35 |
Total cost of the market basket in Year 3:
$62 + $10 + $35 = $107
| Year 4 | Amount | Price | Total |
| Hamburgers | 20 | $3.50 | $64 |
| Aspirin | 1 | $10 | $10 |
| Movies | 5 | $7.50 | $37.50 |
Total cost of the market basket in Year 4:
$70 + $10 + $37.50 = $117.50
These computations are summarized in Table 1.
| Table 1. A College Student’s Basket of Goods | ||||
|---|---|---|---|---|
| Items | Hamburger | Aspirin | Movies | Total Cost of Market Basket |
| Qty | 20 | 1 bottle | 5 | — |
| Year 1 Price | $3.00 | $10.00 | $6.00 | — |
| Year 1 Amount Spent | $60.00 | $10.00 | $30.00 | $100.00 |
| Year 2 Price | $3.20 | $10.00 | $6.50 | — |
| Year 2 Amount Spent | $64.00 | $10.00 | $32.50 | $106.50 |
| Year 3 Price | $3.10 | $10.00 | $7.00 | — |
| Year 3 Amount Spent | $62.00 | $10.00 | $35.00 | $107.00 |
| Year 4 Price | $3.50 | $10.00 | $7.50 | — |
| Year 4 Amount Spent | $70.00 | $10.00 | $37.50 | $117.50 |
Now, the total cost of the market basket in each year is not quite a price index, because we haven’t established a base year. Say that Year 3 is chosen as the base year. Since the total amount of spending in that year is $107, we divide that amount by itself ($107) and multiply by 100. Mathematically, that is equivalent to dividing $107 by 100, or $1.07. Doing either will give us a value for the price index in the base year of 100. Again, this is because the index number in the base year always has to have a value of 100. Then, to figure out the values of the price index for the other years, we divide the dollar amounts for the other years by 1.07 as well. Note also that the dollar signs cancel out so that price indices have no units. Calculations for the other values of the price index, based on the example presented in Table 1 are shown in Table 2.
| Table 2. Calculating Price Indices When Year 3 is the Base Year | |||
|---|---|---|---|
| Total Spending | Price Index | ||
| Year 1 | $100 | | |
| Year 2 | $106.50 | ||
| Year 3 | $107 | ||
| Year 4 | $117.50 | ||
From Price Indices to Inflation Rates
An inflation rate is just the percentage change in a price index. An inflation rate can be computed for any price index using the general equation for percentage changes between two years, whether in the context of inflation or in any other calculation:
From Year 1 to Year 2, the price index in Table 2 rises from 93.4 to 99.5. Therefore, the percentage change over this time—the inflation rate—is:
From Year 2 to Year 3, the price rises from 99.5 to 100. Thus, the inflation rate over this time, again calculated by the percentage change, is approximately:
From Year 3 to Year 4, the overall cost rises from 100 to 109.8. The inflation rate is thus:
These calculations are summarized in Table 3.
| Table 3. Calculating the Inflation Rate from the Price index | |||
|---|---|---|---|
| Price index | Inflation Rate | ||
| Year 1 | 93.4 | ||
| Year 2 | 99.5 | ||
| Year 3 | 100 | ||
| Year 4 | 109.8 | ||
This calculation of the change in the total cost of purchasing a basket of goods takes into account how much is spent on each good. The result is equivalent to creating a weighted average of the prices of the three items, with the weights being the percentage of the college student’s budget made up by each item. The inflation rate, then, is the percentage change each year in the weighted average of prices.
Closing Thoughts on Price Indices
Three points to remember: first, the inflation rate is the same whether it is based on dollar values or price indices, so then why bother with the price indices?
The inflation calculations we performed above were all based off the the price indices. For example, in year three the inflation rate was calculated this way:
Note that we could also get to this number by computing inflation rates as the percent change over time in the cost of the market basket. For example, from period 2 to period 3, the overall change in the cost of purchasing the basket rises from $106.50 to $107. Thus, the inflation rate over this time, calculated by the percentage change, is approximately:
The advantage of using price indices over the costs of the market basket is that indexing allows easier eyeballing of the inflation numbers. If you glance at two annual values for a price index like 107 and 110, you know automatically that the rate of inflation between the two years is about, but not quite exactly equal to, 3%. By contrast, imagine that the price levels were expressed in absolute dollars of a large basket of goods, so that when you looked at the data, the numbers were $19,493.62 and $20,009.32. Most people find it difficult to eyeball those kinds of numbers and say that it is a change of about 3%. However, the two numbers expressed in dollars are exactly in the same proportion of 107 to 110 as the previous example. If you’re wondering why simple subtraction of the index numbers wouldn’t work, read the following feature.
Why do you not just subtract index numbers?
A word of warning: when a price index moves from, say, 107 to 110, the rate of inflation is not exactly 3%. Remember, the inflation rate is not derived by subtracting the index numbers, but rather through the percentage-change calculation. The precise inflation rate as the price index moves from 107 to 110 is calculated as (110 – 107)/107 = 0.028 = 2.8%. When the base year is fairly close to 100, a quick subtraction is not a terrible shortcut to calculating the inflation rate—but when precision matters down to tenths of a percent, subtracting will not give the right answer.
Second, index numbers have no dollar signs or other units attached to them. Although price index numbers are used to calculate a percentage inflation rate, the index numbers themselves do not have percentage signs. Index numbers just mirror the proportions found in other data. They transform the other data so that the data are easier to work with.
Third, the choice of a base year for the index number—that is, the year that is automatically set equal to 100—is arbitrary. It is chosen as a starting point from which changes in prices are tracked. In the official inflation statistics, it is common to use one base year for a few years, and then to update it, so that the base year of 100 is relatively close to the present. But any base year that is chosen for the index numbers will result in exactly the same inflation rate. To see this in the previous example (Table 1), imagine that Year 1, when total spending was $100, was also chosen as the base year, and given an index number of 100. At a glance, you can see that the index numbers would now exactly match the dollar figures, the inflation rate in the first period would be 6.5%, and so on.
Watch It
Watch the four minute clip from this video to review the distinction between price indices and inflation rates.
An interactive or media element has been excluded from this version of the text. You can view it online here: http://pb.libretexts.org/mlum/?p=321
Glossary
- [glossary-page][glossary-term]base year: [/glossary-term]
[glossary-definition]arbitrary year whose value as an index number is defined as 100; inflation from the base year to other years can easily be seen by comparing the index number in the other year to the index number in the base year—i.e., 100; so, if the index number for a year is 105, then there has been exactly 5% inflation between that year and the base year[/glossary-definition][glossary-term]index number[/glossary-term][glossary-definition]a unit-free measure of an economic indicators; index numbers are based on a value of 100, which makes it easy to measure percent changes[/glossary-definition][glossary-term]Inflation rate: [/glossary-term][glossary-definition]The percentage change in some price index[/glossary-definition][glossary-term]market basket: [/glossary-term][glossary-definition]hypothetical collection of goods and services (or more precisely, the quantities of each good or service) consumers typically buy[/glossary-definition][glossary-term]price indices: [/glossary-term][glossary-definition]essentially the weighted average of prices of a certain type of good or service; price indices are created to calculate the inflation rate, i.e. the percent change in prices over time[/glossary-definition][glossary-term]price level: [/glossary-term][glossary-definition]the average level of prices[/glossary-definition][/glossary-page]
- Tracking Inflation. Authored by: OpenStax College. Located at: https://cnx.org/contents/vEmOH-_p@4.44:_ugh5KKw@4/Tracking-Inflation. License: CC BY: Attribution. License Terms: Download for free at http://cnx.org/contents/bc498e1f-efe...69ad09a82@4.44
- Green shopping cart. Authored by: polycart. Provided by: Flickr. Located at: https://www.flickr.com/photos/polycart/5783063464/in/photolist-9P2HhL-cWfFTC-7Uy3V8-9PkiXz-F5Xy87-7BJjen-5CP9ce-TckgPq-drJtEN-gHQpx4-ZujbkL-71R9vA-71QXiC-dLEHk3-JBHu5A-dHhXEK-YCzFLW-jQA1mg-qYH7PF-am2frE-9LrezN-9LqveS-9kPuCv-aHrkPc-6TDV5Y-ejcwUR-35qpgj-mTUuPg-ZxvVvo-9e5ehN-gHQvTG-ejc81K-ZxvUZJ-8VbipK-9LkTKx-71LZLM-9LkTAP-7Mjea-9dKTVc-onmHrk-5n7zjw-7knXt9-on9BJ1-c1SMn3-aV1hu2-cWfEbo-cwUthf-5n3hhZ-cWfGr5-KMZjJ. License: CC BY: Attribution
- Inflation and CPI Practice- Macro 2.8. Provided by: ACDC Leadership. Located at: https://www.youtube.com/watch?v=JW7IQ45_up8. License: Other. License Terms: Standard YouTube License