Business LibreTexts

15.8: Excel Table in PowerPoint

  • Page ID
    46680
  • \( \newcommand{\vecs}[1]{\overset { \scriptstyle \rightharpoonup} {\mathbf{#1}} } \) \( \newcommand{\vecd}[1]{\overset{-\!-\!\rightharpoonup}{\vphantom{a}\smash {#1}}} \)\(\newcommand{\id}{\mathrm{id}}\) \( \newcommand{\Span}{\mathrm{span}}\) \( \newcommand{\kernel}{\mathrm{null}\,}\) \( \newcommand{\range}{\mathrm{range}\,}\) \( \newcommand{\RealPart}{\mathrm{Re}}\) \( \newcommand{\ImaginaryPart}{\mathrm{Im}}\) \( \newcommand{\Argument}{\mathrm{Arg}}\) \( \newcommand{\norm}[1]{\| #1 \|}\) \( \newcommand{\inner}[2]{\langle #1, #2 \rangle}\) \( \newcommand{\Span}{\mathrm{span}}\) \(\newcommand{\id}{\mathrm{id}}\) \( \newcommand{\Span}{\mathrm{span}}\) \( \newcommand{\kernel}{\mathrm{null}\,}\) \( \newcommand{\range}{\mathrm{range}\,}\) \( \newcommand{\RealPart}{\mathrm{Re}}\) \( \newcommand{\ImaginaryPart}{\mathrm{Im}}\) \( \newcommand{\Argument}{\mathrm{Arg}}\) \( \newcommand{\norm}[1]{\| #1 \|}\) \( \newcommand{\inner}[2]{\langle #1, #2 \rangle}\) \( \newcommand{\Span}{\mathrm{span}}\)\(\newcommand{\AA}{\unicode[.8,0]{x212B}}\)

    Learning Objectives

    • Create PowerPoint slide with integrated Excel table.

    Cameron has an Excel file with a pertinent table for the sales presentation. He selects slide 3, types in a slide title, and then follows these steps to insert the Excel table into PowerPoint.

    Option 1 for Table Integration

    In the text box, Cameron hovers over the icons in the middle and clicks on the Insert Table icon.

    A Microsoft Powerpoint for a sales campaign is displayed. There are two green arrows displayed, the first shows where the title of the slide is and the second points at where the insert icon is.

    He doesn’t have an Excel table in a file to copy into his PowerPoint presentation, so he creates one through the following steps:

    A Microsoft Powerpoint for a sales campaign is displayed. There are four green numbers on the slide, the first one shows where to insert the table box. The second number shows where to insert columns, the third where to enter the number of rows and the fourth where the ok button is to accept the changes.
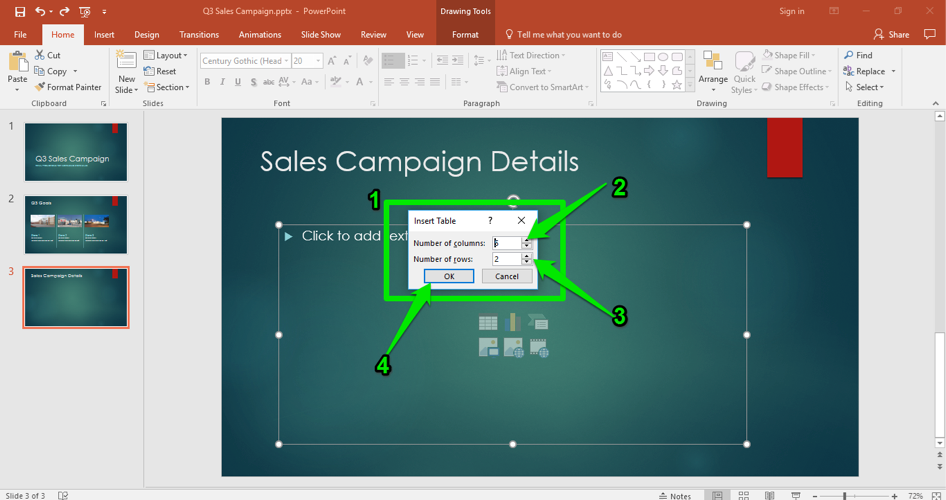
    1. Insert Table Box. This box appears where Cameron decides the size of his table.
    2. Number of Columns. Clicks the down arrow until the number is 4 columns.
    3. Number of Rows. Clicks the up arrow until the number is 6 rows.
    4. OK Button. This button creates a little Excel table within Cameron’s PowerPoint presentation slide.

    The Excel table is now in his PowerPoint presentation and ready for data to be entered. Cameron now enters his information into the table.

    A Microsoft Powerpoint for a sales campaign is displayed. There are two green arrows displayed, the first one is pointing at the design tab in the ribbon menu where a specific table has been selected and the second points at where to insert data into the table.

    Note: If at any time Cameron wants to change the color of the table he can click on the Table styles in the bar above.

    A Microsoft Powerpoint for a sales campaign is displayed. A table has been entered and there are four green numbers showing different formatting options for the table. The first number shows that the table title has been selected, the second shows that the font size for the title has been set to 40, the third arrow points at how the rest of the tables content has been turned to font size 20 and the fourth shows that the title of the slide has been changed.

    Cameron types in the sales figures from the three different stores, and wants to make additional changes. He has already bolded the title rows (using the Bold button in the Home Tab), but the type is difficult to read from a distance.

    1. He selects the table title.
    2. He right-clicks to bring up the font size and selects size 40.
    3. He selects the remaining rows and uses the upper font bar to change the font size to 20pt.
    4. He decides to change the title by clicking within the title box, then typing in a new title.

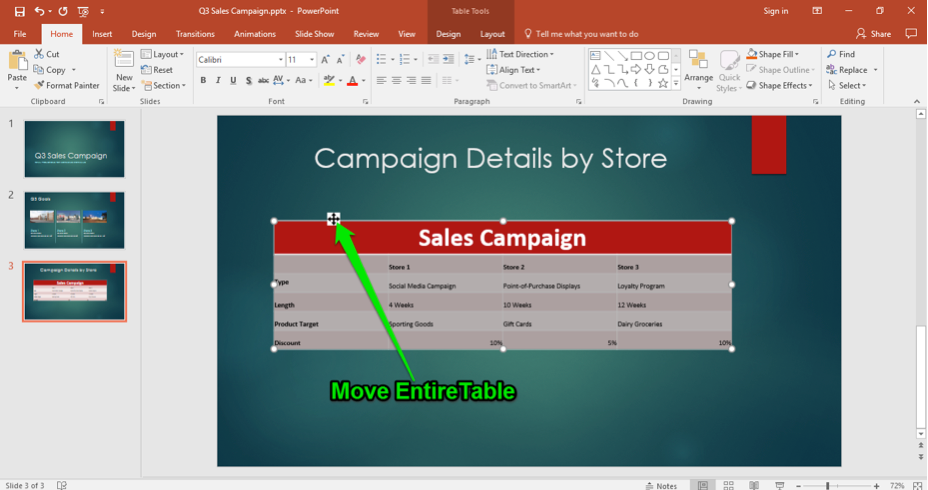
    Cameron steps back and looks at the table. He notices the table is not centered on the slide, so he clicks on the table and moves his cursor to the edge of the table until he sees the four arrow symbol. move_cursor.png He drags the whole table to the center of the slide.

    A Microsoft Powerpoint for a sales campaign is displayed. A table has been entered and there is a green arrow pointing at how to center the table on the slide.

    He now makes a note under the table by clicking on the Insert tab and the Text Box button.

    A Microsoft Powerpoint for a sales campaign is displayed. A table has been entered and there is a new dropdown menu for the option to insert a text box.

    He puts his cursor under the table and begins to type his note into the slide. This step is now complete.

    A Microsoft Powerpoint for a sales campaign is displayed. A table has been entered and beneath the table a new text box has been inserted with a note.

    Cameron reads through the slide to make sure it is clear and decides to change the table title. He clicks in the table title and retypes the words to say “Q3 Campaign.” Now the slide is complete, and he is ready for another slide.

    A Microsoft Powerpoint for a sales campaign is displayed. A table has been entered and the name of the table has been changed to Q3 Campaign.

    Option 2 for Table Integration

    What if Cameron has an existing sales campaign Excel table he can use? With this scenario, he copies it directly into his PowerPoint presentation so there’s no need to make his own table. Here is how Cameron inserts an existing Excel file table:

    A Microsoft Powerpoint for a sales campaign is displayed with a microsoft excel sheet directly to its left. There are three green numbers on the excel sheet, the first showing that the excel sheet has been selected. The second number shows that the table on the sheet has been selected and the third shows how to copy the excel table.
    1. Open Excel application. Cameron has the RR Sales Campaign Excel file open on his computer.
    2. Select the table. Cameron selects the entire table and clicks with the right mouse button.
    3. Copy the Excel table. Next, Cameron opens the selects the Copy function. Cameron can also use the Ctrl+C keys to copy the table.
    A Microsoft Powerpoint for a sales campaign is displayed with a microsoft excel sheet directly to its left. There are three numbers showing, the first identifies that the powerpoint has been selected, the second shows where to insert the table and the third shows how to paste the excel table.
    1. Select PowerPoint. Cameron clicks on the PowerPoint window to bring it forward (he could also toggle Alt+Tab if the window is behind the Excel window).
    2. Select table area. Cameron clicks with the right mouse button in the Table box.
    3. Paste Excel table. Cameron selects the Paste function in the menu and the table is placed in the slide (He can also use the Ctrl+V keys to paste in the table).

    He can now resize, move, center, bold, add the text note, and change the font of the table like in the Option 1 example to optimally display the table on the slide. The table slide is now set, and Cameron is ready for an additional slide with a chart indicating the campaign funding divisions between stores.

    Contributors and Attributions

    CC licensed content, Original
    • Excel Table in PowerPoint. Authored by: Sherri Pendleton. Provided by: Lumen Learning. License: CC BY: Attribution

    15.8: Excel Table in PowerPoint is shared under a CC BY license and was authored, remixed, and/or curated by LibreTexts.

    • Was this article helpful?