
6.13: Independent vs. Dependent Variable
- Page ID
- 45857
Learning Outcomes
- Define dependent variable and independent variable
Here is an overview of mixed costs, and creating a scattergraph to test our theory of the behavior of the costs.

A YouTube element has been excluded from this version of the text. You can view it online here: http://pb.libretexts.org/afm-2/?p=266
You are the maintenance supervisor at the local dog groomer. It is budget time, and you are working on your maintenance budget for the year. In an effort to work through your numbers, you notice that the maintenance cost has a fixed component to it. The hypothesis is that for each additional dog groomed, there is additional maintenance cost incurred. Let’s look at a few months worth of activity:
| Month | Number of Dogs Groomed | Total Maintenance Cost |
|---|---|---|
| July | 560 | 790 |
| August | 710 | 850 |
| September | 500 | 740 |
| October | 650 | 820 |
| November | 730 | 910 |
| December | 800 | 980 |
Going back to our mixed cost formula:
Y= total maintenance cost and will be plotted on the vertical axis of our graph. This cost is the dependent variable since the amount depends on the activity for the period.
X= the activity or number of dogs groomed. This will be plotted on the horizontal axis and is the independent variable, because it is the factor that causes the variations in the cost.
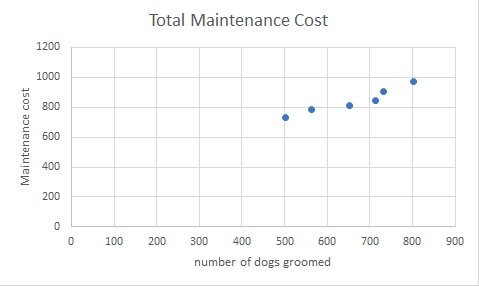
So from this graph, you can see that the more dogs groomed, the higher the maintenance cost, and it is rising in a somewhat linear manner too. This step, creating a scattergraph is done as a first step to see if our theory is correct, before we move on and do further analysis.
Practice Questions
- Independent vs. Dependent Variable. Authored by: Freedom Learning Group. Provided by: Lumen Learning. License: CC BY: Attribution
- Scatter-Graph and High-Low Method. Authored by: Farhat's Accounting Lecture. Located at: https://youtu.be/M8AbnX0gQHY. License: All Rights Reserved. License Terms: Standard YouTube License