
2.8: Rate of Change
- Page ID
- 45788
Learning outcome
- Calculate the rate of change using data points and graphical representations
Frequently we want to compare two different types of measurements, such as miles to gallons. To make this comparison, we use a rate. Examples of rates are miles in
hours,
words in
minutes, and
dollars per
ounces.
Rate
A rate compares two quantities of different units. A rate is usually written as a fraction.
When writing a fraction as a rate, we put the first given amount with its units in the numerator and the second amount with its units in the denominator. When rates are simplified, the units remain in the numerator and denominator.
example
Bob drove his car miles in
hours. Write this rate as a fraction.
Solution
| Write as a fraction, with | |
So miles in
hours is equivalent to
try it
[ohm_question]146615[/ohm_question]

A YouTube element has been excluded from this version of the text. You can view it online here: http://pb.libretexts.org/afm-2/?p=120
Let’s examine how a rate is represented on a graph and determine how to identify it.
Using rubber bands on a geoboard gives a concrete way to model lines on a coordinate grid. By stretching a rubber band between two pegs on a geoboard, we can discover how to find the slope of a line. And when you ride a bicycle, you feel the slope as you pump uphill or coast downhill.
We’ll start by stretching a rubber band between two pegs to make a line as shown in the image below.

Does it look like a line?
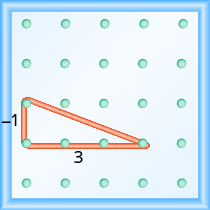
Now we stretch one part of the rubber band straight up from the left peg and around a third peg to make the sides of a right triangle as shown in the image below. We carefully make a angle around the third peg, so that one side is vertical and the other is horizontal.

To find the slope of the line, we measure the distance along the vertical and horizontal legs of the triangle. The vertical distance is called the rise and the horizontal distance is called the run, as shown below.
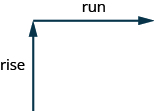
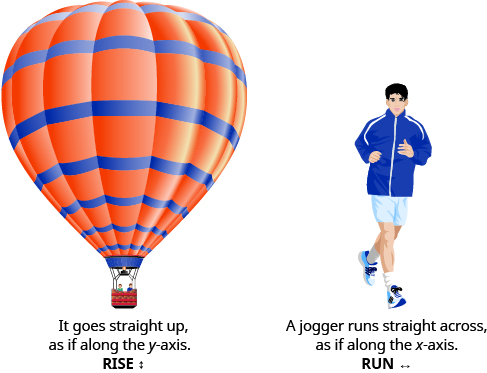
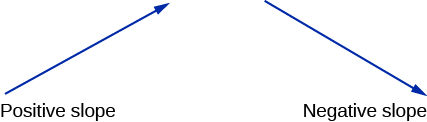
To help remember the terms, it may help to think of the images shown below.
On our geoboard, the rise is units because the rubber band goes up
spaces on the vertical leg. See the image below.
What is the run? Be sure to count the spaces between the pegs rather than the pegs themselves! The rubber band goes across spaces on the horizontal leg, so the run is
units.
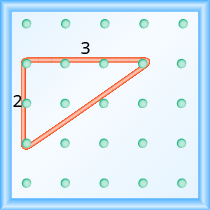
The slope of a line is the ratio of the rise to the run. So the slope of our line is . In mathematics, the slope is always represented by the letter
.
Slope of a line or rate of change
The slope of a line is .
The rise measures the vertical change and the run measures the horizontal change.
What is the slope of the line on the geoboard in the image above?
The line has slope
If we start by going up the rise is positive, and if we stretch it down the rise is negative. We will count the run from left to right, just like you read this paragraph, so the run will be positive.
Since the slope formula has rise over run, it may be easier to always count out the rise first and then the run.
example
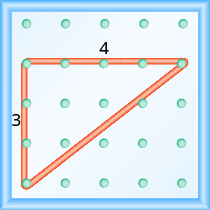
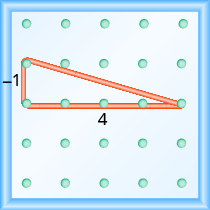
What is the slope of the line on the geoboard shown?

Solution
Use the definition of slope.
Start at the left peg and make a right triangle by stretching the rubber band up and to the right to reach the second peg.
Count the rise and the run as shown.
example
What is the slope of the line on the geoboard shown?

[reveal-answer q=”698295″]Show Answer[/reveal-answer]
[hidden-answer a=”698295″]
Solution
Use the definition of slope.
Start at the left peg and make a right triangle by stretching the rubber band to the peg on the right. This time we need to stretch the rubber band down to make the vertical leg, so the rise is negative.
[/hidden-answer]
try it
[ohm_question]147013[/ohm_question]
Notice that in the first example, the slope is positive and in the second example the slope is negative. Do you notice any difference in the two lines shown in the images below.
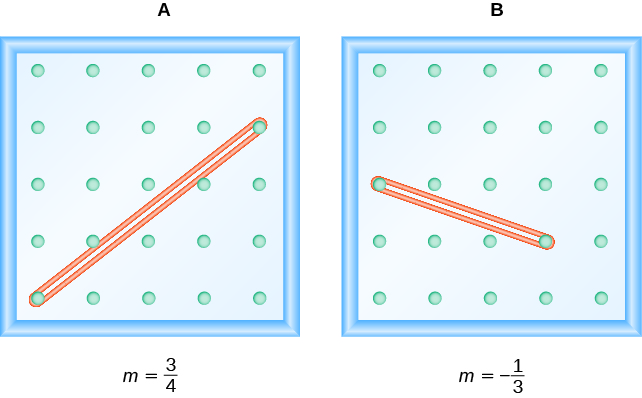
As you read from left to right, the line in Figure A, is going up; it has positive slope. The line Figure B is going down; it has negative slope.
example
Use a geoboard to model a line with slope .
[reveal-answer q=”225850″]Show Answer[/reveal-answer]
[hidden-answer a=”225850″]
Solution
To model a line with a specific slope on a geoboard, we need to know the rise and the run.
| Use the slope formula. | |
| Replace |
So, the rise is unit and the run is
units.
Start at a peg in the lower left of the geoboard. Stretch the rubber band up unit, and then right
units.

The hypotenuse of the right triangle formed by the rubber band represents a line with a slope of .
[/hidden-answer]
try it
Use a geoboard to model a line with the given slope: .
[reveal-answer q=”152695″]Show Answer[/reveal-answer]
[hidden-answer a=”152695″]

[/hidden-answer]
Use a geoboard to model a line with the given slope: .
[reveal-answer q=”64394″]Show Answer[/reveal-answer]
[hidden-answer a=”64394″]

[/hidden-answer]
example
Use a geoboard to model a line with slope
[reveal-answer q=”953715″]Show Answer[/reveal-answer]
[hidden-answer a=”953715″]
Solution
| Use the slope formula. | |
| Replace |
So, the rise is and the run is
.
Since the rise is negative, we choose a starting peg on the upper left that will give us room to count down. We stretch the rubber band down unit, then to the right
units.
The hypotenuse of the right triangle formed by the rubber band represents a line whose slope is .
[/hidden-answer]
try it
Use a geoboard to model a line with the given slope: .
[reveal-answer q=”99402″]Show Answer[/reveal-answer]
[hidden-answer a=”99402″]

[/hidden-answer]
Use a geoboard to model a line with the given slope: .
[reveal-answer q=”714001″]Show Answer[/reveal-answer]
[hidden-answer a=”714001″]

[/hidden-answer]
Now we’ll look at some graphs on a coordinate grid to find their slopes. The method will be very similar to what we just modeled on our geoboards.
To find the slope, we must count out the rise and the run. But where do we start?
We locate any two points on the line. We try to choose points with coordinates that are integers to make our calculations easier. We then start with the point on the left and sketch a right triangle, so we can count the rise and run.
example
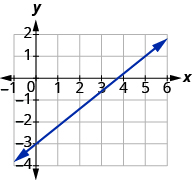
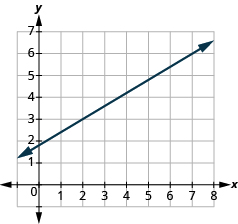
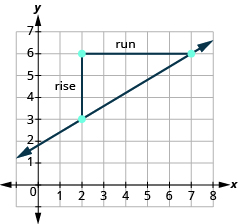
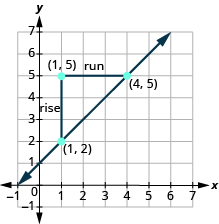
Find the slope of the line shown:
Solution
Locate two points on the graph, choosing points whose coordinates are integers. We will use and
.
Starting with the point on the left, , sketch a right triangle, going from the first point to the second point,
.
 | |
| Count the rise on the vertical leg of the triangle. | The rise is |
| Count the run on the horizontal leg. | The run is |
| Use the slope formula. | |
| Substitute the values of the rise and run. | |
| The slope of the line is |
Notice that the slope is positive since the line slants upward from left to right.
try it
[ohm_question]147014[/ohm_question]
Find the slope from a graph
- Locate two points on the line whose coordinates are integers.
- Starting with the point on the left, sketch a right triangle, going from the first point to the second point.
- Count the rise and the run on the legs of the triangle.
- Take the ratio of rise to run to find the slope.
example
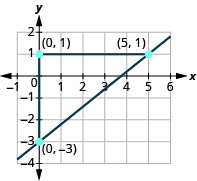
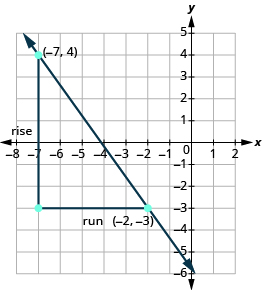
Find the slope of the line shown:
[reveal-answer q=”966343″]Show Answer[/reveal-answer]
[hidden-answer a=”966343″]
Solution
Locate two points on the graph. Look for points with coordinates that are integers. We can choose any points, but we will use and
. Starting with the point on the left, sketch a right triangle, going from the first point to the second point.
 | |
| Count the rise – it is negative. | The rise is |
| Count the run. | The run is |
| Use the slope formula. | |
| Substitute the values of the rise and run. | |
| Simplify. | |
| The slope of the line is |
[/hidden-answer]
Notice that the slope is negative since the line slants downward from left to right.
What if we had chosen different points? Let’s find the slope of the line again, this time using different points. We will use the points and
.
Starting at , sketch a right triangle to
.
| Count the rise. | The rise is |
| Count the run. | The run is |
| Use the slope formula. | |
| Substitute the values of the rise and run. | |
| Simplify the fraction. | |
| The slope of the line is |
It does not matter which points you use—the slope of the line is always the same. The slope of a line is constant!
try it
[ohm_question]147015[/ohm_question]
The lines in the previous examples had -intercepts with integer values, so it was convenient to use the y-intercept as one of the points we used to find the slope. In the next example, the
-intercept is a fraction. The calculations are easier if we use two points with integer coordinates.
example
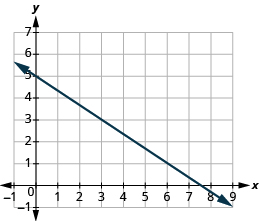
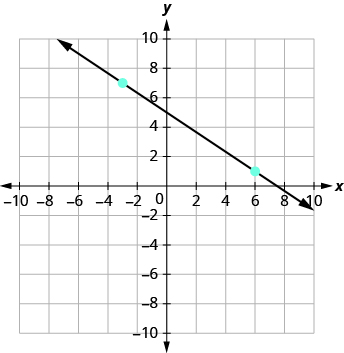
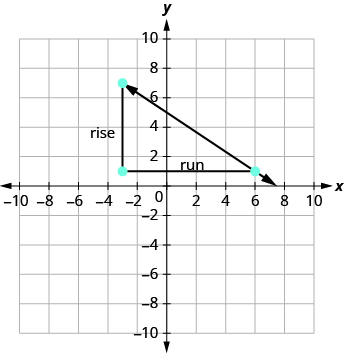
Find the slope of the line shown:
[reveal-answer q=”439279″]Show Answer[/reveal-answer]
[hidden-answer a=”439279″]
Solution
| Locate two points on the graph whose coordinates are integers. | |
| Which point is on the left? | |
| Starting at |
 | |
| Count the rise. | The rise is |
| Count the run. | The run is |
| Use the slope formula. | |
| Substitute the values of the rise and run. | |
| The slope of the line is |
[/hidden-answer]
try it
[ohm_question]147016[/ohm_question]
In the following video we show another example of how to find the slope of a line given a graph. This graph has a positive slope.
")
A YouTube element has been excluded from this version of the text. You can view it online here: http://pb.libretexts.org/afm-2/?p=120
In the following video we show another example of how to find the slope of a line given a graph. This graph has a negative slope.
")
A YouTube element has been excluded from this version of the text. You can view it online here: http://pb.libretexts.org/afm-2/?p=120
Sometimes we need to find the slope of a line between two points and we might not have a graph to count out the rise and the run. We could plot the points on grid paper, then count out the rise and the run, but there is a way to find the slope without graphing.
Before we get to it, we need to introduce some new algebraic notation. We have seen that an ordered pair gives the coordinates of a point. But when we work with slopes, we use two points. How can the same symbol
be used to represent two different points?
Mathematicians use subscripts to distinguish between the points. A subscript is a small number written to the right of, and a little lower than, a variable.
We will use to identify the first point and
to identify the second point. If we had more than two points, we could use
, and so on.
To see how the rise and run relate to the coordinates of the two points, let’s take another look at the slope of the line between the points and
below.
Since we have two points, we will use subscript notation.
On the graph, we counted the rise of . The rise can also be found by subtracting the
of the points.
We counted a run of . The run can also be found by subtracting the
.
| We know | |
| So | |
| We rewrite the rise and run by putting in the coordinates. | |
| But and So we can rewrite the rise using subscript notation. | |
| Also and So we rewrite the run using subscript notation. |
We’ve shown that is really another version of
. We can use this formula to find the slope of a line when we have two points on the line.
Slope Formula or rate of Change formula
The slope of the line between two points and
is
Say the formula to yourself to help you remember it:
example
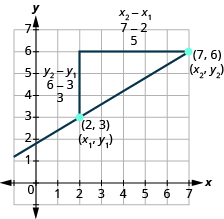
Find the slope of the line between the points and
.
Solution
| We’ll call | |
| Use the slope formula. | |
| Substitute the values in the slope formula: | |
| Simplify the numerator and the denominator. | |
Let’s confirm this by counting out the slope on the graph.
The rise is and the run is
, so
try it
[ohm_question]147021[/ohm_question]
How do we know which point to call #1 and which to call #2? Let’s find the slope again, this time switching the names of the points to see what happens. Since we will now be counting the run from right to left, it will be negative.
| We’ll call | |
| Use the slope formula. | |
| Substitute the values in the slope formula: | |
| Simplify the numerator and the denominator. | |
The slope is the same no matter which order we use the points.
example
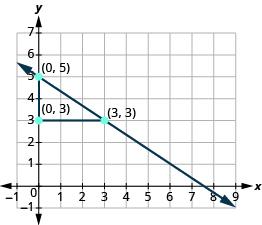
Find the slope of the line through the points and
.
[reveal-answer q=”265532″]Show Answer[/reveal-answer]
[hidden-answer a=”265532″]
Solution
| We’ll call | |
| Use the slope formula. | |
| Substitute the values | |
| Simplify. | |
Let’s confirm this on the graph shown.
[/hidden-answer]
try it
[ohm_question]147022[/ohm_question]
Watch this video to see more examples of how to determine slope given two points on a line.

A YouTube element has been excluded from this version of the text. You can view it online here: http://pb.libretexts.org/afm-2/?p=120
- Prealgebra. Provided by: OpenStax. License: CC BY: Attribution. License Terms: Download for free at http://cnx.org/contents/caa57dab-41c...cda5519c@9.757