
20.5: Step-by-step guide to conversion optimisation
- Page ID
- 24988

Proper planning is important to achieving success with your conversion optimisation. Whatever the outcome of your test, if you’ve planned and documented carefully, you’ll always learn something.
The basic approach to conversion optimisation is:
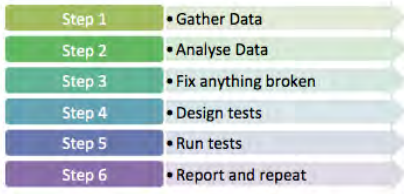
Step 1. Gather data
The very first step is to gather data about the site you are testing so that you can make smart decisions about what to test and how. There are many sources that can be used, depending on the nature of the site that you are testing. Of course, you also need to know the business for which you are testing, what do you want website visitors to do?
- Analytics data: Existing web analytics data can be used to determine which pages in your site should be tested. You can also gather data about particular pages on your site using tools such as Crazy Egg (www.crazyegg. com) or ClickTale (www.clicktale.com).
- User data: User labs or simple site surveys (www.kissmetrics.com is a useful tool for these) can also be used to add qualitative data to the quantitative data gathered using web analytics tools.
- Customer service data: If you are running tests for a site where users also speak to customer service, you can gather data about the site from customer service representatives. They should have information on common reasons why visitors make a phone call. Your CRM system may also hold some valuable data.
Step 2. Analyse
Having gathered data, you need to analyse it intelligently so that you can start designing tests. There are some key questions that you need to answer at this stage.
What should users be doing on the site?
This is where you look at the actual conversion. Usually, this is an action taken by a user that increases revenue for a business. There are obvious conversions to look at, such as placing an order or completing a lead generation form. However, it can also be useful to understand less obvious conversions, or micro-conversions.
You could run a test to see what would reduce the bounce rate of a page. The aim of an online bookstore is to sell books, but they could also test to increase newsletter signups, and focus on selling books later. Micro-conversions can also refer to the path to conversion. Often, there are established steps a visitor should take in the conversion process. Conversion optimisation can look at each step. The Visitor Flow report in Google Analytics can be a great help in providing this insight. Knowing what actions or conversions you are testing is about knowing the business and its website well.
Who is coming to the site, and why?
To understand who is coming to the website, and why, you need to look at data that tells you about your visitors and about how they got to your website. Visitor information includes their location and richer demographic information, such as age and income, if available. Another key point to look at is the type of device they use, desktop, tablet, or mobile phone, for example.
To understand why these visitors come to your website, you need to be able to analyse your sources of traffic. The search keywords sending you traffic should tell you something about the intent of your visitors, for example.
What are they doing on your site?
Of course, now you need to understand what your visitors are doing, and why they’re not doing what you want them to do. Here you need to look at metrics such as bounce rate and exit rate for important pages. As well as examining your overall conversion rate, look at the steps in the process and see where those drop offs occur.
Look at which page is the most visited landing page, especially as this may not be the home page. Look to see which pages are exit pages, and determine if those should be the last pages a user sees on your site. You can use internal site search information to see if visitors are looking for particular information on your website.
Step 3. Fix anything that’s broken
As part of your analysis, you may have identified problems that can be fixed without testing. Before you continue, fix these! You should also try to understand if there is traffic coming to your site that is not relevant, and try to segment that traffic from your calculations.
For example, if you have a beautifully designed website that sells custom couches, but is featured in a website design gallery, you may get a lot of traffic that is coming only to look at your site, and not to buy couches.
Step 4. Design tests
By now you should know what areas of your site need testing, so it’s time to design tests.
Wishpond (2016), provides
The 3 Step formula for creating an A/B Testing Hypothesis. These are:
Step 1: Conversion problem
Why aren’t people converting?
Step 2: Proposed solution
What tests can be run to fix the conversion problem?
Step 3: Impact statement
How do you anticipate your proposed solution will affect the conversion problem.
You now have a sound A/B testing hypothesis.
Step 5. Run tests
Implement the tracking code needed to run your tests. Most testing software uses cookies to ensure that return visitors see the same version of the test they saw initially. You will also need to put tracking code on your conversion page. Before taking your test live, test to make sure that the tracking code does not conflict with any other code on your website.
If everything checks out, take your test live, and wait for the data to be collected. Check in regularly to see how the test is proceeding, and wait for a statistically significant outcome.
Step 6. Report and repeat
When you have a result, it’s time to report on it. Refer back to your null hypothesis to determine if the outcome was as expected and if it was statistically significant. In your report, you should include why things went as expected, or why not.
Implement the better-performing solution, and plan your next test. There is always something you can improve.