15.2: Duration and Extent of Electricity Infrastructure
- Page ID
- 21202

The electricity infrastructure includes generators (power plants), transmission lines, substations, distribution lines, transformers, control devices and users (Figure 15.2.1). There is also supply chain infrastructure required for electricity supply, such as the mining and transportation of coal to power plants for combustion.
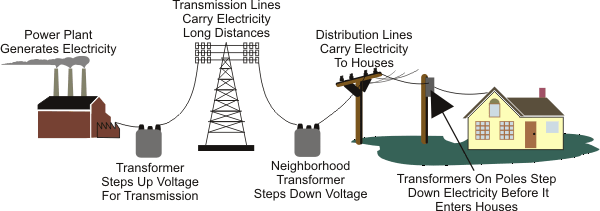
Table 15.2.1 indicates the 2015 numbers and capacity of electricity generators in the US. The average generator has a rated capacity of 1,167,365MW/20,068 generators = 58 MW. Generation plants themselves can have long lives, with dams and power plant structures lasting for many decades. Operating equipment such as turbines have much shorter useful lives and must be replaced regularly in power plants. There is a trend for increasing reliance on natural gas and other renewable sources of energy and less reliance on coal due to environmental concerns and the relative prices of different sources.
Table 15.2.1: Summary of Power Generation
Statistics
| Fuel Source | Generators | Nameplate Capacity (MW) | Summer Capacity (MW) | Winter Capacity (MW) |
| Coal | 968.00 | 304,789.80 | 279,719.90 | 281,105.80 |
| Hydroelectric | 4,176.00 | 100,529.60 | 102,239.30 | 101,535.20 |
| Natural Gas | 5,717.00 | 503,822.70 | 439,320.80 | 472,388.40 |
| Nuclear | 99.00 | 103,860.40 | 98,672.00 | 101,001.40 |
| Other | 407.00 | 8,557.50 | 6,585.30 | 6,859.70 |
| Other Gas | 1,778.00 | 5,154.70 | 4,681.90 | 4,710.20 |
| Other Renewable | 623.00 | 11,177.70 | 9,768.30 | 9,877.40 |
| Petroleum | 3,550.00 | 42,321.30 | 36,830.30 | 40,372.60 |
| Solar | 1,652.00 | 13,758.30 | 13,663.30 | 13,427.00 |
| Wind | 1,098.00 | 73,393.20 | 72,573.40 | 72,675.80 |
| Grand Total | 20,068.00 | 1,167,365.20 | 1,064,054.50 | 1,103,953.50 |
Source: US Energy Information Administration, Form EIA-860, 2016. Public Domain. www.eia.gov/electricity/data/eia860/
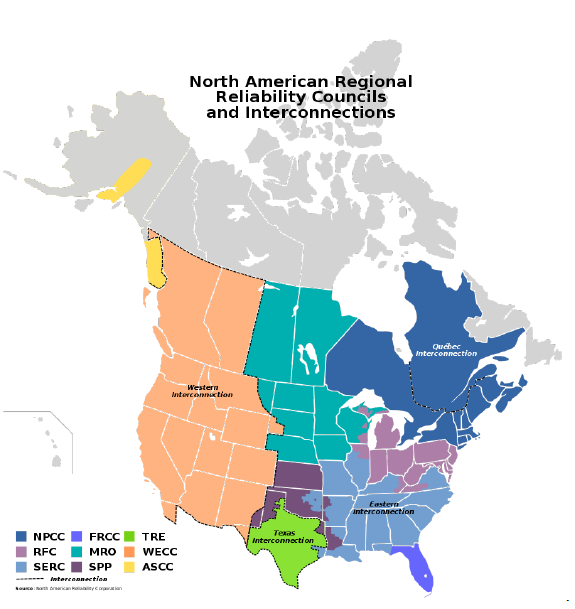
Generated power from turbines is normally transmitted as 3-phase alternating current. As a result, transmission lines usually provide three separate wires, one for each phase. Transmission lines are quite extensive throughout the United States, although congestion in some portions of the network is increasing. The US is divided into three major power grids (Figure 15.2.2), plus separate grids for Alaska, Hawaii,and other territories. As of 2015, the US bulk electric distribution system consists of more than 360,000 miles of transmission lines including 180,000 miles of high-voltage AC transmission (Energy, 2015).
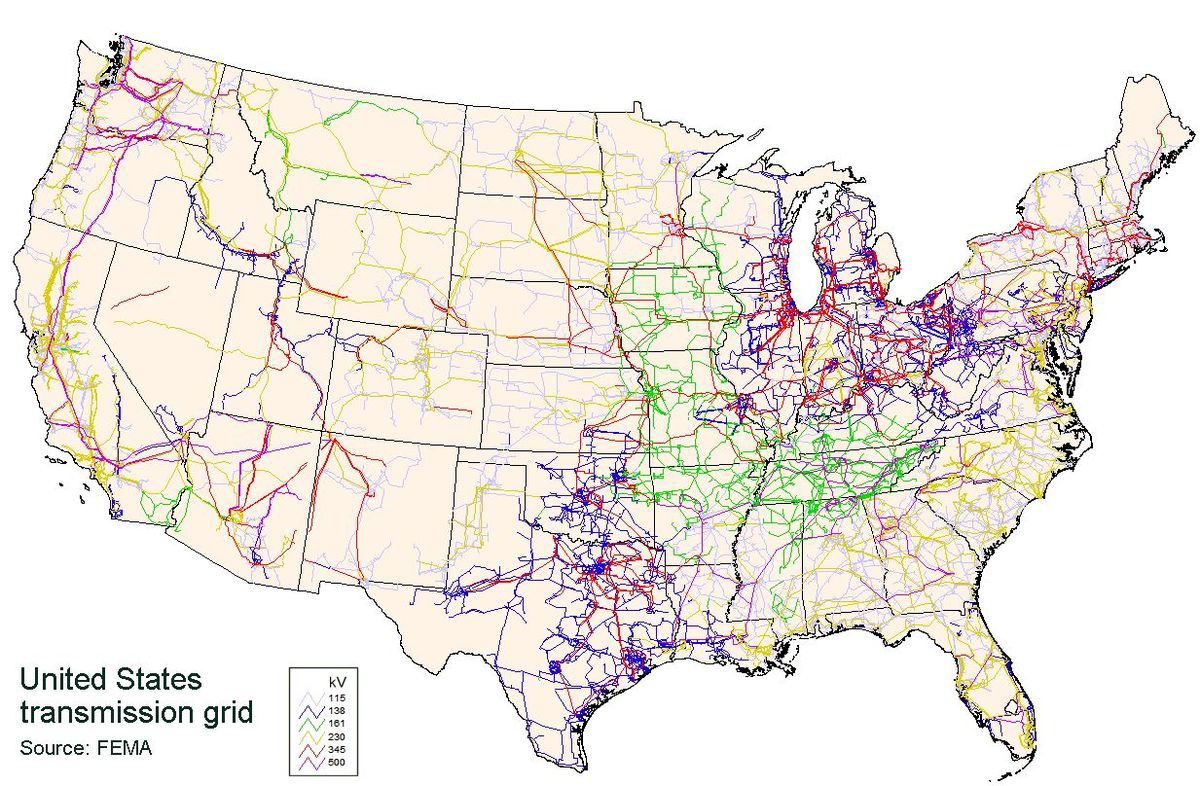
Electric power distribution across the contiguous United States occurs through the operations of some 500 individual companies. Figure 15.2.3 below illustrates pre-2008 transmission grid voltage and density.
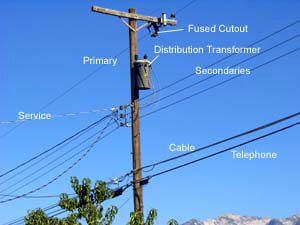
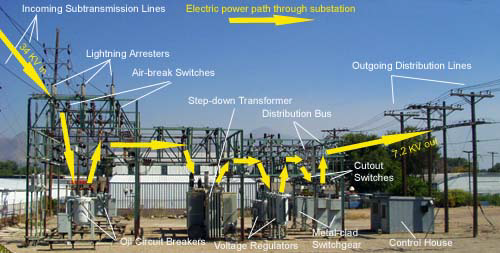
From the transmission lines, substations typically step-down the voltage for distribution to end-users (Figure 15.2.4). Large users such as industries or military bases might have their own substations.
Distribution to customers involves transformations to reduce voltage (to a common level of 240 or 120 V) and to provide single-phase alternating current. Tele-communications and electricity service generally share the same telephone poles or underground pipes. For safety reasons, electricity service occupies the highest portion of the common telephone pole (Figure 15.2.5). Local transformers reduce voltage to residential service levels.