11.4: Some Infrastructure Management Issues for Roadways
- Page ID
- 21176

Roadways provided an application domain for the early development of asset and infrastructure management methods and systems. Since roadways are so widespread and long-lasting, adopting a life cycle viewpoint for design and maintenance decisions has been widespread but not universal. Bridge and road management systems are among the best developed software systems to aid infrastructure management. Examples include the Pontis bridge management system from AASHTO (1997), PAVER from the USACOE (Shahin, 2016), and HDM from the World Bank (Watanatada, 1987). Each of these tools involves comprehensive inspection and inventory data gathering as well as aids for decision making. The tools evolve with changing needs, conditions, more experience, and more research.
Roadway congestion is a continuing cost and difficulty with roadway management throughout the world. As shown in Figure 11.4.1, even inter-urban roadways are showing the effects of congestion.
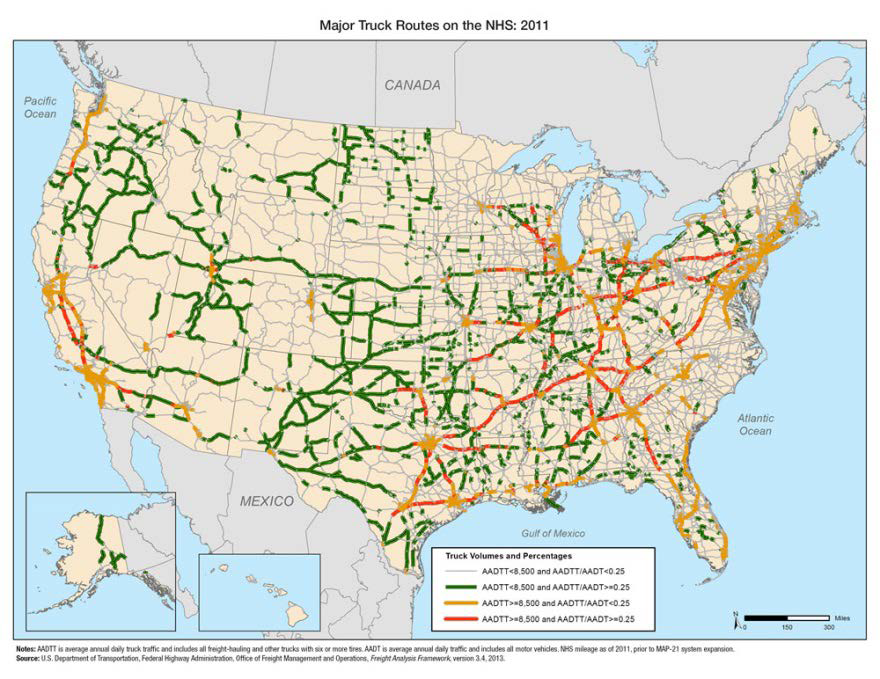
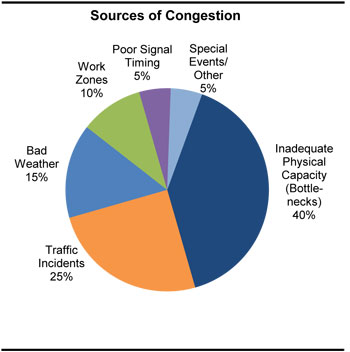
Figure 11.4.2 shows the different sources of roadway congestion in the US. The largest category is bottleneck roadway sections, followed by traffic incidents (such as vehicle breakdowns or crashes), and bad weather (such as snow or flooding). Work zones for roadway management activities are also a major source of congestion.
Roadway renovation is a continuing problem in many countries. Projects are expensive and disrupt normal travel patterns. Novel contracting schemes to speed projects have been introduced, such as charging for closure of roadways per day. New materials can also reduce the costs of renovation.
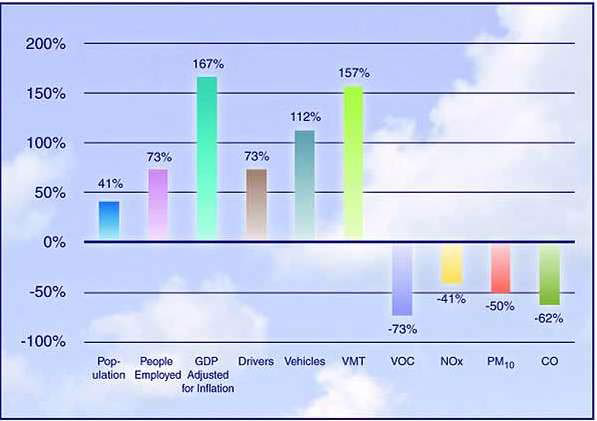
Environmental concerns for roadways are becoming more common. The costs associated with urban sprawl and climate change reflect the dependence on motor vehicles and petroleum fuels. While there has been considerable success in reducing conventional air emissions from motor vehicles (Figure 11.4.3), greenhouse gas emissions are a major concern. This concern has resulted in new greenhouse gas emissions standards as well as promotion of alternative fuels such as battery electric vehicles powered by renewable power generation.
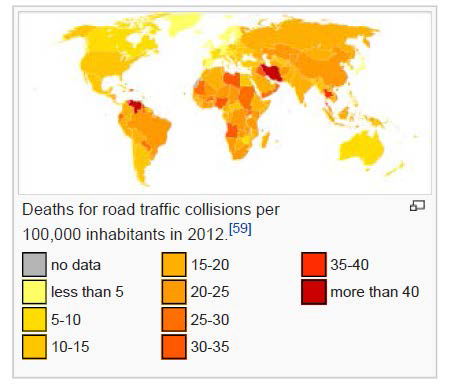
Safety also remains a significant issue for roadway infrastructure. Figure 11.4.4 shows fatality rates per capita in different countries of the world. Countries clearly differ in the risk of vehicle crashes. For roadway management purposes, normalization by vehicle miles of travel is likely more useful than fatalities per capita as in Figure 11.4.4. However, many countries do not report total vehicle miles of travel.