
12.3: Diversity and the Workforce
- Page ID
- 12984

- How diverse is the workforce?
In 1997, researchers estimated that by the year 2020, 14% of the workforce would be Latino, 11% Black, and 6% Asian.10 Because of an increase in the number of racial minorities entering the workforce over the past 20 years, most of those projections have been surpassed as of 2016, with a workforce composition of 17% Hispanic or Latino of any race, followed by 12% Black and 6% Asian (see Exhibit 12.2). American Indians, Alaska Natives, Native Hawaiians, and Other Pacific Islanders together made up a little over 1% of the labor force, while people of two or more races made up about 2% of the labor force.11 Women constitute approximately 47% of the workforce compared to approximately 53% for men,12 and the average age of individuals participating in the labor force has also increased because more employees retire at a later age.13 Although Whites still predominantly make up the workforce with a 78% share,14 the U.S. workforce is becoming increasingly more diverse, a trend that presents both opportunities and challenges. These demographic shifts in the labor market affect the workforce in a number of ways due to an increasing variety of workers who differ by sex, race, age, sexual orientation, disability status, and immigrant status.
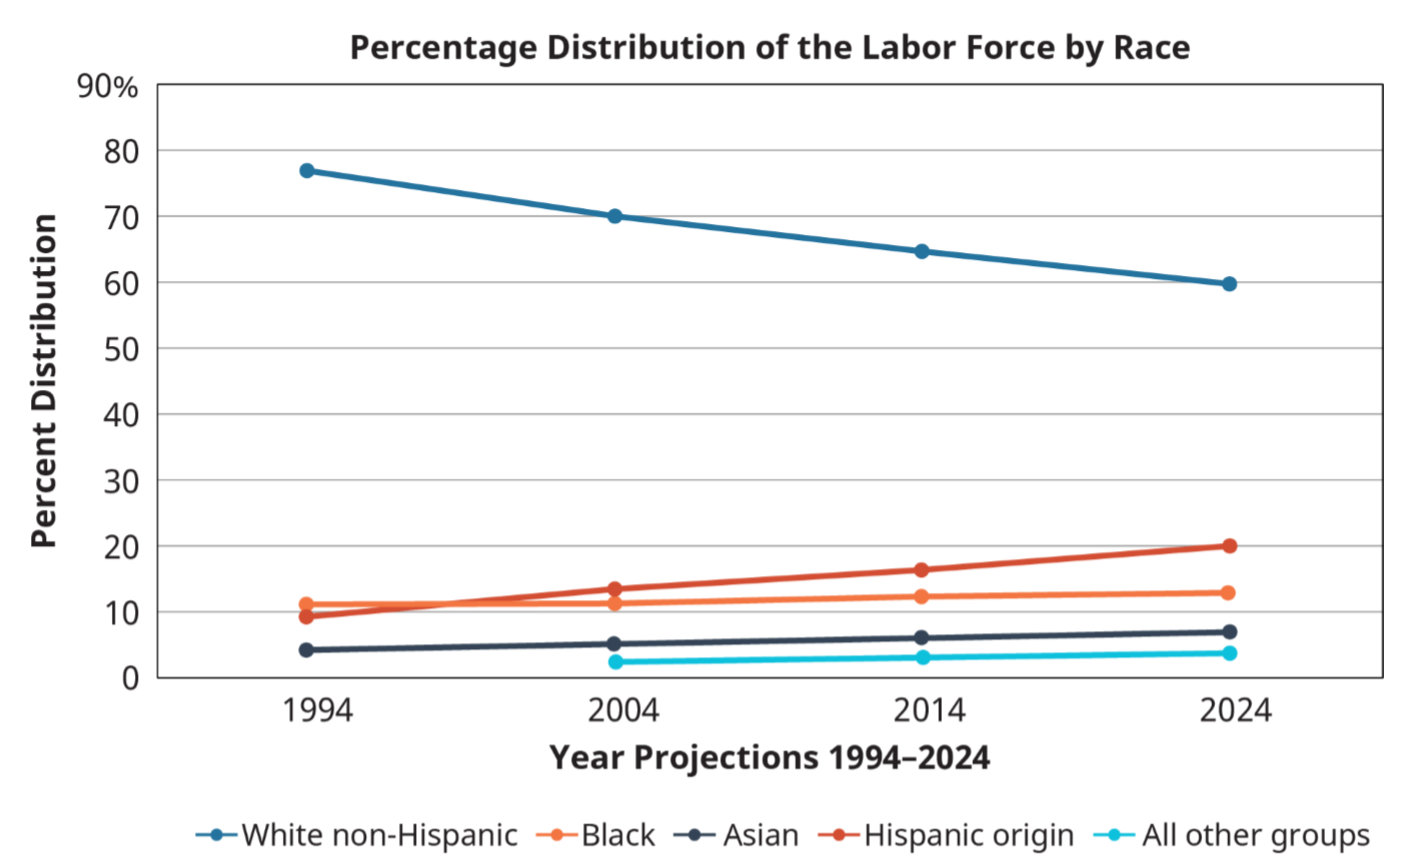
Exhibit 12.2 Percentage distribution of the labor force by race (Attribution: Copyright Rice University, OpenStax, under CC-BY 4.0 license)
Gender
Increasingly more women are entering the workforce.15 Compared to 59% in 1977, the labor force participation rate for men is now approximately 53% and is expected to decrease through 2024 to 52%.16 As the labor force participation rate decreases for men, the labor force growth rate for women will be faster. Their percentage of the workforce has steadily risen, as can be seen in Exhibit 12.3, which compares the percentage of the workforce by gender in 1977 to 2017.17
Although more women are entering the labor force and earning bachelor’s degrees at a higher rate than men,18 women still face a number of challenges at work. The lack of advancement opportunities awarded to qualified women is an example of a major challenge that women face called the glass ceiling,19 which is an invisible barrier based on the prejudicial beliefs that underlie organizational decisions that prevent women from moving beyond certain levels within a company. Additionally, in organizations in which the upper-level managers and decision makers are predominantly men, women are less likely to find mentors, which are instrumental for networking and learning about career opportunities. Organizations can mitigate this challenge by providing mentors for all new employees. Such a policy would help create a more equal playing field for all employees as they learn to orient themselves and navigate within the organization.
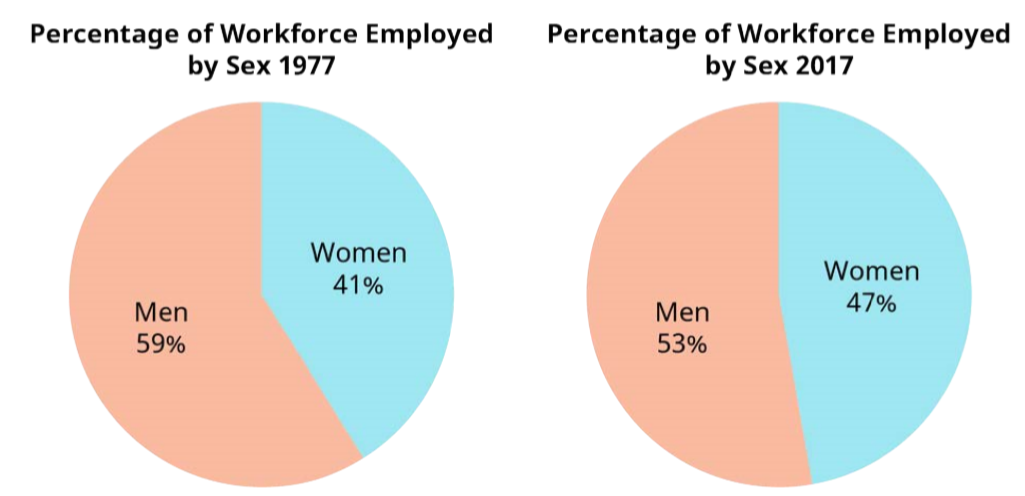
Exhibit 12.3 Percentage Distribution of the Labor Force by Sex (Attribution: Copyright Rice University, OpenStax, under CC-BY 4.0 license)
One factor that greatly affects women in organizations is sexual harassment. Sexual harassment is illegal, and workers are protected from it by federal legislation.20 Two forms of sexual harassment that can occur at work are quid pro quo and hostile environment.21 Quid pro quo harassment refers to the exchange of rewards for sexual favors or punishments for refusal to grant sexual favors. Harassment that creates a hostile environment refers to behaviors that create an abusive work climate. If employees are penalized (for example by being demoted or transferred to another department) for refusing to respond to repeated sexual advances, quid pro quo sexual harassment has taken place. The telling of lewd jokes, the posting of pornographic material at work, or making offensive comments about women in general are actions that are considered to create a hostile work environment. According to the Equal Employment Opportunity Commission, sexual harassment is defined as the “unwelcome sexual advances, requests for sexual favors, and other verbal or physical harassment of a sexual nature. Harassment can also include offensive remarks about a person’s sex.”22 Although both men and women can be sexually harassed, women are sexually harassed at work more often.23 In addition, Black and other minority women are especially likely to be subjected to sexual discrimination and harassment.24

Exhibit 12.4 Tamara Johnson The treatment of women in business has become a hot topic in corporate boardrooms, human resources departments, and investment committees. Tamara Johnson, who is profiled in the opening feature to this chapter, moves beyond simply acknowledging widespread discrimination to focusing on solutions. Also on the agenda: the need to improve diversity and inclusion across the board and breaking through the glass ceiling. (Credit: Tamara Johnson/ Attribution 2.0 Generic (CC BY 2.0))
Because employees who experience sexual harassment are more likely to quit their jobs and experience emotional distress that can negatively impact their performance,25 it is in the organization’s best interest to prevent sexual harassment at work from occurring. Ways to do this include companies providing ongoing (e.g., annual) training so that employees are able to recognize sexual harassment. Employees should know what constitutes acceptable and unacceptable behavior and what channels and protocols are in place for reporting unacceptable behaviors. Managers should understand their role and responsibilities regarding harassment prevention, and a clear and understandable policy should be communicated throughout the organization.
Race
Another important demographic shift in workforce diversity is the distribution of race. (Note that we are using categories defined by the U.S. Census Bureau. It uses the term “Black (African-American)” to categorize U.S. residents. In this chapter, we use the term “Black.”)
While the White non-Hispanic share of the workforce continues to shrink, the share of racial and ethnic minority groups will continue to grow.26 Specifically, Hispanics and Asians will grow at a faster rate than other racial minorities, and Hispanics are projected to make up almost one-fifth of the labor force by 2024.27 The projected changes in labor force composition between 2014 and 2024 are as follows:
White non-Hispanic participation in the labor force will decline by 3%. Other groups’ share of the labor force is expected to increase: Black (10.1%), Hispanic (28%), Asian (23.2%), and Other groups (i.e., multiracial, American Indian, Alaska Native, Native Hawaiian, and Other Pacific Islanders) labor force share is expected to increase by 22.2%.28 With the workforce changing, managers will need to be mindful of issues employees encounter that are uniquely tied to their experiences based on race and ethnicity, including harassment, discrimination, stereotyping, and differential treatment by coworkers and decision makers in organizations.
Discrimination Against Black Employees
Race is one of the most frequent grounds for discrimination.29 Although Blacks do not make up the largest share of the workforce for racial minorities, research studies show they face discrimination more often than other racial minorities. As a matter of fact, some experts believe that hiring discrimination against Blacks has not declined over the past 25 years while workplace discrimination against other racial minority groups has declined.30
Discrimination in the Sharing Economy—#AirbnbWhileBlack
Airbnb, a popular home-sharing website founded in San Francisco in 2008, offers millions of homes for short-term rental in more than 190 countries. This company has revolutionized the sharing economy in the same way that ride-sharing services such as Uber and Lyft have, and according to the company, the site’s drive to connect hosts and potential renters has been able to contribute to the quality of life of both homeowners and travelers. According to Airbnb’s press releases and information campaigns, their services can reduce housing costs for travelers on a budget and can provide unique experiences for adventurous travelers who wish to have the flexibility to experience a city like a local. The organization also claims that most of its users are homeowners looking to supplement their incomes by renting out rooms in their homes or by occasionally renting out their whole homes. According to a statement, most of the listings on the site are rented out fewer than 50 nights per year.
Despite the carefully crafted messages Airbnb has presented to the public, in 2016 the company came under intense scrutiny when independent analyses by researchers and journalists revealed something startling: While some Airbnb hosts did in fact use the services only occasionally, a significant number of hosts were using the services as though they were hotels. These hosts purchased a large number of properties and continuously rented them, a practice that affected the availability of affordable housing in cities and, because these hosts were not officially registered as hoteliers, made it possible for Airbnb hosts to avoid paying the taxes and abiding by the laws that hotels are subject to.
Title II of the Civil Rights Act of 1964 mandates that hotels and other public accommodations must not discriminate based on race, national origin, sex, or religion, and Title VIII of the Civil Rights Act of 1968 (also known as the Fair Housing Act [FHA]) prohibits discrimination specifically in housing. However, Airbnb’s unique structure allows it to circumvent those laws. The company also claims that while it encourages hosts to comply with local and federal laws, it is absolved from responsibility if any of its hosts break these laws. In 2017, researcher Ben Edelman conducted a field experiment and found that Airbnb users looking to rent homes were 16% less likely to have their requests to book accepted if they had traditionally African American sounding names like Tamika, Darnell, and Rasheed.
These findings, coupled with a viral social media campaign, #AirbnbWhileBlack, in which users claimed they were denied housing requests based on their race, prompted the state of California’s Department of Fair Employment and Housing (DFEH) to file a complaint against the company. In an effort to resolve the complaint, Airbnb reported banning any hosts who were found to have engaged in discriminatory practices, and they hired former U.S. Attorney General Eric Holder and former ACLU official Laura Murphy to investigate any claims of discrimination within the company.31 In 2016, Airbnb released a statement outlining changes to company practices and policies to combat discrimination, and while they initially resisted demands by the DFEH to conduct an audit of their practices, the company eventually agreed to an audit of roughly 6,000 of the hosts in California who have the highest volume of properties listed on the site.
Sources: AirBnB Press Room, accessed December 24, 2018, https://press.atairbnb.com/about-us/; “Airbnb's data shows that Airbnb helps the middle class. But does it?”, The Guardian, accessed December 23, 2018, www.theguardian.com/technolo...vention-survey ; and Quittner, Jeremy, “Airbnb and Discrimination: Why It’s All So Confusing”, Fortune, June 23, 2016, http://fortune.com/2016/06/23/airbnb...mination-laws/.
Discussion Questions
- What are some efforts companies in the sharing economy can take before problems of discrimination threaten to disrupt operations?
- Should Airbnb be held responsible for discriminatory actions of its hosts?
Currently, White men have higher participation rates in the workforce than do Black men,32 and Black women have slightly higher participation rates than White women.33 Despite growth and gains in both Black education and Black employment, a Black person is considerably more likely to be unemployed than a White person, even when the White person has a lower level of education34 or a criminal record.35
Blacks frequently experience discrimination in the workplace in spite of extensive legislation in place to prohibit such discrimination. Research has shown that stereotypes and prejudices about Blacks can cause them to be denied the opportunity for employment when compared to equally qualified Whites.36 It is estimated that about 25% of businesses have no minority workers and another 25% have less than 10% minority workers.37 In terms of employed Blacks, research has shown that, regardless of managers’ race, managers tended to give significantly higher performance ratings to employees who were racially similar to them. Because Whites are much more likely to be managers than Blacks, this similarity effect tends to advantage White employees over Black employees.38 Blacks are also significantly more likely to be hired in positions that require low skills, offer little to no room for growth, and pay less. These negative employment experiences affect both the mental and physical health of Black employees.39
Hispanics
Hispanics are the second-fastest-growing minority group in the United States behind Asians,40 and they make up 17% of the labor force.41 Despite this and the fact that Hispanics have the highest labor participation rate of all the minority groups, they still face discrimination and harassment in similar ways to other minority groups.
Hispanics can be of any race.42 As a matter of fact, increasingly more Hispanics are identifying racially as White. In 2004 almost half of Hispanics identified themselves racially as White, while just under half identified themselves as “some other race.”43 More than 10 years later, approximately 66% of Hispanics now identify themselves racially as White while only 26% identify themselves as “some other race.”44 The remaining Hispanic population, totaling approximately 7%, identify as either Black, American Indian, Asian, Alaskan Native, Pacific Islander, or Native Hawaiian.45
Why would a minority identity group identify racially as White? A Pew study found that the longer Hispanic families lived in the United States, the more likely they were to claim White as their race even if they had not done so in the past.46 This suggests that upward mobility in America may be perceived by some Hispanics to be equated with “Whiteness.”47 Consequently, Hispanics who self-identify racially as White experience higher rates of education and salary, and lower rates of unemployment.48 Additionally, only 29% of Hispanics polled by the Pew Hispanic Center believe they share a common culture.49 According to the Pew Research Center, this finding may be due to the fact that the Hispanic ethnic group in the United States is made up of at least 14 Hispanic origin groups (such as Puerto Rican, Cuban, Spanish, Mexican, Dominican, and Guatemalan, among many others).50 Each of these groups has its own culture with different customs, values, and norms.
These cultural differences among the various Hispanic groups, combined with different self-perceptions of race, may also affect attitudes toward their workplace environment. For example, one study found that the absenteeism rate among Blacks was related to the level of diversity policies and activities visible in the organization, while the absenteeism rate among Hispanics was similar to that of Whites and not related to those diversity cues.51 Results from this study suggest that managers need to be aware of how diversity impacts their workplace, namely addressing the relationship between Hispanic job seekers or workers and organizational outcomes concerning diversity policies as it may differ from that of other racial minorities.
Asians
Asians are the fastest-growing ethnic group in the United States, growing 72% between 2000 and 2015.52 Compared to the rest of the U.S. population overall, households headed by Asian Americans earn more money and are more likely to have household members who hold a bachelor’s degree.53 However, there is a wide range of income levels among the Asian population that differs between the more than 19 groups of Asian origin in the United States.54
Similar to other racial and ethnic minority groups, Asians are stereotyped and face discrimination at work. Society through media often stereotypes Asian men as having limited English-speaking skills and as being highly educated, affluent, analytical, and good at math and science.55 Asian women are often portrayed as weak and docile.56 For Asian women, and other minority women as well, social stereotypes depicting them as exotic contribute to reports of sexual harassment from women minority groups.57
The 5model minority myth58 is a reflection of perceptions targeting Asians and Asian Americans that contrast the stereotypes of “conformity” and “success” of Asian men with stereotypes of “rebelliousness” and “laziness” of other minority men. It also contrasts the stereotyped “exotic” and “obedient” nature of Asian women against the stereotypical beliefs that White women are “independent” and “pure.”59 These perceptions are used not only to invalidate injustice that occurs among other racial minorities, but also to create barriers for Asians seeking leadership opportunities as they are steered toward “behind the scenes” positions that require less engagement with others. These stereotypes also relegate Asian women into submissive roles in organizations, making it challenging for Asian men and women to advance in rank at the same rate as White male employees.60
Multiracial
Although the U.S. Census Bureau estimates that approximately 2% of the U.S. population describes themselves as belonging to more than one race, the Pew Research Center estimates that number should be higher, with around 7% of the U.S. population considered multiracial.61 This is due to the fact that some individuals may claim one race for themselves even though they have parents from different racial backgrounds. To complicate matters even more, when collecting data from multiracial group members, racial identity for individuals in this group may change over time because race is a social construct that is not necessarily based on a shared culture or country of origin in the same way as ethnicity. As a result, multiracial individuals (and Hispanics) have admitted to changing their racial identity over the course of their life and even based on the situation. Approximately 30% of multiracial individuals polled by the Pew Research Center say that they have varied between viewing themselves as belonging to one race or belonging to multiple races. Within the group polled, the order in which they first racially identified as belonging to one racial group versus belonging to more than one group varied.62
Despite the fact that multiracial births have risen tenfold between 1970 and 2013,63 their participation in the labor force is only around 2%.64 Additionally, multiracial individuals with a White racial background are still considered a racial minority unless they identify themselves solely as White, and approximately 56% of them on average say they have been subjected to racial jokes and slurs.65 Discrimination also varies when multiracial groups are broken down further, with Black–American Indians having the highest percentage of individuals reporting discrimination and White–Asians having the lowest percentage.66
At work, multiracial employees are sometimes mistaken for races other than their own. If their racial minority background is visible to others, they may experience negative differential treatment. Sometimes they are not identified as having a racial or ethnic minority background and are privy to disparaging comments from unsuspecting coworkers about their own race, which can be demoralizing and can lead to lower organizational attachment and emotional strain related to concealing their identity.67
Other Groups
Approximately 1% of the labor force identifies as American Indian, Alaska Native, Native Hawaiian or Pacific Islander, or some other race.68
Age
The age distribution of an organization’s workforce is an important dimension of workplace diversity as the working population gets older. Some primary factors contributing to an older population include the aging of the large Baby Boomer generation (people born between 1946 and 1964), lower birth rates, and longer life expectancies69 due to advances in medical technology and access to health care. As a result, many individuals work past the traditional age of retirement (65 years old) and work more years than previous generations in order to maintain their cost of living.
Exhibit 12.5 compares the percentage of the population over the age of 65 to those under the age of 18 between 2010 and 2016. The number of older individuals has increased and is projected to reach 20.6% by the year 2030 while the number of younger individuals has steadily decreased within that time period. These numbers imply that organizations will increasingly have employees across a wide range of ages, and crossgenerational interaction can be difficult manage. Although older workers are viewed as agreeable and comfortable to work with, they are also stereotyped by some employees as incompetent70 and less interested in learning new tasks at work compared to younger workers.71 Studies have found support for the proposition that age negatively relates to cognitive functioning.72 However, if managers offer less opportunity to older workers solely because of declining cognitive functioning, it can be detrimental to organizational performance because older workers outperform younger workers on a number of other job performance measures. Compared to younger workers, older workers are more likely to perform above their job expectations and follow safety protocols. They are also less likely to be tardy, absent, or abuse drugs or alcohol at work compared to their younger counterparts.
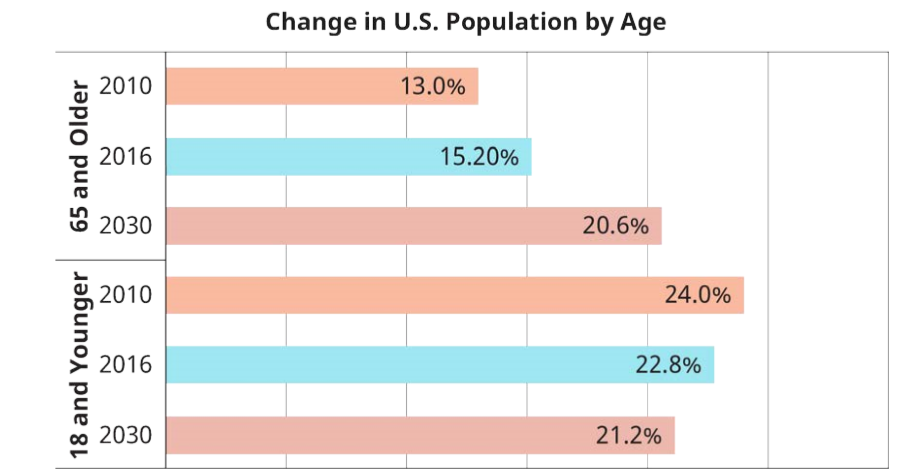
Exhibit 12.5 Change in U.S. population by age (Attribution: Copyright Rice University, OpenStax, under CC-BY 4.0 license)
Sexual Orientation
Sexual orientation diversity is increasing in the workforce.73 However, only 21 states and Washington D.C. prohibit discrimination based on sexual orientation.74 Without federal protection, individuals who do not live in these states could be overlooked for employment or fired for their sexual orientation unless their employer has policies to protect them.75 Many employers are beginning to understand that being perceived as inclusive will make them more attractive to a larger pool of job applicants.76 So although the Civil Rights Act does not explicitly provide federal protection to lesbian, gay, bisexual, and transgender (LGBT) employees, more than half of the Fortune 500 companies have corporate policies that protect sexual minorities from discrimination at work and offer domestic-partner benefits.77
Unfortunately, the percentage of hate crimes relating to sexual orientation discrimination has increased.78 Indeed, LGBT employees are stigmatized so much that in a recent study, researchers found that straight-identifying participants were more attracted to employers with no job security to offer them compared to gay-friendly employers.79 In other words, individuals would waive job security to avoid working with sexual minorities. Also, compared to heterosexuals, sexual minorities have higher education levels80 but still face hiring and treatment discrimination frequently.81
LGBT employees are often faced with the decision of whether or not to be truthful about their sexual orientation at work for fear of being stigmatized and treated unfairly. The decision to not disclose is called passing, and for some it involves a great risk of emotional strain that can affect performance.82 Individuals who pass may distance themselves from coworkers or clients to avoid disclosure about their personal life. This behavior can also result in decreased networking and mentoring opportunities, which over time can limit advancement opportunities. The decision to be transparent about sexual orientation is called revealing.83 Just like passing, revealing has its own set of risks including being ostracized, stigmatized, and subjected to other forms of discrimination at work. However, compared to passing, the benefits of building relationships at work and using their identity as a catalyst for tolerance and progressive organizational change may outweigh the risks when LGBT employees decide to reveal.
Research shows that when local or state laws are passed to prevent sexual orientation discrimination, incidents of workplace discrimination decrease.84 This same effect occurs when firms adopt policies that protect the rights of sexual minority employees.85 By creating a safe and inclusive work environment for LGBT employees, companies can create a culture of tolerance for all employees regardless of their sexual orientation or gender identity.
Blind Recruiting
An increasing number of companies are testing a new and innovative way of recruiting. Blind recruiting is a process by which firms remove any identifying information about applicants during the recruitment process. An example of this may include anonymous applications that omit fields requesting information such as an applicant’s name or age. Using computer application technology, some companies like Google administer surveys to their anonymous applicants that measure the abilities required for the job before they are considered in the next step of the recruitment process. Alternatively, companies may request that applicants remove identifying information such as names and address from their resumes before applying for positions. As resumes are received, hiring managers can assign a temporary identification number.
Although more companies are using this method of recruiting, the idea is not new for symphony orchestras, many of which have been using blind auditioning since the 1970s. In some instances musicians audition behind screens so they are evaluated only by their music. This process removes bias associated with race and gender because the performer cannot be seen and only heard. A study investigating this practice examined 11 symphony orchestras that varied on the use of blind auditions. Researchers found that blind auditions increased the likelihood that a woman would be hired by between 25 and 46%. A recruitment process like this can help organizations attract more candidates, hire the best talent, increase their workplace diversity, and avoid discrimination liability.
Sources: Grothaus, M. (Mar 14 2016). How “blind” recruitment works and why you should consider it. Fast Company. Retrieved from www.fastcompany.com/3057631/...hould-consider; and MIller, C.C. (Feb 25 2016). Is blind hiring the best hiring? The New York Times Magazine. Retrieved from www.nytimes.com/2016/02/28/m...st-hiring.html.
Discussion Questions
- Should all companies use blind recruiting in place of traditional recruiting, or are there exceptions that must be considered?
- If blind recruiting helps eliminate bias during the recruitment process, then what does that say about social media platforms such as Linked In that are commonly used for recruiting applicants? Will using those platforms expose companies to greater liability compared to using more traditional means of recruiting?
- How does blind recruiting help organizations? How may it hinder organizations?
Immigrant Workers
Every year a new record is set for the time it takes to reach the U.S. cap of H-1B visas granted to employers.86 H- 1B visas are a type of work visa, a temporary documented status that authorizes individuals to permanently or temporarily live and work in the United States.87 As a result of the demand for work visas by employers, the number of immigrant workers in the U.S. workforce has steadily grown within the last decade from 15% in 2005 to 17% in 2016.88 Compared to those born in the United States, the immigrant population in America is growing significantly faster.89 This is partly because of the U.S. demand for workers who are proficient in math and science90 and wish to work in America.
Although a huge demand for immigrant labor exists in the United States, immigrant labor exploitation occurs, with immigrant employees receiving lower wages and working longer hours compared to American workers.91 Foreign-born job seekers are attracted to companies that emphasize work visa sponsorship for international employees, yet they are still mindful of their vulnerability to unethical employers who may try to exploit them. For example, Lambert and colleagues found that some of the job-seeking MBA students from the Philippines in their study believed that companies perceived to value international diversity and sponsor H-1B visas signaled a company wishing to exploit workers.92 Others believed that those types of companies might yield diminishing returns to each Filipino in the company because their token value becomes limited. In news stories, companies have been accused of drastically shortchanging foreign student interns on their weekly wages.93 In another case, Infosys, a technology consulting company, paid $34 million to settle allegations of visa fraud due to suspicion of underpaying foreign workers to increase profits.94
Other Forms of Diversity at Work
Workers with disabilities are projected to experience a 10% increase in job growth through the year 2022.95 This means that more public and corporate policies will be revised to allow greater access to training for workers with disabilities and employers.96 Also, more companies will use technology and emphasize educating employees about physical and mental disabilities as workplace accommodations are used more often.
In the past, the United States has traditionally been a country with citizens who predominantly practice the Christian faith. However, over the past almost 30 years the percentage of Americans who identify as Christian has significantly decreased—by approximately 12%. Over that same time period, affiliation with other religions overall increased by approximately 25%.97 The increase in immigrant workers from Asian and Middle Eastern countries means that employers must be prepared to accommodate religious beliefs other than Christianity. Although federal legislation protects employees from discrimination on the basis of race, religion, and disability status, many employers have put in place policies of their own to deal with the variety of diversity that is increasingly entering the workforce.
- How is diversity defined in relation to the workplace?
- What are the components that make up a diverse workplace and workforce?
References
10. Judy, R.W., D'Amico, C., & Geipel, G.L.(1997). Workforce 2020: Work and Workers in the 21st Century. Indianapolis, Ind: Hudson Institute.
11. U.S. Bureau of Labor Statistics. (2017). Labor force characteristics by race and ethnicity, 2016. Retrieved from www.bls.gov/opub/reports/rac.../2016/home.htm
12. U.S. Department of Labor, Bureau of Labor Statistics. (2017). Table A-1. Employment status of the civilian population by sex and age. Retrieved from www.bls.gov/news.release/empsit.t01.htm; DeWolf, M. (Mar 1 2017). 12 stats about working women. Retrieved from blog.dol.gov/2017/03/01/12-s...-working-women
13. Toosi, Mitra,"Labor force projections to 2024: the labor force is growing, but slowly," Monthly Labor Review, U.S. Bureau of Labor Statistics, December 2015, doi.org/10.21916/mlr.2015.48.
14. U.S. Bureau of Labor Statistics. (2017). Labor force characteristics by race and ethnicity, 2016. Retrieved from www.bls.gov/opub/reports/rac.../2016/home.htm
15. U.S. Department of Labor, Bureau of Labor Statistics. (2017). Table 2: Employment status of the civilian noninstitutional population 16 years and over by sex, 1977 to date 11. Retrieved from www.bls.gov/ cps/cpsaat02.pdf.
16. Toosi, Mitra,"Labor force projections to 2024: the labor force is growing, but slowly," Monthly Labor Review, U.S. Bureau of Labor Statistics, December 2015, doi.org/10.21916/mlr.2015.48.
17. U.S. Department of Labor, Bureau of Labor Statistics. (2017). Table 2: Employment status of the civilian noninstitutional population 16 years and over by sex, 1977 to date 11. Retrieved from www.bls.gov/ cps/cpsaat02.pdf.
18. DeWolf, M. (2017). 12 stats about working women. U.S. Department of Labor Blog.
19. Eagly, A.H., & Karau, S.J.(2002). Role congruity theory of prejudice toward female leaders. Psychological Review, 109 (3): 573-598.
20. EEOC, “Facts About Sexual Harassment.” Retrieved from www.eeoc.gov/eeoc/publications/fssex.cfm
21. Ibid.
22. EEOC, “Sexual Harassment.” Retrieved from https://www.eeoc.gov/laws/types/sexual_harassment.cfm
23. Feldblum, C.R., & Lipnic, V.A. (2016).Report of the Co-Chairs of the EEOC Select Task Force on the Study of Harassment in the Workplace. Retrieved from https://www.eeoc.gov/eeoc/task_force...ent/report.cfm
24. Hernandez, T.K. (2000). Sexual Harassment and Racial Disparity: The Mutual Construction of Gender and Race. Gender, Race and Justice (4J): 183 -224. Retrieved from http://ir.lawnet.fordham.edu/faculty_scholarship/ 12
25. Fitzgerald, L.F., Drasgow, R., Hulin, C.L., Gelfand, M.J., & Magley, V.J. (1997). Antecedents and consequences of sexual harassment in organizations: A test of an integrated model. Journal of Applied Psychology, 82: 578-589; Shaffer, M.A., Joplin, J.R.W., Bell, M.P., Lau, T., & Oguz, C. (2000). Gender discrimination and job-related outcomes: A cross-cultural comparison of working women in the United States and China. Journal of Vocational Behavior, 57(4): 395-427.
26. Toosi, Mitra,"Labor force projections to 2024: the labor force is growing, but slowly," Monthly Labor Review, U.S. Bureau of Labor Statistics, December 2015, doi.org/10.21916/mlr.2015.48.
27. Ibid.
28. Ibid.
29. U.S. Equal Employment Opportunity Commission. African-Americans in the American Workforce. Retrieved from www1.eeoc.gov/eeoc/statistic...n_experiences/ african_americans.cfm?renderforprint=1
30. Quilian, L., Pager, D., Midtboen, A.H., & Hexel, O. (Oct 2017). Hiring discrimination against Black Americans hasn’t declined in 25 years. Harvard Business Review.
31. www.theguardian.com/technolo...discrimination
32. U.S. Department of Labor, Bureau of Labor Statistics. (2017). Table 11: Employed persons by detailed occupation, sex, race, and Hispanic or Latino ethnicity. Retrieved from www.bls.gov/cps/ tables.htm#charemp
33. Ibid
34. Adams, S. (June 2014). White high school drop-outs are as likely to land jobs as black college students. Forbes. Retrieved from www.forbes.com/sites/susanad.../#51715c547b8f
35. Pager, D. (2003). The mark of a criminal record.American Journal of Sociology, 108(5): 937-975.
36. Bertrand, M. & Mullainathan, S. (2004). Are Emily and Greg more employable than Lakisha and Jamal? A field experiment on labor market discrimination.American Economic Review, 94(4): 991-1013
37. Robinson, C. L., Taylor, T., Tomaskovic-Devey, D., Zimmer, C. & Irwin Jr., M.W. (2005). “Studying race or ethnic and sex segregation at the establishment level: Methodological issues and substantive opportunities using EEO-1 reports.”Work and Occupations 32(1): 5–38.
38. Kraiger, K., & Ford, J. K. (1985). A Meta-Analysis of Ratee Race Effects in Performance Ratings. Journal of Applied Psychology, 70(1), 56-65.
39. Mays, V. M., Coleman, L. M., & Jackson, J. S. (1996). Perceived Race-Based Discrimination, Employment Status, and Job Stress in a National Sample of Black Women: Implications for Health Outcomes. Journal of Occupational Health Psychology, 1(3), 319–329.
40. Lopez, G., Ruiz, N.G., & Patten, E. (2017). Key facts about Asian Americans, a diverse and growing population. Pew Research Center. Retrieved from www.pewresearch.org/fact-tank...ian-americans/; Flores, A. (Sep 18 2017). How the U.S. Hispanic population is changing. Pew Research Center. Retrieved from http://www.pewresearch.org/fact-tank...ushispanicpop/
41. U.S. Bureau of Labor Statistics. (2017). Labor force characteristics by race and ethnicity, 2016. Retrieved from www.bls.gov/opub/reports/rac.../2016/home.htm
42. Tafoya, S. (2004). Shades of belonging. Pew Hispanic Center. Retrieved from http://www.pewhispanic.org/ 2004/12/06/shades-of-belonging/
43. Ibid.
44. Hispanics in the U.S. fast facts. (Mar 31 2017). CNN. Retrieved from www.cnn.com/2013/09/20/us/ hispanics-in-the-u-s-/index.html
45. Ibid.
46. Liu, E. (May 30 2014). Why are Hispanics identifying as white? CNN.
47. Ibid.
48. Tafoya, S. (2004). Shades of Belonging. Washington D.C.: Pew Hispanic Center. Retrieved from pewhispanic.org/files/reports/35.pdf.
49. Taylor, P., Lopex, M.H., Martinez, J., & Velasco. G. (2012). When labels don’t fit: Hispanics and their views of identity. Retrieved from www.pewhispanic.org/2012/04/0...s-of-identity/
50. Flores, A. (Sep 18 2017). How the U.S. Hispanic population is changing. Pew Research Center. Retrieved from http://www.pewresearch.org/fact-tank...n-is-changing/ ft_17-09-18_hispanics_ushispanicpop/
51. Avery, D.R., McKay, P.F., Wilson, D.C., Tonidandel, S. (2007). Unequal attendance: The relationships between race, organizational diversity cues, and absenteeism. Personnel Psychology, 60: 875-902.
52. Lopez, G., Ruiz, N.G., & Patten, E. (2017). Key facts about Asian Americans, a diverse and growing population. Pew Research Center. Retrieved from www.pewresearch.org/fact-tank...ian-americans/
53. Ibid.
54. Ibid.
55. Ono, K. A., & Pham, V. N. (2009). Asian Americans and the Media. Cambridge, England: Polity.; Paek, H.J., & Shah, H. (2003). Racial ideology, model minorities, and the ‘not so silent partner:” Stereotyping of Asian Americans in U.S. magazine advertising. Howard Journal of Communications, 14(4): 225-244.
56. Hernandez, T.K. (2000). Sexual Harassment and Racial Disparity: The Mutual Construction of Gender and Race. Gender, Race and Justice (4J): 183 -224. Retrieved from http://ir.lawnet.fordham.edu/faculty_scholarship/12
57. Ibid.
58. Committee of 100: American attitudes toward Chinese Americans and Asian Americans. (2004, Summer). The Diversity Factor, 12(3): 38-44. Retrieved from www.committee100.org/publications/survey/ C100survey.pdf
59. Hernandez, T.K. (2000). Sexual Harassment and Racial Disparity: The Mutual Construction of Gender and Race. Gender, Race and Justice (4J): 183 -224. Retrieved from http://ir.lawnet.fordham.edu/faculty_scholarship/ 12
60. Committee of 100: American attitudes toward Chinese Americans and Asian Americans. (2004, Summer). The Diversity Factor, 12(3): 38-44. Retrieved from www.committee100.org/publications/survey/ C100survey.pdf
61. Multiracial in America. (June 11 2015) Pew Research Center. Retrieved from http://www.pewsocialtrends.org/2015/...al-in-america/
62. Ibid.
63. Ibid.
64. U.S. Bureau of Labor Statistics. (2017). Labor force characteristics by race and ethnicity, 2016. Retrieved from www.bls.gov/opub/reports/rac.../2016/home.htm
65. Ibid.
66. Ibid.
67. Philips, K.W., Rothbard, N.P., & Dumas, T.L. (2009). To disclose or not to disclose? Status distance and selfdisclosure in diverse environments. Academy of Management Review, 34(4), 710-732.
68. U.S. Bureau of Labor Statistics. (2017). Labor force characteristics by race and ethnicity, 2016. Retrieved from www.bls.gov/opub/reports/rac.../2016/home.htm
69. Alley, D., & Crimmins, E. 2007. The demography of aging and work. In K. S. Shultz & G. A. Adams (Eds.), Aging and work in the 21st century: 7-23. New York: Psychology Press.
70. Cuddy, A. J. C., & Fiske, S. T. (2002). Doddering but dear: Process, content, and function in stereotyping of older persons. In T. D. Nelson (Ed.), Ageism: Stereotyping and prejudice against older persons (pp. 3–26). Cambridge, MA: MIT Press.; Cuddy, A. J. C., Norton, M. I., & Fiske, S. T. (2005). This old stereotype: The pervasiveness and persistence of the elderly stereotype. Journal of Social Issues, 61, 267–285.
71. Desmette, D., & Gaillard, M. (2008). When a “worker” becomes an “older worker”: The effects of agerelated social identity on attitudes towards retirement and work. Career Development International, 13, 168–185.
72. Ng, T. W., & Feldman, D. C. (2008). The relationship of age to ten dimensions of job performance. Journal of Applied Psychology, 93, 392–423.
73. Bell, M.P., Ozbilgin, M.F., Beauregard, T.A. and Surgevil, O. (2011), “Voice, silence, and diversity in 21st century organizations: strategies for inclusion of gay, lesbian, bisexual, and transgender employees”, Human Resource Management, Vol. 50 No. 1, pp. 131-146.
74. Human Rights Campaign. (2018). State maps of laws and policies. Retrieved from http://www.hrc.org/ state-maps/employment
75. Ragins, B.R., Cornwell, J.M. and Miller, J.S. (2003), “Heterosexism in the workplace: do race and gender matter?”, Group & Organization Management, Vol. 28, pp. 45-74.
76. Button, S.B. (2001), “Organizational efforts to affirm sexual diversity: a cross-level examination”, Journal of Applied Psychology, Vol. 86 No. 1, pp. 17-28.
77. Human Rights Campaign Foundation (2018), “Corporate equality index 2018 ”, available at:assets2.hrc.org/files/assets/resources/ CEI-2018-FullReport.pdf?_ga=2.120762824.1791108882.1521675202-2105331900.1521675202
78. GLAAD media reference guide (10th ed.). 2016. Los Angeles, CA: Gay and Lesbian Alliance Against Defamation. Retrieved from www.glaad.org/sites/default/f...nthEdition.pdf
79. Lamber, J. (2015). The impact of gay-friendly recruitment statements and due process employment on a firm’s attractiveness as an employer. Equality, Diversity, and Inclusion: An International Journal, 34 (6): 510-526.
80. Black, D., Gates, G., Sanders, S., & Taylor, L. 2000. Demographics of the gay and lesbian population in the United States: Evidence from available systematic data sources. Demography, 37(2): 139-154.
81. Ragins, B.R., Cornwell, J.M., & Miller, J.S. 2003. Heterosexism in the workplace: Do race and gender matter? Group & Organization Management, 28: 45-74.;Tilcsik, A. (2011), “Pride and prejudice: employment discrimination against openly gay men in the United States”, American Journal of Sociology, Vol. 117 No. 2, pp. 586-626.
82. Clair, J.A., Beatty, J.E., & Maclean, T.L. (2005). Out of sight but not out of mind: Managing invisible social identities in the workplace. Academy of Management Review, 30 (1), 78-95.
83. Ibid.
84. Barron, G.L. and Hebl, M. (2013), “The force of law: The effects of sexual orientation anti-discrimination legislation on interpersonal discrimination in employment”, Psychology, Public Policy, and Law, Vol. 19 No. 2, pp. 191-205.
85. Button, S.B. (2001), “Organizational efforts to affirm sexual diversity: a cross-level examination”, Journal of Applied Psychology, Vol. 86 No. 1, pp. 17-28.
86. Trautwein, C. Apr 7 2017. H-1B Visa applications just hit their limit for the year in less than a week. Time. Retrieved 4/21/2017 from http://time.com/4731665/h1b-visa-application-cap/; U.S. Citizenship and Immigration Services. (2017, Apr 7). USCIS reaches FY 2018 H-1B Cap. Retrieved on 4/21/2017 at www.uscis.gov/news/news-rele...-2018-h-1b-cap
87. U.S. Citizenship and Immigration Services. (2013). Working in the U.S. Retrieved from http://www.uscis.gov/working-united-states/working-us; U.S. Department of State, Bureau of Consular Affairs. (2014). Directory of Visa Categories. Retrieved from travel.state.gov/content/visa...gories.html#iv
88. Bureau of Labor Statistics, U.S. Department of Labor. (2016, May 19). Labor force characteristics of foreignborn workers summary. Economic News Release. Retrieved online at www.bls.gov/news.release/ forbrn.nr0.htm
89. Kandel, W. A. (2011). The US foreign-born population: Trends and selected characteristics. Congressional Research Service Report. Retrieved from www.fas.org/sgp/crs/misc/R41592.pdf
90. Bound, J., Demirci, M., Khanna, G., & Turner, S. (2014). Finishing degrees and finding jobs: U.S. higher education and the flow of foreign IT workers (NBER Working Paper No. 20505). Retrieved January 4, 2015, from http://www.nber.org/papers/w20505
91. Avery, D. R., Tonidandel, S., Volpone, S. D., & Raghuram, A. (2010). Overworked in America?: How work hours, immigrant status, and interpersonal justice affect perceived work overload. Journal of Managerial Psychology, 25(2), 133–147.; Bloomekatz, R. (2007). Rethinking immigration status discrimination and exploitation in the low-wage workplace. UCLA Law Review, 54, 1963-2010.
92. Lambert, J.R., Basuil, D.A., Bell, M.P., & Marquardt, D. (2017).Coming to America: Work Visas, International Diversity, and Organizational Attractiveness among Highly Skilled Asian Immigrants. International Journal of Human Resource Management, 1-27.
93. Jamieson, D. (2011). Student guest workers at Hershey plant allege exploitative conditions.Huffington Post. Retrieved from http://www.huffingtonpost.com/2011/0..._n_930014.html.
94. Wigglesworth, V. (2013). Tech giant Infosys settles allegation of visa fraud in Plano office for $34 million. Dallas News. Retrieved from www.dallasnews.com/news/commu...nclick_check=1
95. U.S. Department of Labor. (2012). Key points on Disability and Occupational Projections Tables. Retrieved from www.dol.gov/odep/pdf/20141022-KeyPoints.pdf
96. Ibid.
97. U.S. Census Bureau. (2008). Table 75. Self-Described Religious Identification of Adult Population: 1990, 2001 and 2008. Retrieved from https://www2.census.gov/library/publ.../statab/130ed/ tables/11s0075.pdf