
13.2: Duration and Extent of Water Infrastructure
- Page ID
- 21188

Statistics and studies of water infrastructure typically make major distinctions among water supply, wastewater treatment, and other water infrastructure. We have combined all three in this module because particular infrastructure components may serve multiple purposes. For example, a particular dam may contribute to water storage, hydroelectric power generation, flood control, and recreational opportunities. Moreover, different water infrastructure elements all belong within the common general water cycle. For example, the output of a wastewater treatment plant will often be the input for a water supply system downstream. As recycling and reuse become more critical management strategies, an integrated strategy for water supply, wastewater treatment, and other uses becomes more important.
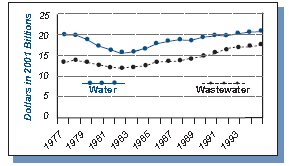
Unfortunately, summary statistics on the physical extent of the water infrastructure system are difficult to obtain. After all, the infrastructure has numerous owners and purposes. Some indication of magnitude is indicated in Table 13.1, showing the revenues and numbers of establishments for water supply, irrigation and sewage treatment in 2002 obtained from the US Economic Census. Figure 13.3 shows state and local spending alone on water and wastewater operations to be roughly $ 20B each in 2001 dollars.
Table 13.2.1 - Summary Statistics for the Water, Sewage and Other Systems Sector from the 2002
| 2002 NAICS code |
Kind of Business |
Establishment (number) |
Revenue ($1,000) |
|
2213 |
Water, sewage, and other systems.............................................................................. |
5 790 |
7 593 747 |
22131 |
Water supply and irrigation systems............................................................................ |
4 830 |
5 860 181 |
| 221310 |
Water supply and irrigation systems......................................................................... | 4 830 | 5 860 181 |
22132 |
Sewage treatment facilities......................................................................................... |
866 |
1 051 028 |
| 221320 |
Sewage treatment facilities...................................................................................... | 866 | 1 051 028 |
22133 |
Stream and air-conditioning supply.............................................................................. |
84 |
682 538 |
| 221330 |
Stream and air-conditioning supply......................................................................... | 84 | 682 538 |
Source: US Census, 2004, ‘2002 Economic Census’, Public Domain, www.census.gov/prod/ec02/ec0222i02.pdf
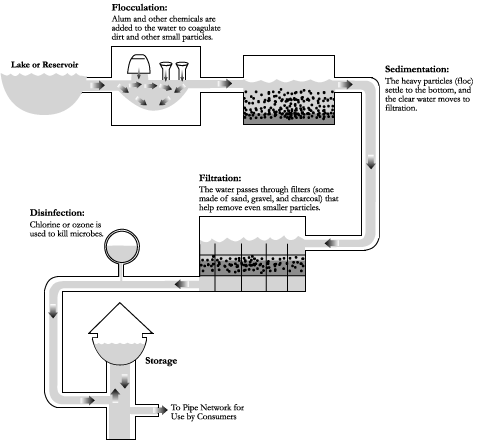
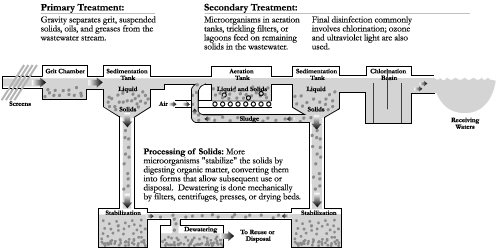
A typical water supply plant involves several process operations to filter and disinfect ‘raw’ water (Figure 13.2.2). Wastewater treatment has more variations, depending upon the design level of treatment (Figure 13.2.3).
Water infrastructure can be very long-lived, especially buried pipes, earthen structures and canals. Table 13.2.2 shows some estimated lives of water infrastructure components.
Table 13.2 - Estimated Useful Lives of Water Infrastructure
Components
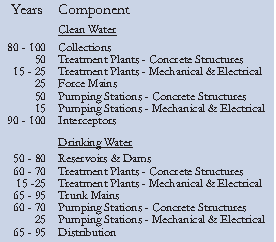
Source: US EPA, 2002, “Clean Water and Drinking Water
Infrastructure Gap Analysis”, Public Domain, 901R0200, https://nepis.epa.gov