
11.2: Duration and Extent of Roadway Infrastructure
- Page ID
- 21174

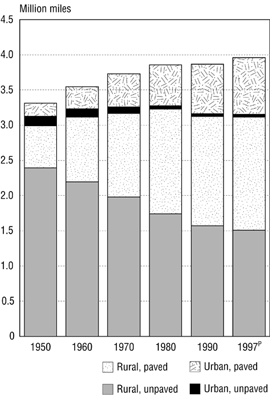
Roadways are widespread throughout the world. As an example, Figure 11.2.1 shows the mileage of rural and urban highways in the United States from 1950 to 1997. Rural roadways are much more extensive than urban roadways, even though the bulk of population resides in urban areas. Unpaved roadways have declined, while the total mileage of roadways has shown a modest increase over the past fifty years. In 1997, US population was roughly 270 million, representing 68 people for every mile of roadway. Not included in these highway totals would be a variety of trails, temporary roads for uses such as logging, or ‘natural’ roadways such as truck pathways on frozen lakes and rivers.
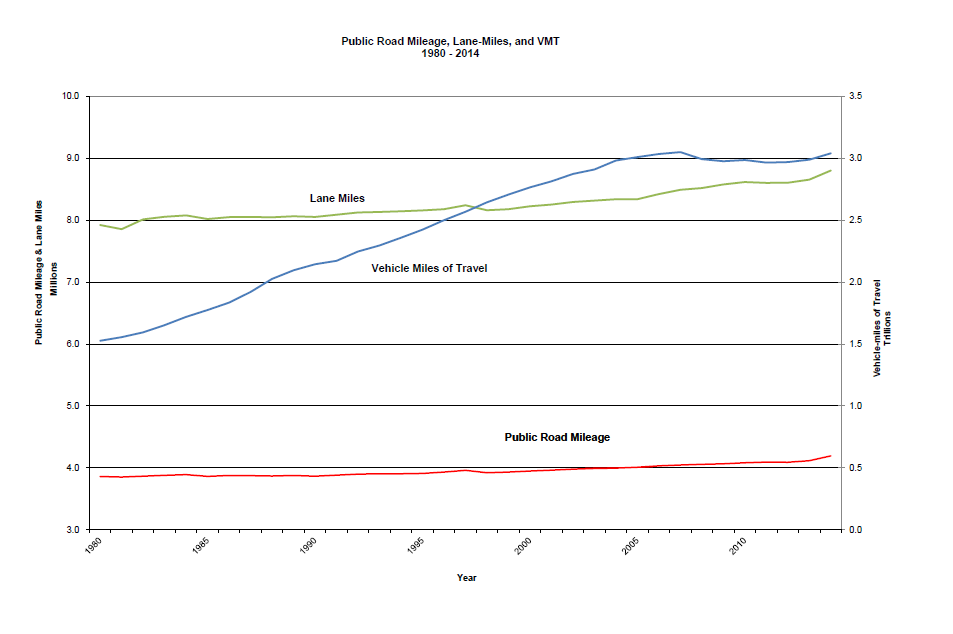
More recent trends in US public road mileage, lane miles, and overall vehicles miles of travel are shown in Figure 11.2.2 for 1980 to 2014. Overall mileage has changed very little in this period, while lane-miles have increased slightly suggesting that lanes have been added to existing roadways. In contrast, vehicle miles of travel have increased significantly in this period, suggesting congestion has also been increasing. Note that the left vertical axis for road mileage and lane-miles starts at three million miles rather than zero.
The durability of roadways and roadway components can vary considerably. Rights of way can exist for hundreds of years, especially if a roadway is in regular use. Pavements and other roadway components are not so longed lived, as discussed in Chapters 2-4.
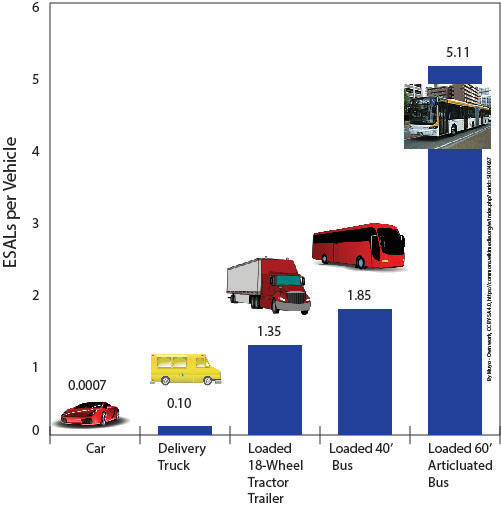
Roadway surfaces deteriorate with use and weathering. Deterioration from use is correlated to the weight of vehicles or, more precisely, the weight of vehicle axles. The effect of additional tire weight is non-linear, with damage increasing by roughly a power of four. Roadway traffic is often measured in ‘equivalent single axle loads’ (ESAL) where the standard single axle load is 18,000 lb (8,200 kg). Figure 11.2.3 shows approximate ESAL values for typical vehicles. Buses tend to have higher loads because they have fewer axles than most trucks.
Pavement design, construction and maintenance are also critical elements affecting the durability of roadways. Stronger and thicker paving material with a good foundation is generally expected to last longer than weaker pavements. However, the initial costs of highly durable pavements may be difficult to justify for low volume roadways. Effective pavement lifetimes are roughly 10 to 50 years. Typical paving materials include hot mix asphalt, concrete, and bituminous surface treatment.