
3.4: Sensors for Inspection Condition Assessment
- Page ID
- 21121

A variety of tests can also be used to assist or to replace manual inspection. For example, infrared images may be obtained to aid roof inspection, with areas of high heat flux indicating insulation issues. Water samples can be tested for a variety of trace elements. These test results can be considered in arriving at a particular condition assessment rating.
An example of an automated, sensor-based condition assessment is the widely used International Roughness Index (IRI) for pavements. This index is based upon the vertical variation on a pavement surface over a particular length of the pavement. More vertical variation represents rougher and worse condition pavement. The International Roughness Index is calculated from laser depth measurements and reported in units of length (of vertical variation) divided by length of measurement, such as millimeters per meter. Figure 3.6 shows the typical International Roughness Index values for different types of pavements and for different pavement distress types. Also shown in Figure 3.6 is a typical use speed for pavements of different conditions.
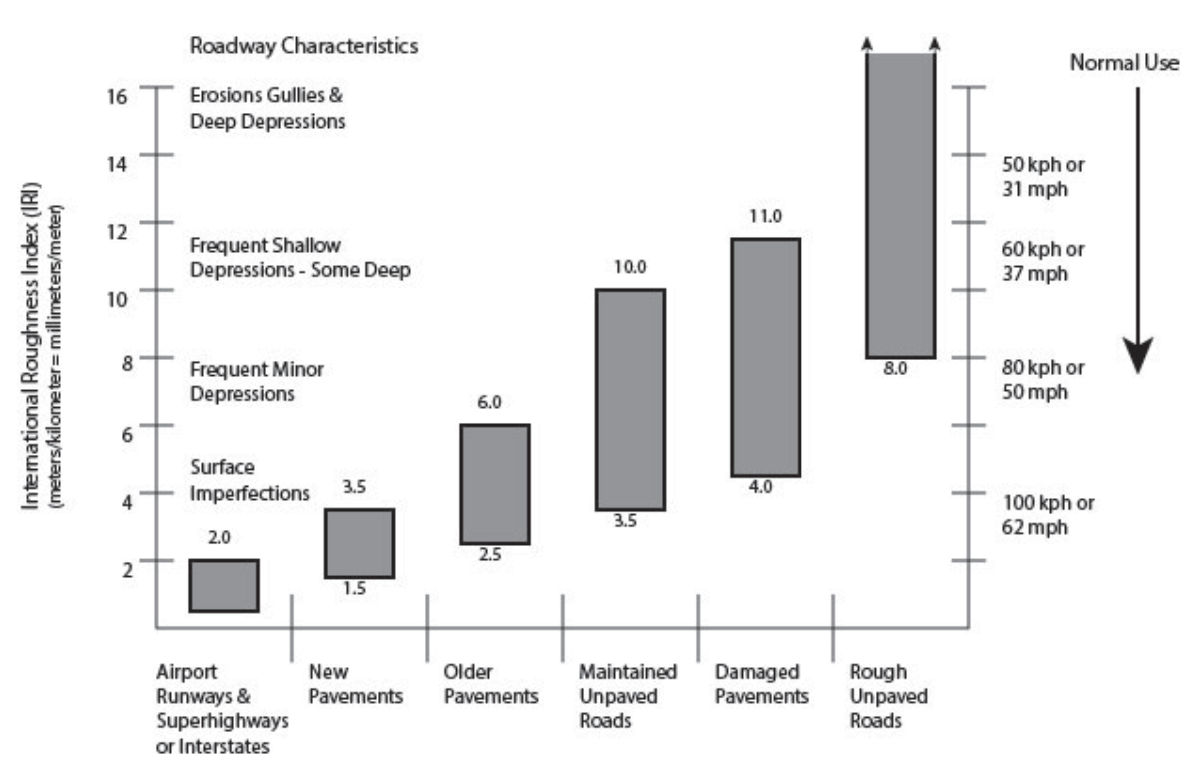
For an automated index such as the International Roughness Index, a manager would like to know how the index might compare to manual inspections and how the index might correlate to user costs (or in this case, traveler comfort). Fortunately, for the International Roughness Index there is good correlation with both manual inspections and reported ride quality as long as roughness measurements are made for the full width of the pavement surface.
Other automated approaches for pavement condition assessment are also possible. In particular, video images of pavement surfaces can be analyzed by software for a direct condition assessment. These methods make use of less expensive sensors in the form of video cameras and rely on pattern recognition approaches for pavement distress. In many cases, a combination of different approaches can be employed, with manual inspection often used for maintenance alternatives assessment.
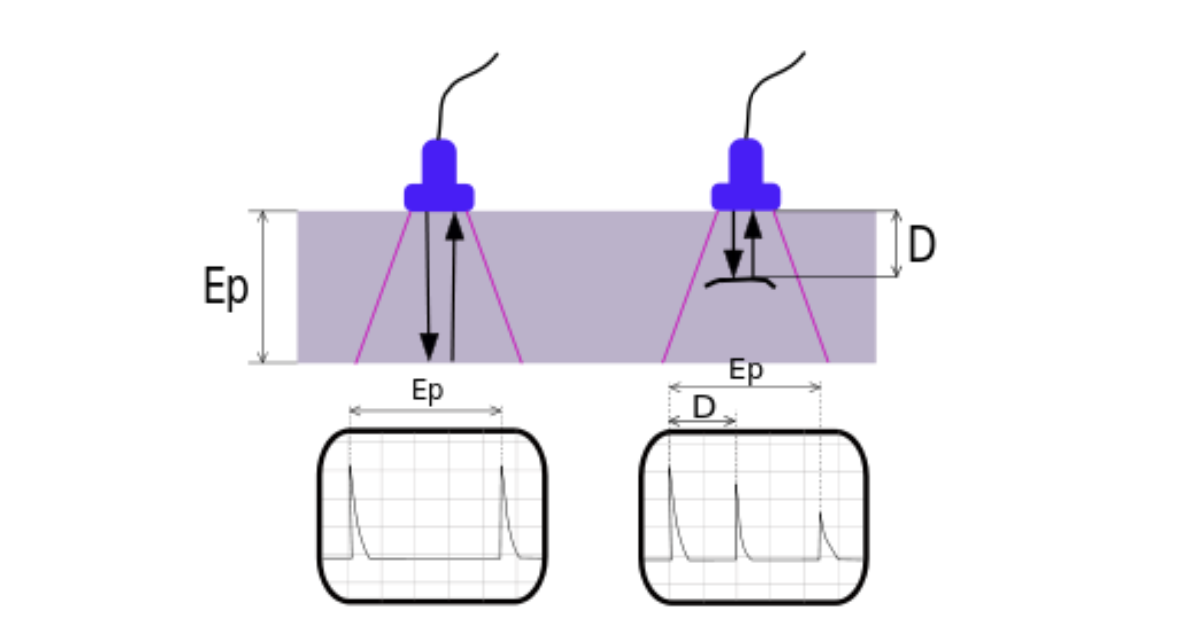
A variety of other non-destructive sensors can be used for infrastructure component inspection. Visual inspection is described above, but others can include: Liquid Penetrant, Magnetic, Ultrasonic, Eddy Current and X-ray sensors. Figure 3.7 illustrates the use of ultrasonic sensors for identifying potential structural flaws hidden within a component such as a steel building beam or rail.
We will close with a few examples of devices and sensors used for different types of infrastructure inspections.
- Power plant equipment and facilities can be visually inspected, but hard to reach elements and corrosion identification require special sensors. Eddy current probes, crawling robots and flying drones may all help inspectors.
- Periodic wire rope inspection for aerial lifts and transmission lines is always recommended (and often required by regulation). While visual inspection is the traditional method of inspection, drones, measuring devices and sensors for internal flaws can all be used.
- Storage tank inspection is routinely performed. Above ground, tanks can be observed manually, with crawlers or with drones. Below-ground tanks can be inspected from the inside (as with pipes), but exterior inspection below ground is difficult.
- Rail inspection can be performed manually, but specialized sensors are usually employed to assess geometry or hidden defects. Dedicated vehicles are commonly used, but there is already equipment available that can monitor rail conditions from regularly running trains.
• Natural gas leaks have specialized sensors that may be handheld or designed for vehicles. Since natural gas (or methanol) is a potent greenhouse gas, a new emphasis on inspection for leak identification and repair is becoming more prevalent and important.