
11.6: The Business Intelligence Toolkit
- Page ID
- 4575
Learning Objectives
After studying this section you should be able to do the following:
- Know the tools that are available to turn data into information.
- Identify the key areas where businesses leverage data mining.
- Understand some of the conditions under which analytical models can fail.
- Recognize major categories of artificial intelligence and understand how organizations are leveraging this technology.
So far we’ve discussed where data can come from, and how we can get data into a form where we can use it. But how, exactly, do firms turn that data into information? That’s where the various software tools of business intelligence (BI) and analytics come in. Potential products in the business intelligence toolkit range from simple spreadsheets to ultrasophisticated data mining packages leveraged by teams employing “rocket-science” mathematics.
Query and Reporting Tools
The idea behind query and reporting tools is to present users with a subset of requested data, selected, sorted, ordered, calculated, and compared, as needed. Managers use these tools to see and explore what’s happening inside their organizations.
Canned reports provide regular summaries of information in a predetermined format. They’re often developed by information systems staff and formats can be difficult to alter. By contrast, ad hoc reporting tools allow users to dive in and create their own reports, selecting fields, ranges, and other parameters to build their own reports on the fly. Dashboards provide a sort of heads-up display of critical indicators, letting managers get a graphical glance at key performance metrics. Some tools may allow data to be exported into spreadsheets. Yes, even the lowly spreadsheet can be a powerful tool for modeling “what if” scenarios and creating additional reports (of course be careful: if data can be easily exported, then it can potentially leave the firm dangerously exposed, raising privacy, security, legal, and competitive concerns).
Figure 11.3 The Federal IT Dashboard
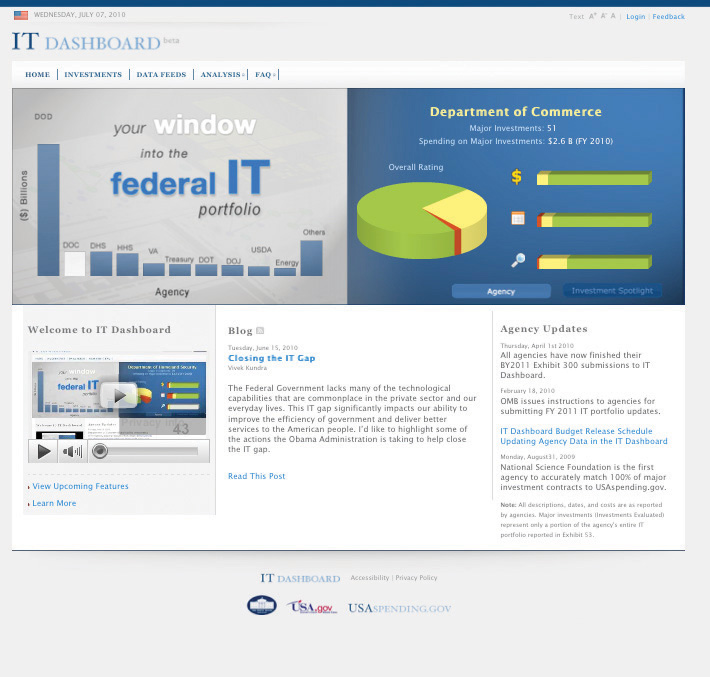
The Federal IT dashboard offers federal agencies, and the general public, information about the government’s IT investments.
A subcategory of reporting tools is referred to as online analytical processing (OLAP) (pronounced “oh-lap”). Data used in OLAP reporting is usually sourced from standard relational databases, but it’s calculated and summarized in advance, across multiple dimensions, with the data stored in a special database called a data cube. This extra setup step makes OLAP fast (sometimes one thousand times faster than performing comparable queries against conventional relational databases). Given this kind of speed boost, it’s not surprising that data cubes for OLAP access are often part of a firm’s data mart and data warehouse efforts.
A manager using an OLAP tool can quickly explore and compare data across multiple factors such as time, geography, product lines, and so on. In fact, OLAP users often talk about how they can “slice and dice” their data, “drilling down” inside the data to uncover new insights. And while conventional reports are usually presented as a summarized list of information, OLAP results look more like a spreadsheet, with the various dimensions of analysis in rows and columns, with summary values at the intersection.
Public Sector Reporting Tools in Action: Fighting Crime and Fighting Waste
Access to ad hoc query and reporting tools can empower all sorts of workers. Consider what analytics tools have done for the police force in Richmond, Virginia. The city provides department investigators with access to data from internal sources such as 911 logs and police reports, and combines this with outside data including neighborhood demographics, payday schedules, weather reports, traffic patterns, sports events, and more.
Experienced officers dive into this data, exploring when and where crimes occur. These insights help the department decide how to allocate its limited policing assets to achieve the biggest impact. While IT staffers put the system together, the tools are actually used by officers with expertise in fighting street crime—the kinds of users with the knowledge to hunt down trends and interpret the causes behind the data. And it seems this data helps make smart cops even smarter—the system is credited with delivering a single-year crime-rate reduction of 20 percent (Lohr, 2007).
As it turns out, what works for cops also works for bureaucrats. When administrators for Albuquerque were given access to ad hoc reporting systems, they uncovered all sorts of anomalies, prompting excess spending cuts on everything from cell phone usage to unnecessarily scheduled overtime. And once again, BI performed for the public sector. The Albuquerque system delivered the equivalent of $2 million in savings in just the first three weeks it was used (Mulcahy, 2007).