
14.1: Introduction
- Page ID
- 24556
Automobiles are an essential part of American society. In the beginning of the new millennium, there were approximately 156 million cars, vans, trucks, and sport-utility vehicles insured in the United States. The expenditures for auto insurance have declined in recent years, as shown in Table 14.1. Factors contributing to the decrease are safer cars, better safety devices, and less fraud and theft. These factors are somewhat diminished by overall increases in litigation and medical costs, as indicated in the private passenger auto insurance losses of Table 14.2 Insurance Information Institute (III), The Insurance Fact Book, 2009, 57, 62; www.iii.org/media/facts/statsbyissue/auto/ (accessed March 21, 2009).
| Year | Average Expenditure | Percentage Change | Year | Average Expenditure | Percentage Change |
|---|---|---|---|---|---|
| 1997 | $705 | 2.0% | 2002 | $786 | 8.3% |
| 1998 | $703 | −0.3 | 2003 | $830 | 5.6 |
| 1999 | $685 | −2.6 | 2004 | $842 | 1.4 |
| 2000 | $690 | 0.7 | 2005 | $831 | −1.3 |
| 2001 | $726 | 5.2 | 2006 | $817 | −1.7 |
Source: © 2007 National Association of Insurance Commissioners.
Source: Insurance Information Institute (III), accessed March 21, 2009, www.iii.org.
According to the U.S. Department of Transportation’s National Highway Traffic Safety Administration, an auto accident death occurs, on average, every twelve minutes, and an injury occurs every eleven seconds. Vehicle occupants accounted for 74 percent of traffic deaths in 2007.Insurance Information Institute (III), The Insurance Fact Book, 2009, 136–137.
Drunk driving (driving while intoxicated [DWI] or driving under the influence [DUI]) contributes dramatically to fatalities on the road. In 2007, 12,998 traffic deaths were related to drunk driving. Most states have DWI or DUI laws that include lower blood-alcohol level tolerances for drivers under the age of twenty-one.Insurance Information Institute (III), The Insurance Fact Book, 2009, 72–74.
| Liability | ||||
|---|---|---|---|---|
| Bodily InjuryExcludes Massachusetts and most states with no-fault automobile insurance laws. | Property DamageExcludes Massachusetts, Michigan, and New Jersey. | |||
| Year | Claim FrequencyClaim Frequency is claims per one hundred earned car years. A car year is equal to 365 days of insured coverage for a single vehicle. | Claim SeverityIncludes loss adjustment expenses. | Claim FrequencyClaim frequency is claims per one hundred earned car years. A car year is equal to 365 days of insured coverage for a single vehicle. | Claim SeverityClaim severity is the size of the loss measured by the average amount paid for each claim. |
| 1998 | 1.26 | $9,437 | 3.97 | $2,240 |
| 1999 | 1.23 | 9,646 | 4.00 | 2,294 |
| 2000 | 1.20 | 9,807 | 3.98 | 2,393 |
| 2001 | 1.16 | 10,149 | 3.97 | 2,471 |
| 2002 | 1.15 | 10,400 | 3.92 | 2,552 |
| 2003 | 1.16 | 10,662 | 3.87 | 2,606 |
| 2004 | 1.14 | 11,079 | 3.78 | 2,624 |
| 2005 | 1.10 | 11,423 | 3.67 | 2,693 |
| 2006 | 1.03 | 12,020 | 3.49 | 2,811 |
| 2007 | 1.00 | 12,296 | 3.54 | 2,869 |
| Physical DamageExcludes Massachusetts, Michigan, and Puerto Rico. Based on coverage with a $500 deductible. | ||||
| Collision | ComprehensiveExcludes wind and water losses. | |||
| Year | Claim FrequencyClaim frequency is claims per one hundred earned car years. A car year is equal to 365 days of insured coverage for a single vehicle. | Claim SeverityClaim severity is the size of the loss measured by the average amount paid for each claim. | Claim FrequencyClaim frequency is claims per one hundred earned car years. A car year is equal to 365 days of insured coverage for a single vehicle. | Claim SeverityClaim severity is the size of the loss measured by the average amount paid for each claim. |
| 1998 | 5.39 | $2,273 | 2.93 | $1,078 |
| 1999 | 5.73 | 2,352 | 2.80 | 1,116 |
| 2000 | 5.61 | 2,480 | 2.89 | 1,125 |
| 2001 | 5.53 | 2,525 | 3.11 | 1,152 |
| 2002 | 5.48 | 2,728 | 2.91 | 1,250 |
| 2003 | 5.17 | 2,919 | 2.75 | 1,331 |
| 2004 | 4.88 | 3,073 | 2.45 | 1,420 |
| 2005 | 5.05 | 3,062 | 2.37 | 1,456 |
| 2006 | 4.88 | 3,189 | 2.39 | 1,529 |
| 2007 | 5.14 | 3,131 | 2.46 | 1,519 |
| Source: ISO. | ||||
| * For all limits combined. Data are for paid claims. | ||||
Source: “Automobile Insurance Overview,” Insurance Information Institute, accessed March 21, 2009, www.iii.org/media/facts/statsbyissue/auto/.
To alleviate the economic risk of getting hurt or hurting someone else in an automobile accident, the law in most states requires automobile owners to buy automobile insurance. In this chapter we will learn about the following:
- Links
- The fault system and financial responsibility laws
- Ensuring auto insurance availability
- Types of automobile policies and the personal automobile policy (PAP)
- Auto insurance premium rates
Links
At this point in our study, we are still in the realm of different types of personal lines coverages. As with the homeowners policy, the automobile policy combines both property and liability coverage in one package. The liability part is now at the front of the policy rather than the property part, as is the case in the homeowners policy.
As part of our holistic risk management, we need to be sure that when we are on the road we are covered. If we hurt anyone, we may be sued for every penny we and our parents ever earned. If we get hurt or damage our own cars, we may not be able to get to work, or we may be out of work for a long time. As you saw in the statistics above, car accidents do occur and no one is immune to them.
The personal auto line prices are not increasing as quickly as in the beginning of the new millennium. Of course, the premium level for each driver depends on the specific pricing factors for private passenger automobiles such as location, classification, car make, and so forth. Regardless of your individual rating factors, you know by now that external market conditions affect your risk management decision (as you saw in "8: Insurance Markets and Regulation"). When rates are high, for example, you may decide to use higher deductibles for your automobile coverage.
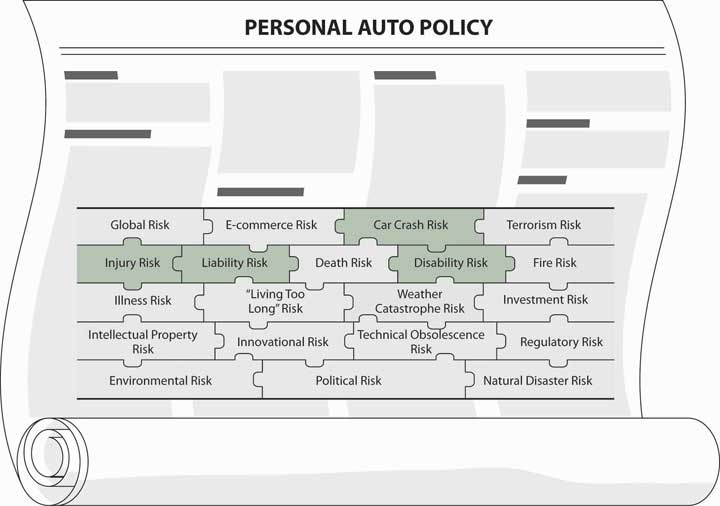
In addition to understanding how the market conditions affect our risk management decision in the area of automobile insurance, the concepts we studied thus far will be helpful in quickly capturing the essence of auto coverage and the particulars of the wording in the policy. Here, we need to know not only what coverage we have but also what is required by the various state laws. You will have the opportunity to delve into an actual policy ("Appendix B") and complete your understanding of this important and costly risk. Figure \(\PageIndex{1}\) connects this topic to our holistic risk puzzle. An example of the automobile coverage of the Smith family mentioned in "13: Multirisk Management Contracts - Homeowners" is provided in Case 1 of "23: Cases in Holistic Risk Management". The case shows how a family creates a complete risk management portfolio.