
11.1: Diversification and Portfolio Risk
- Page ID
- 79792

Diversification is the strategy of spreading your investments across a number of asset classes to eliminate some, but not all, of the risks of investing. We have all heard the saying, “Don’t put all your eggs in one basket.” Most financial professionals recommend and most investors agree that diversification is a worthy technique for the vast majority of prudent, long-term oriented investors such as ourselves.
However, there are some in the investment community who disagree. They point to the counter advice from famed industrialist Andrew Carnegie, “Put all your eggs in one basket ‒ and watch that basket!” This quote is often attributed to Mark Twain. Mr. Twain made it popular but always attributed the quote to Mr. Carnegie. These two viewpoints once again point to the heart of our choices as investors. Do we want to eat well or do we want to sleep well? Those who follow Mr. Carnegie’s advice are more risk tolerant and we wish them well. However, we prudent, long-term oriented investors will hold fast to our diversification strategies, thank you very much.
Why is diversification a good thing? Diversification is one of the best strategies we have for reducing risk.
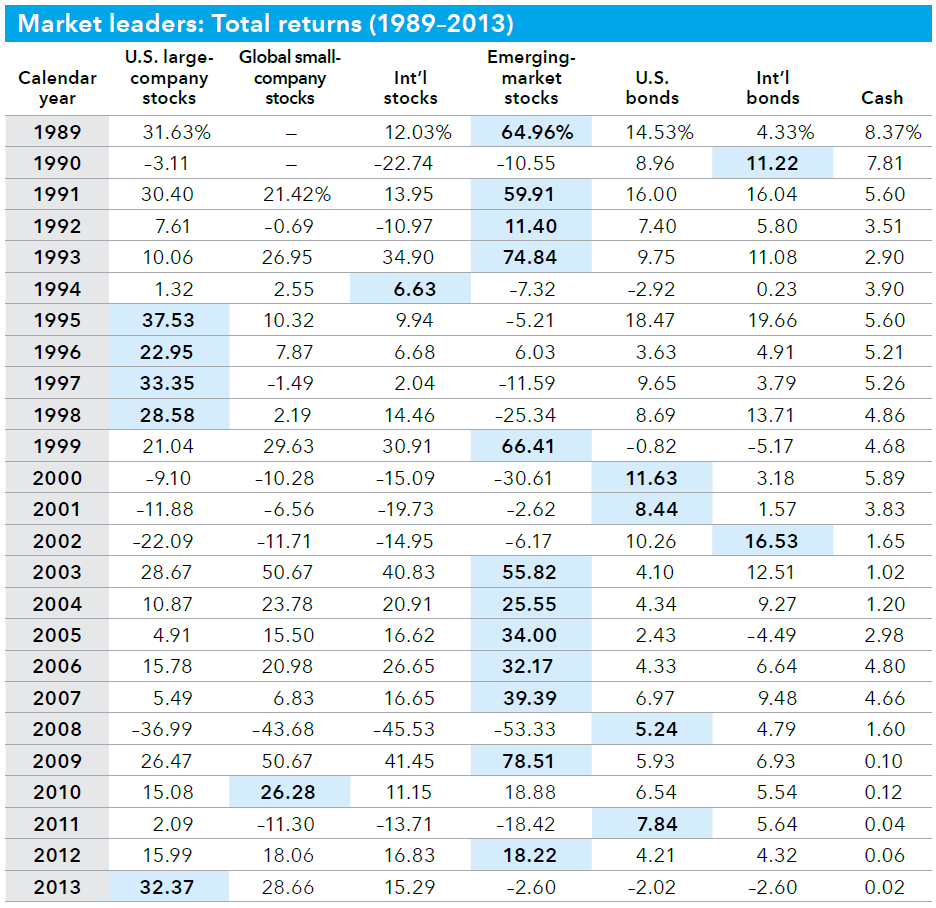
Source: The Capital Group
The table above highlights the market leaders from 1989 to 2013. Sure, you could have had all your investments in emerging market stocks but be sure to take a close look at the down years. You would have been watching that basket full of all your eggs crash to the floor oodles of times, probably many more than any one person could stomach. It pays to diversify. Also notice that not once was “cash,” the common euphemism for short-term investments, the market leader. It pays to invest! This conversation, however, begs the question, how do we measure risk?
Risk versus Return, Revisited
We have come full circle! Way back in chapter 1, we introduced the eternal tug-of-war between risk and return. We saw how the higher the average annual return, the higher the standard deviation and its companion measure variance from the average annual return. We have studied the major financial asset classes, mutual funds, stocks, bonds, “cash” short-term investments. We discussed the risks and returns of each. Return is easy to measure. How much money did you make? How long did it take? That’s your return! Risk is very difficult to measure. It is even harder to anticipate.
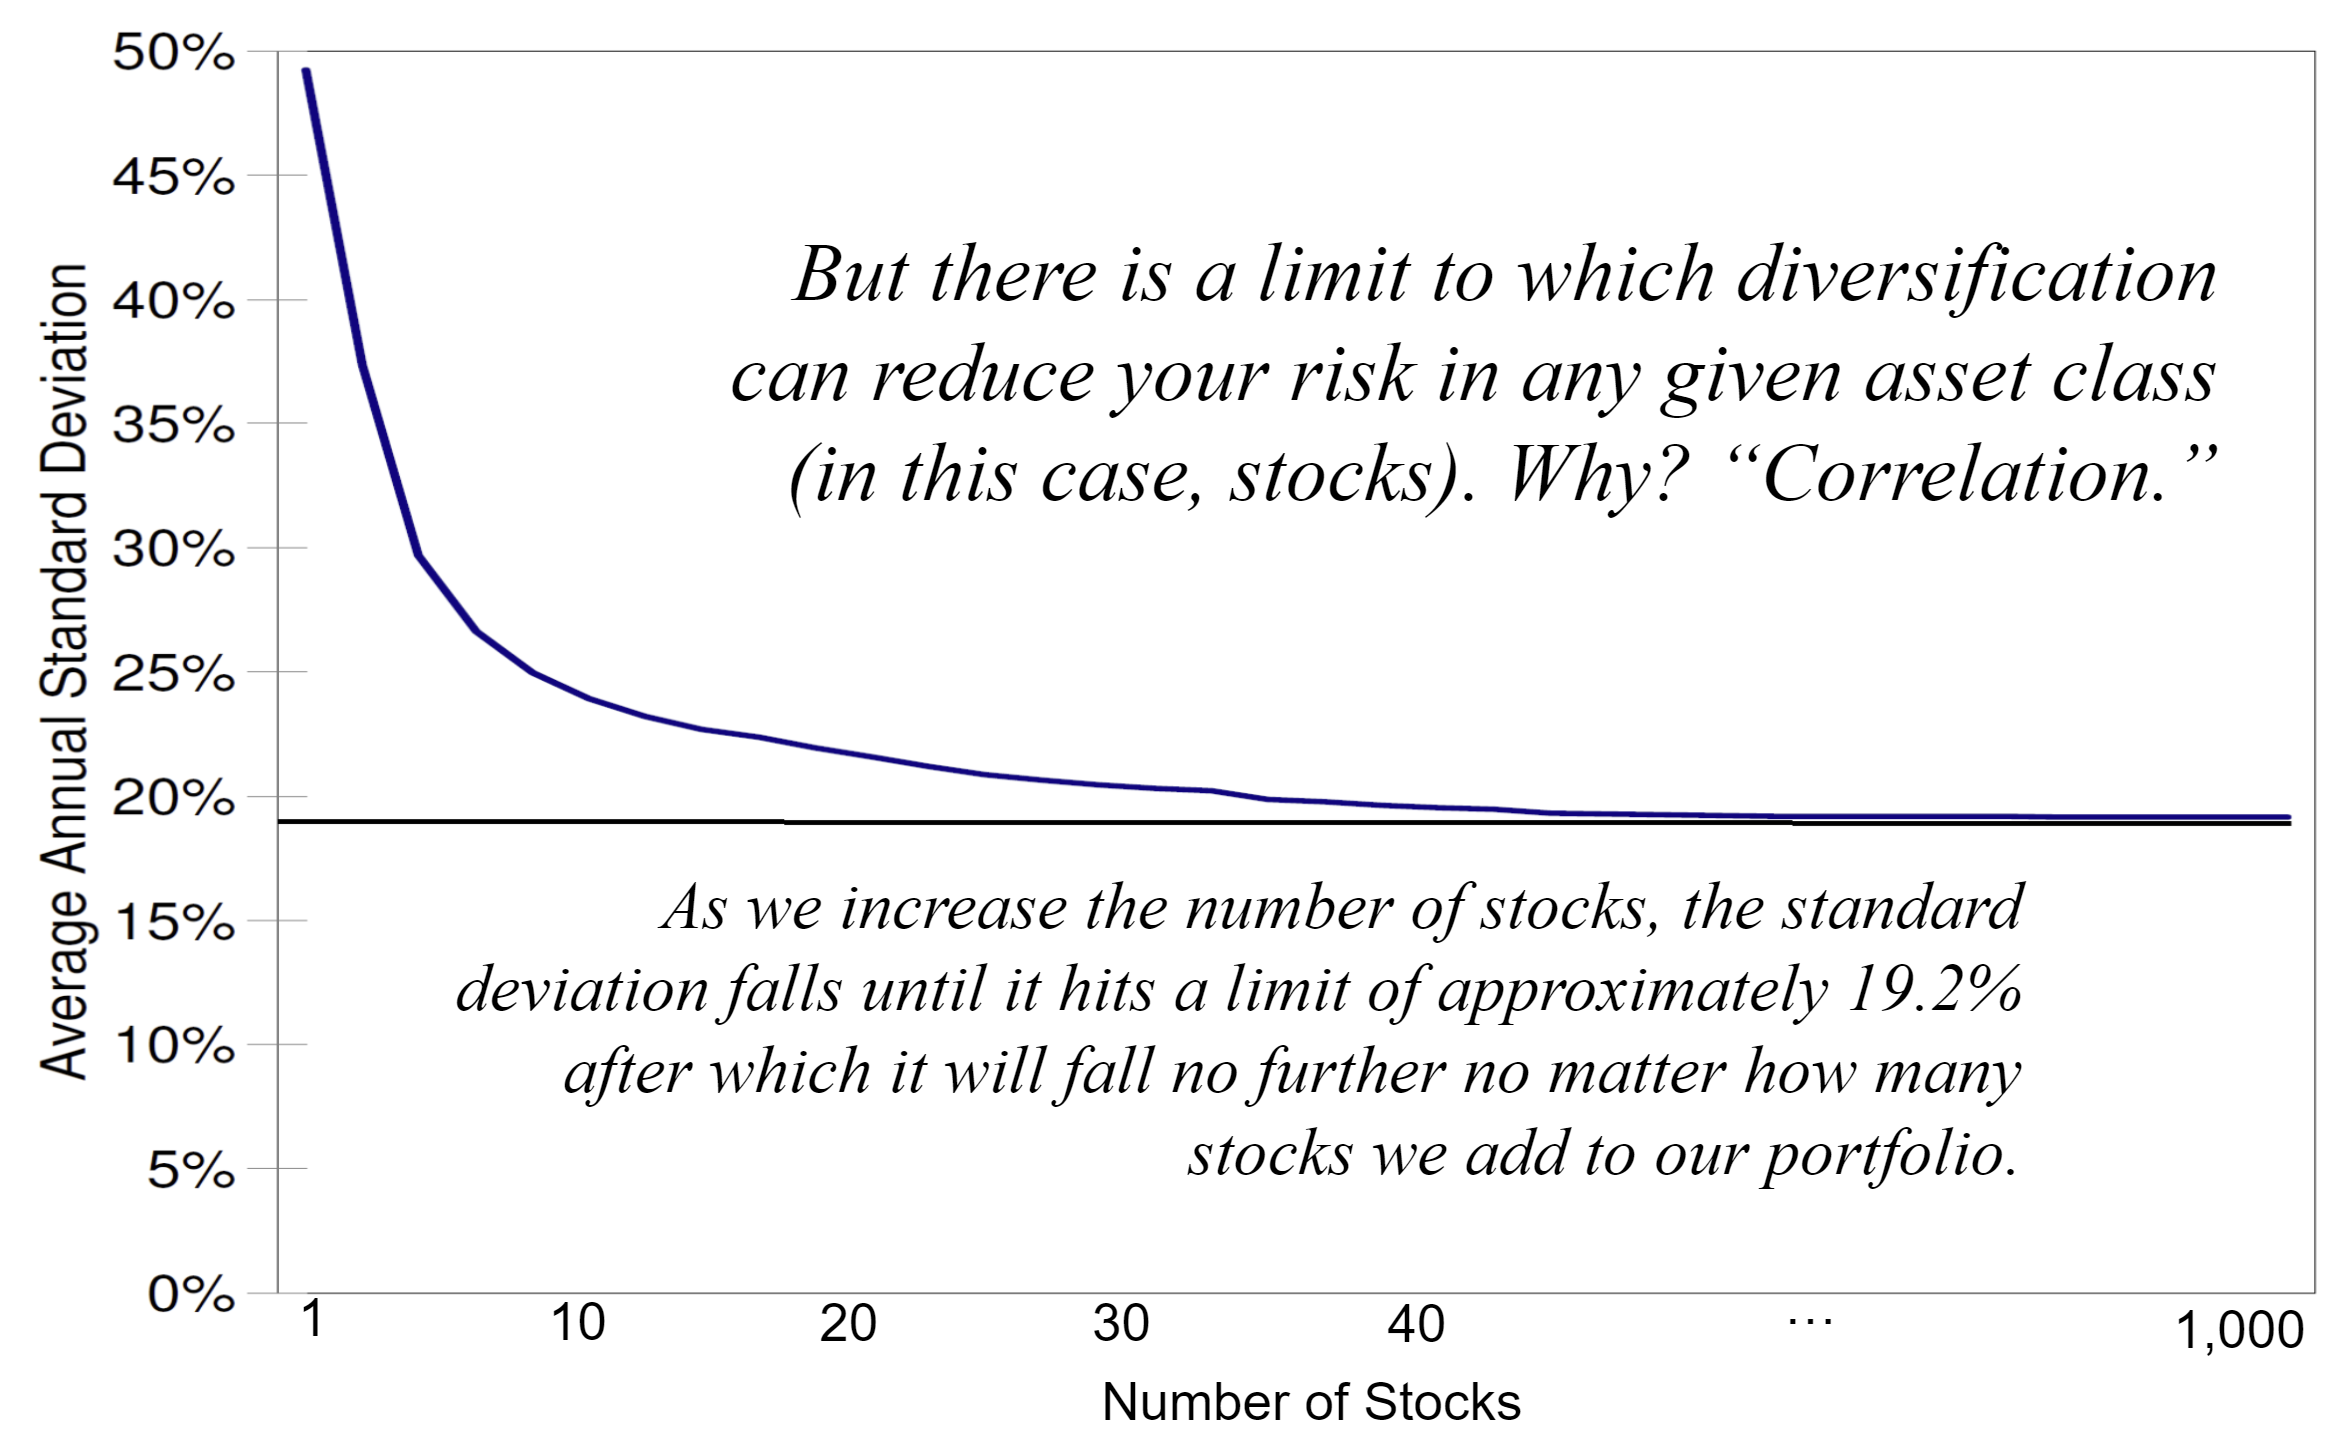
Most professionals point to variance and standard deviation as the best imperfect measures of risk. To review, variance and its more useful companion, standard deviation, tell us how much an asset class will vary from the expected return. These measures are readily available from the investment community. And da’ numbers ain’t pretty, For any randomly selected stock on the NYSE, the standard deviation is 49.24%! That means in any one year, many stocks on the NYSE – the most stable stocks! – will vary up or down close to 50% from their annual average return. The company with the largest market capitalization as of May 2023, Apple, for example, has a 5-year standard deviation of over 31.8% (Source: ABG Analytics). So how can we reduce the variance and standard deviation? In other words, how can we reduce the risk?
The answer, of course, is to diversify! If we go from 1 randomly selected stock to 2 randomly selected stocks, the standard deviation goes from 49.24% down to 37.36%. If we randomly select 10 stocks, the standard deviation goes down to 23.93%. Choose 20 stocks and the number to 21.68%, and so on. Diversifying our stock portfolio reduces our risk substantially as measured by reduced standard deviation and variance.
| Number of Stocks | Expected Standard Deviation | Percent Compared to a Single Stock |
|---|---|---|
| 1 | 49.236% | 100% |
| 2 | 37.358% | 76% |
| 4 | 29.687% | 60% |
| 6 | 26.643% | 54% |
| 8 | 24.983% | 51% |
| 10 | 23.932% | 49% |
| 20 | 21.677% | 44% |
| 25 | 21.196% | 43% |
| 30 | 20.870% | 42% |
| 50 | 20.203% | 41% |
| 75 | 19.860% | 40% |
| 100 | 19.686% | 40% |
| 200 | 19.423% | 39% |
| 300 | 19.336% | 39% |
| 500 | 19.265% | 39% |
| 1,000 | 19.211% | 39% |
| ∞ | 19.158% | 39% |
Source: The Capital Group
However, there is a limit to how low the standard deviation will go as we add more and more stocks to the portfolio. There is a limit to which diversification can reduce your risk in any given asset class. In this case, we are discussing stocks but the same phenomenon occurs with other asset classes such as bonds or real estate. Notice in the table above, there comes a point where adding more stocks to the portfolio does not lower the standard deviation. Adding more stocks and diversifying more and more does not lower our risk any more. Why is this? What is causing this peculiar behavior? The answer is, “Correlation.”
Correlation and the Correlation Coefficient
Correlation is the tendency of the returns of two assets to move together. Of course, no two investment returns will be exactly the same. That is called imperfect correlation and it is the key reason why diversification reduces portfolio risk as measured by the portfolio standard deviation. However asset classes such as stocks tend to move together. We say that assets that tend to move up and down together are positively correlated. On the other hand, assets that move in the opposite direction to one another are negatively correlated.
We measure correlation using the correlation coefficient. The correlation coefficient measures how closely returns on assets move together. The industry uses the letter “r” to denote the correlation coefficient. (Please don't ask me why. It’s yet another example of confusing the issue so that you will put your faith in us professionals. My apologies.) The correlation coefficient ranges from 1 or 100% down to 0 down to -1 or -100%. A correlation coefficient of 1 or 100% means that the two assets are perfectly positively correlated. They move in lock step with one another. When one goes up, the other goes up. If the correlation coefficient is -1 or -100%, that means that the two assets are perfectly negatively correlated. When one goes up, the other goes down and vice versa. A correlation coefficient of 0 means that the two are completely unrelated to one another.

So how does this answer our question about why diversification can only reduce by so much the risks of owning stocks? Although stocks are not perfectly correlated, they are positively correlated enough so that stocks in general tend to move in the same direction. This is why we often refer to stock investments as a whole as the stock market, even though at any given time, some companies are doing well, others are doing poorly, and many are simply chugging along as they always have done.
Correlation and Stocks versus Bonds
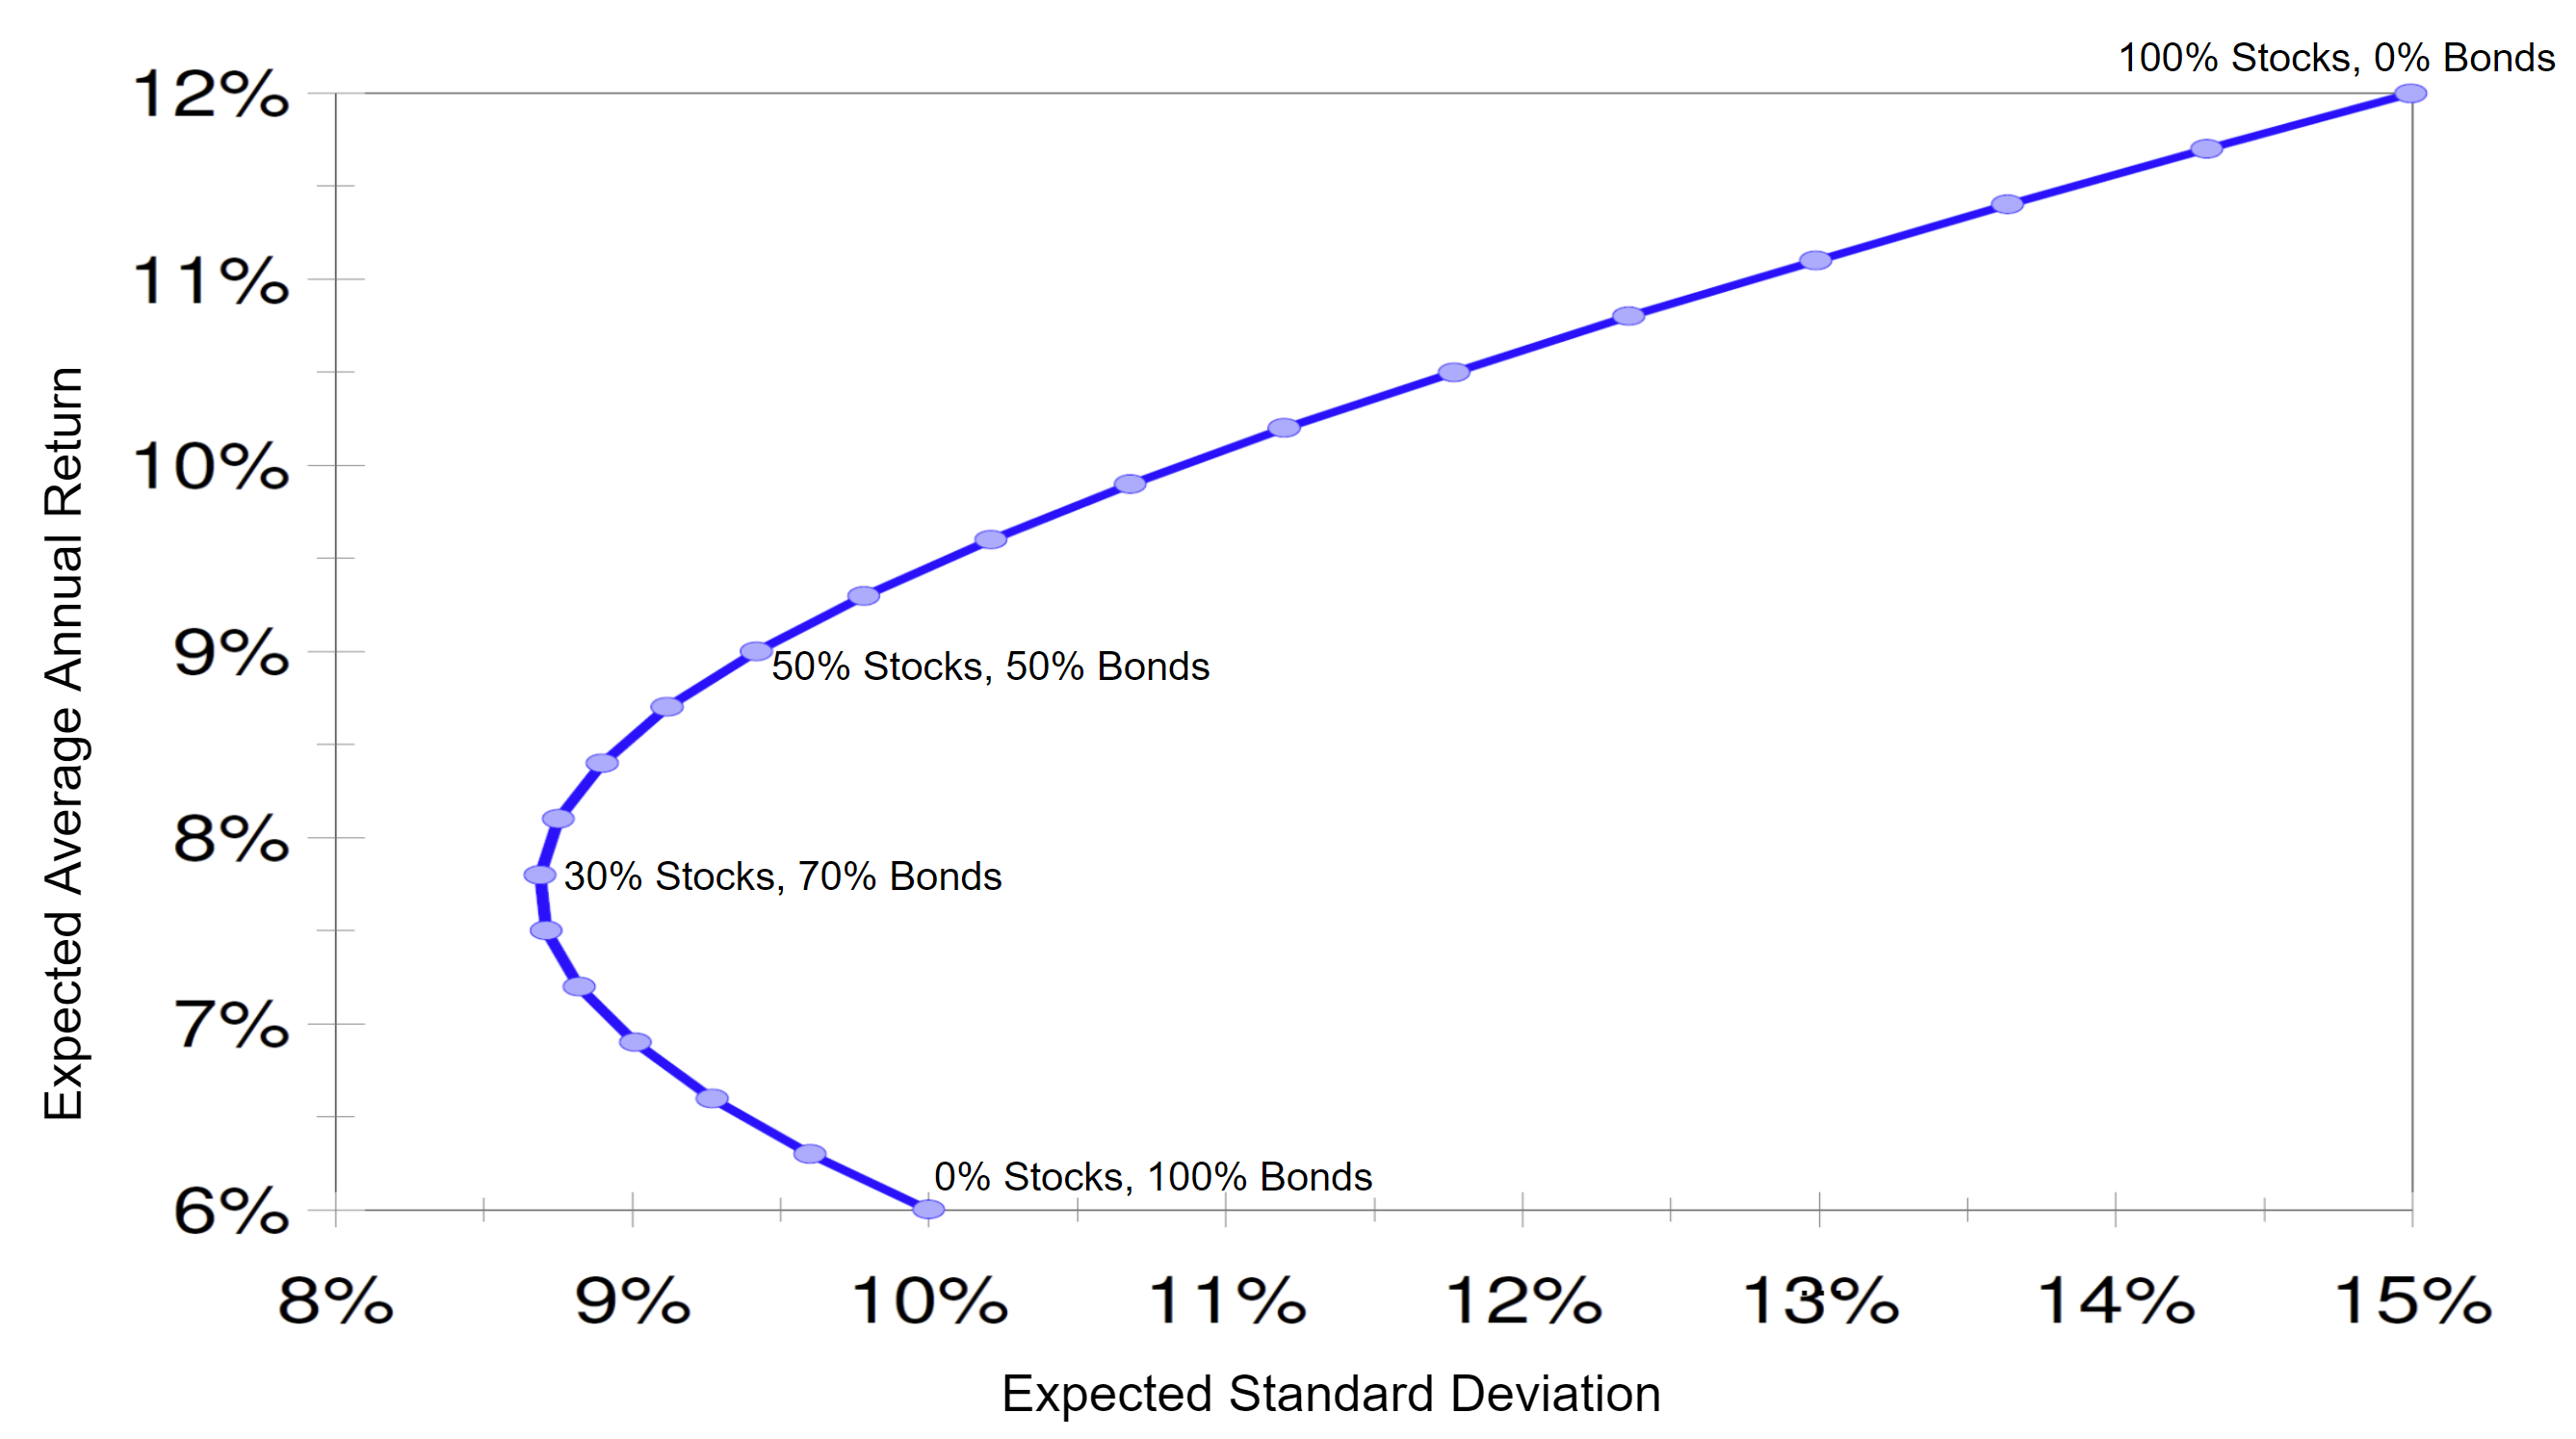
You may say to yourself, “Darned! That is still too much risk for me! I think I’m gonna’ stick to bonds!” You are a very conservative, risk-averse investor and you don’t like the volatility of stocks. Therefore, you decide to place all your investments into bonds. You will accept the lower return from the bonds in exchange for the lower risk of the bonds. Oops! Bad idea! Why? This is because, like stocks, bonds are positively correlated with themselves. Bonds also will tend to do well and do poorly as a whole and they are often negatively correlated with stocks! Stocks and bonds often but not always move in opposite directions. Stocks and bonds are typically negatively correlated.
Source: The Capital Group
| Stocks | Bonds | Standard Deviation | Expected Return | |
| 100% | 0% | 15.00% | 12.00% | |
| 95% | 5% | 14.31% | 11.70% | |
| 90% | 10% | 13.64% | 11.40% | |
| 85% | 15% | 12.99% | 11.10% | |
| 80% | 20% | 12.36% | 10.80% | |
| 75% | 25% | 11.77% | 10.50% | |
| 70% | 30% | 11.20% | 10.20% | |
| 65% | 35% | 10.68% | 9.90% | |
| 60% | 40% | 10.21% | 9.60% | |
| 55% | 45% | 9.78% | 9.30% | |
| 50% | 50% | 9.42% | 9.00% | |
| 45% | 55% | 9.12% | 8.70% | |
| 40% | 60% | 8.90% | 8.40% | |
| 35% | 65% | 8.75% | 8.10% | |
| 30% | 70% | 8.69% | 7.80% | |
| 25% | 75% | 8.71% | 7.50% | |
| 20% | 80% | 8.82% | 7.20% | |
| 15% | 85% | 9.01% | 6.90% | |
| 10% | 90% | 9.27% | 6.60% | |
| 5% | 95% | 9.60% | 6.30% | |
| 0% | 100% | 10.00% | 6.00% |
Source: The Capital Group
A combination of stocks and bonds actually created a portfolio with less risk while earning you more return than just bonds. If you are seeking less risk, it not only pays to diversify within an asset class, it pays to diversify among asset classes. The same kind of relationship occurs with domestic and foreign stocks and bonds although much less now than in the past. However, you already know what we are going to warn you about, right? Diversification is not a guarantee of positive results. For example, no diversification scheme worked well in 2008! We have a name for choosing the appropriate mix for an investor. It is called asset allocation and it is the subject of our next section.
Correlation and the Real World
Theories that work in the textbooks and laboratories sometimes fall flat on their faces in the real world. This is true for the expected negative correlation of stocks and bonds. Our theory tells us that a balanced portfolio blend of stocks and bonds should exhibit less risk than either a portfolio of only stocks or a portfolio of only bonds. Is this true in practice? The answer is, “Sometimes yes and sometimes no.” This textbook scenario played itself out to perfection in the 2000-2002 stocks bear market. Stocks fell almost 50% while bonds actually did well as interest rates fell from the effects of the post dot-com bubble recession. (Recall: When interest rates fall, bond prices rise.) This scenario did not work out so well in 2008 when both stocks and corporate and municipal bonds cratered. Indeed, everything except Treasury bonds tanked, including real estate and commodities. In 2022, the theory let us down again when stocks and all bond prices fell as interest rates rose and fears of a recession began to be voiced louder and louder. But this is the exception. You have to go back to 1969 to see a year when both stocks and all bonds fell together.
If we look at the risk measurements for sample stock funds, bond funds, and balanced funds for the last 10 years, we find that our theory has let us down yet again. Below is a table of stock funds, bond funds, and balanced funds. We expected the balanced funds to exhibit less risk than the stock funds and the bonds funds as measured by standard deviation. Ah, it didn’t work out that way.
| Ten-Year Standard Deviation Measurements for Sample Mutual Funds | |||
| Data as of May 15, 2023 | Stocks | Bonds | Balanced |
|
Dodge and Cox Funds Dodge and Cox Stock Fund Dodge and Cox Income Fund Dodge and Cox Balanced Fund |
17.25 |
4.27 |
11.96 |
|
Vanguard Funds Vanguard Windsor Fund (stocks) Vanguard Wellesley Fund (bonds) Vanguard Wellington Fund (balanced) |
16.53 |
6.74 |
9.94 |
|
Fidelity Funds Fidelity Contrafund Fund Fidelity Total Bond Fund Fidelity Balanced Fund |
15.27 |
4.57 |
11.38 |
|
Capital Group (American Funds) Growth Fund of America Bond Fund of America American Balanced Fund |
16.07 |
4.38 |
9.40 |
Source: Morningstar.com
Although a balanced portfolio does not always protect us as much as we may expect, the results from balanced funds can be very satisfying for the prudent, long-term oriented investor. Please consult the chapter 11 section of the class website to compare and contrast the results from a stock-only portfolio, a bond-only portfolio, and a balanced portfolio. A balanced portfolio of stocks and bonds helped us to eat reasonably well and sleep reasonably well.