
7.1: Technical Analysis
- Page ID
- 79780

We spent a considerable amount of time on Fundamental Analysis and investigated the claims of those who espouse the Efficient Market Theory. We will now explore Technical Analysis, the last major investment analysis strategy. The reality is that Your Humble Author is the last person who should be introducing you to Technical Analysis. As this textbook grows and evolves, we hope to find someone who will take this topic more seriously. Your Humble Author has a very difficult time keeping a straight face while discussing the techniques and concepts of Technical Analysis. For a more detailed and thorough excoriation of Technical Analysis, we once again refer you to the excellent book by Professor Burton Malkiel, A Random Walk Down Wall Street. Read it!
In the meantime, please accept our humble introduction to the concept, techniques, and skills of Technical Analysis. We promise that we will do our best not to break into a Monty Python skit about dead parrots, cross-dressing lumberjacks, or Vikings extolling the joys of breakfast Spam.
Technical Analysis versus Fundamental Analysis
Recall that Fundamental Analysis concentrated on the company. Fundamental Analysts study the financial condition and operating results of the business. The goal is to determine the intrinsic value of the company. What is the company worth? Fundamental Analysts study everything about the overall economy and industry conditions and everything about the individual company including the management, their competitive position, its composition and growth in sales, earnings, and dividends, their profit margins and the dynamics of company earnings, their customers, their vendors, the composition and liquidity of corporate resources, what assets are available, the company’s capital structure, how much debt, how much equity, etc., etc., etc. Simply put, the value of a stock is influenced by the performance of the company that issued the stock. The valuation models from chapter 4 and the ratio analysis from chapter 5 are examples of just some of the many available tools and techniques of Fundamental Analysis. But there are many investors who don’t utilize Fundamental Analysis.
Technical Analysis is the study of the various forces at work in the marketplace and their effect on stock prices. Those who adhere to Technical Analysis believe that they can predict the future price of a stock or the stock market by analyzing the behavior of the stock price’s history or the overall stock market. Technical Analysts pour over charts and attempt to interpret any one or many of dozens of so-called “Technical Indicators.” Simply put, the future price of a stock is influenced by factors other than the company’s fundamental future outlook.
The Argument for Technical Analysis
Advocates of Technical Analysis note that stock prices do tend to move in tandem to the stock market as a whole. Hence, they believe that the overall behavior of stock prices will affect an individual stock’s price. When the market is rising, most stocks rise with it. There is an old Wall Street saying: “A rising tide lifts all boats.” Likewise, when the market is falling, most stocks are brought down with it. The rebuttal to this argument is that this is just the foundational economic concepts of supply and demand at work. When stocks are in favor, prices rise. When stocks become out of favor, prices fall. Returning to the research of the Efficient Market Theorists, we reiterate that there has never been a reliable methodology for predicting the short-term behavior of the stock market. Of course, there have been plenty of unreliable methods.
For an example of one of the most infamous examples of methodologies that was at first believed to predict prices in the short-term, only to ultimately fail miserably and almost bring down the entire financial system, we refer you to the story of Long-Term Capital Management. Roger Lowenstein chronicles the story in his book, When Genius Failed: The Rise and Fall of Long-Term Capital Management. The PBS series, Nova, also related the story in their documentary, The Trillion Dollar Bet. The story of Long-Term Capital Management reads like a prequel to the Global Financial Crisis of 2008. The technology changes, human nature, not so much.
Market Price Indicators
Technical Analysts often rely on recent stock market movements and individual stock price changes for making decisions. One technique they utilize is momentum trading. “The trend is your friend,” is a favorite saying. This works great as long as the trend is trending your way. When the trend turns, you had better be quick enough to change directions with it. However, as we have discussed, we retail investors are hopelessly outmatched against the high-frequency-trading (HFT) firms. Momentum trading is one of those techniques that Charles Ellis labeled, “The Loser’s Game” way back in the 1970’s. Momentum trading for us retail investors has only become much more difficult since then. Since it has already been statistically demonstrated that stock prices in the short term are randomly distributed, we wish the Technical Analysts much luck in their usage of momentum trading. They will need it.
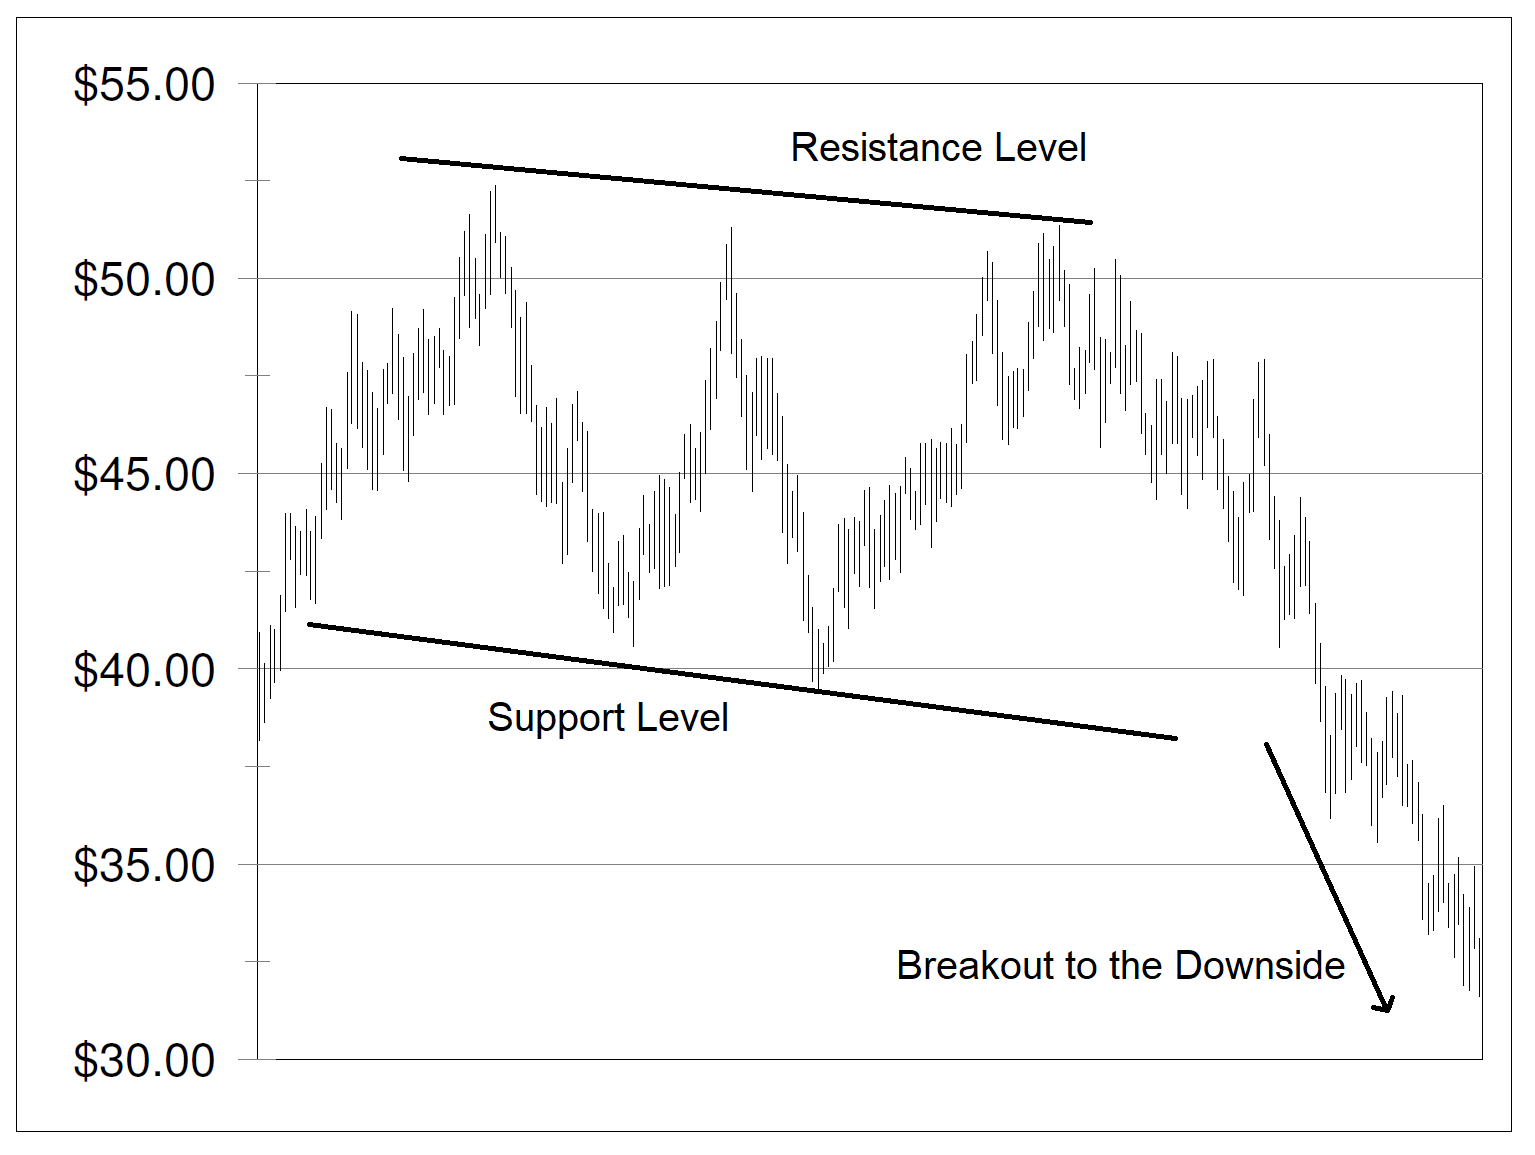
Two popular market price indicators are the support level and resistance level. The support level is a chosen price or level below which a stock or the market as a whole is unlikely to fall. Likewise, the resistance level is a chosen price or level above which a stock or the market as a whole is unlikely to rise. That is, of course, until the market price does rise above or fall below the chosen level. When that inevitably happens, it is called a breakout. Below are examples of the charting of support and resistance levels. A Technical Analyst must become proficient in choosing the correct support and resistance levels and then determining when the breakout will occur and whether the price will breakout to the downside below the support level or breakout to the upside above the resistance level. Since it has already been statistically demonstrated that stock prices in the short term are randomly distributed, we wish the Technical Analysts much luck in their usage of support, resistance, and breakout trading. They will need it.

Source: CC BY-SA 3.0, https://en.Wikipedia.org/w/index.php?curid=6127005
Technical Analysts also watch for psychological barriers for stock market levels and stock prices. Examples are the Dow Jones Industrial Average closing in on the 40,000 level or the Standard and Poor’s 500 close to the 5,000 level or a stock price that is close to $100. Supposedly, these psychological barriers act as resistance levels until the inevitable breakout to the upside. Since it has already been statistically demonstrated that stock prices in the short term are randomly distributed, we wish the Technical Analysts much luck in their usage of psychological barrier trading. They will need it.
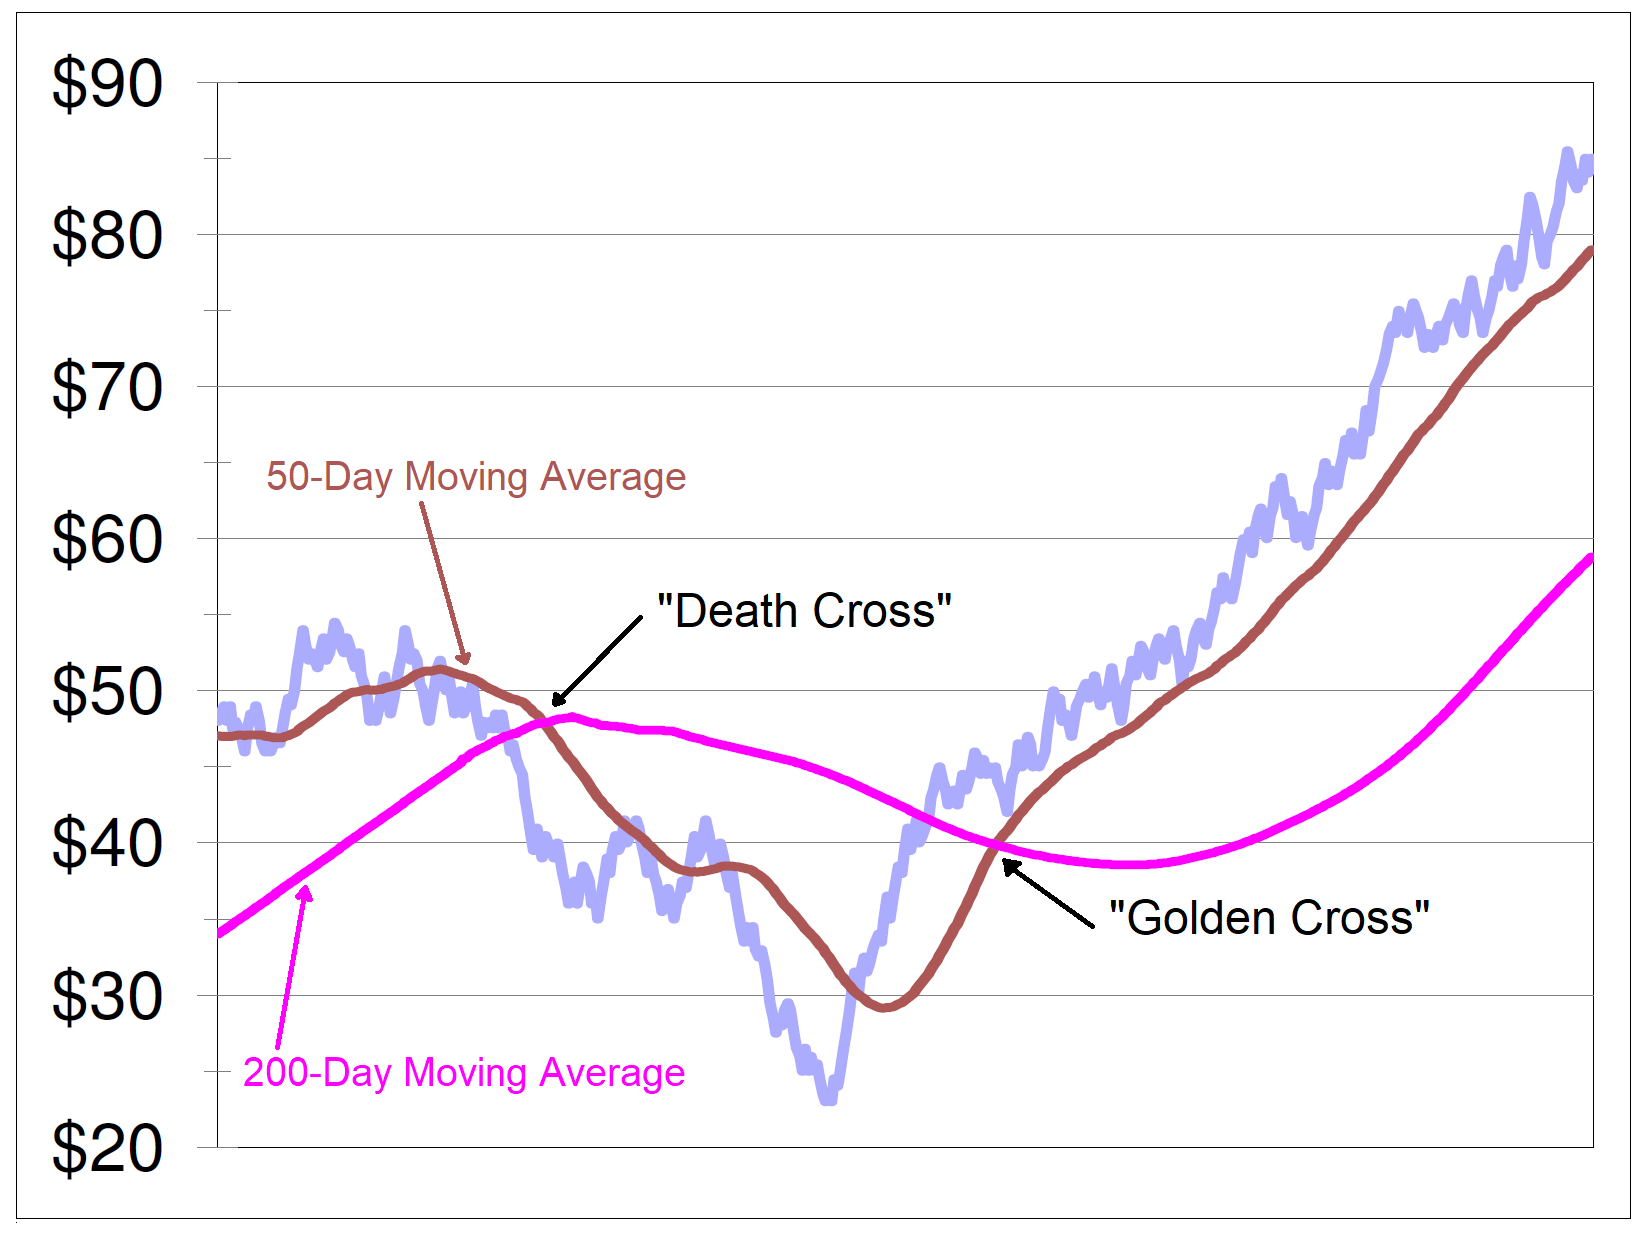
Our last price indicator is the very popular moving average. A simple moving average is the average of a stock price or stock market index level, calculated using a fixed number of previous days’ prices or levels. The 15-day, 50-day, and 200-day moving averages are typically employed, although many other moving averages are used. For example, to calculate the 15-day moving average, we calculate the average price for the last 15 days. The next day, we do the same calculation but now for the previous 15 days. We continue to do so going on into the future. Technical Analysts will then compare the 15-day moving average with the 50-day moving average or the 50-day with the 200-day. When the shorter moving average crosses the longer moving average, that is called a crossover. Crossovers are often considered trading signals, events that warrant the Technical Analyst that there is a strong reason to make a trade. In fact, two such crossovers have special names. When the shorter moving average crosses above the longer moving average, that is called a golden cross and is considered a bullish sign and a signal the price will rise. When the shorter moving average crosses below the longer moving average, that is called a death cross and is considered a bearish sign and a signal the price will fall. Please see the figure below for examples of the golden cross and death cross. The moving average is so popular that there are several variations of it used. Since it has already been statistically demonstrated that stock prices in the short term are randomly distributed, we wish the Technical Analysts much luck in their usage of moving averages. They will need it.
We have looked at just a few technical indicators. There are dozens and dozens of others. If you find any that actually do accurately and consistently predict the future price of stocks, please be sure to let us know. Good luck, by the way.
The Dow Theory
The Dow Theory has been around a very long time. It was originally proposed by none other than Charles Dow, one of the co-founders of the Dow Jones Industrial Average and the Wall Street Journal. Sadly, Mr. Dow passed away before he published the full theory. Since then, others have expounded upon the theory without the benefit of Mr. Dow’s insight. To the best of our understanding, the theory states that if the market does not go up or down, it will go sideways. Since it has already been statistically demonstrated that stock prices in the short term are randomly distributed, we wish the Technical Analysts much luck in their usage of The Dow Theory to assist in short-term trading. They will need it.
Relative Strength, Market Volume and Breadth, and the Tick
Relative strength, market volume, market breadth, and the tick are additional technical indicators used to assist Technical Analysts in their pursuit of riches beyond their wildest dreams. If you really want to know more about them, just follow the links. Since it has already been statistically demonstrated that stock prices in the short term are randomly distributed, … oh, wait. You have read this all before, yes? Our apologies. It is difficult for us to treat this hogwash seriously. Research high-quality companies, buy and hold them for the long term, and ignore anyone trying to get you to utilize Technical Analysis as a short-term trading technique.
Short Interest
Now here is an indicator that can actually be a useful tool to long-term investors. Short interest is the number of shares of stock that are sold short in the market at any given time. We will cover the details of short selling in more detail at the end of our journey together. In brief, short sellers want the price of a stock to go down. The more shares of a stock are sold short, the more investors believe the stock price will fall. For some reason, short investors are somehow considered more “sophisticated” and are therefore supposed to know when the market will fall. However, when large numbers of investors sell short, eventually they must buy the shares back. This creates a pent-up demand for stocks. A large amount of short interest is like a compressed spring. Eventually, there will be a “short squeeze” and the price will rise. For long-term investors, a large amount of short interest can then become a contrarian indicator. If long-term investors see that a large amount of short interest has driven down the price of a desirable company, they can use this situation to buy shares for the long term.
Your Humble Author was living through his first bear market as a market professional in 2000 through 2002. In August of 2002, the Standard and Poor’s 500 index was on its way to falling almost 50% since March of 2000. It was reported that the number of shares sold short on the New York Stock Exchange was the highest it had ever been in the history of the market. That gave Your Humble Author great comfort as I was absolutely sure we were coming to the end. The market bottomed in October of 2002. That is when you started to hear people ‒ including other market professionals ‒ say, “Ooo, ooo, ooo. Is it too late to get out?” History may not repeat itself perfectly, but it rhymes!
Contrarian Opinion
Another indicator that may be of use to prudent, long-term investors is Contrarian Opinion. Contrarian Opinion is the theory that if people are very optimistic, that is a predictor of falling prices for the market, and if people are very pessimistic, that is a predictor of rising prices. Therefore, we all should be as bearish as possible and that will make the market rise, right? We covered the Contrarian Strategy already in Investment Strategies. The idea is to buy when others are selling, sell when others are buying. The problem is the market historically has gone up three times more often than it goes down.
There is a journalist who has made it his life’s mission to track the consensus sentiment of the multitude of published stock market advisory newsletters. Mark Hulbert publishes the Hulbert Stock Newsletter Sentiment Index. When in the aggregate the newsletters are all extremely bullish, that has been a fairly accurate indicator that the stock market returns for the next several years will be poor. Likewise, when the newsletters are predicting gloom and doom, the actual returns over the next several years are often favorable. As with any indicator, it is not perfect. Mr. Hulbert himself also recommends that prudent investors take a long-term perspective and simply identify high quality companies and hold them for the long term.
Odd-lot Trading
A dubious technical indicator is the odd-lot trading indicator. The theory is based on the idea that small investors tend to buy and sell in odd lots. Recall that an odd lot is less than 100 shares. The saying is, “The best thing to do is the opposite of what small investors are doing.” If old-lot trading rises, it supposedly means that more and more small investors are entering the market. Small investors are supposedly notorious for getting into the market at the top of a bull market. Not only is the research and data behind this theory very suspect, technology has made odd-lot trading commonplace.
Charting Examples
Finally, the most celebrated weapon in the Technical Analyst’s arsenal is charting. Charting is the activity of using price behavior and other market information to create charts and then superimposing patterns the charts form to make investment decisions. The moving averages and the resistance and support levels that we discussed above are examples of popular charts. Also popular are open-hi-lo-close (OHLC) charts and candlestick charts. Both are types of bar charts that use each day’s price information. For a short-term trader, if the closing price is higher than the opening price, that is supposedly a bullish candlestick. Likewise, if the closing price is lower than the opening price, that is supposedly a bearish candlestick. Since it has already been statistically demonstrated that stock prices in the short term … oh, no! We won’t start that again! We will leave it up to you, Dear Reader, to determine the value of these and the chart patterns that follow.
The most famous chart pattern is the head and shoulders chart. When Your Humble Author took the Series 7 Stockbroker Exam in 1998 (discussed in our next section), the only question about Technical Analysis dealt with the head and shoulders chart. The question simply asked if one was aware of this famous pattern. The head and shoulders chart is supposedly a bad sign. Don’t bother asking anyone why this is so because it is just so obvious why it is a bad sign, right? (Sarcasm included at no cost.) Other popular chart patterns are triangles and wedges, flags and pennants, and cups and handles. The reader is left to decide whether to spend any valuable time researching and possibly using any of these tools for trading their way to untold riches and fame.
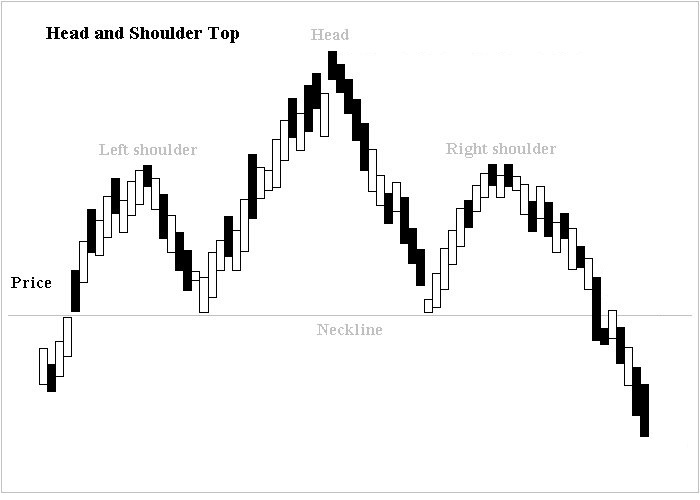
Source: Altafqadir: This work is licensed under the Creative Commons Attribution 3.0 License.
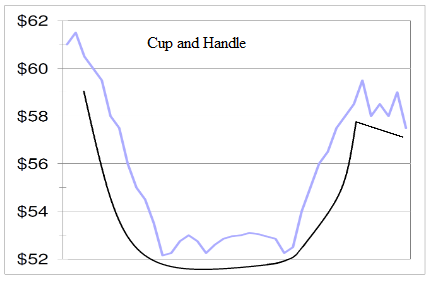

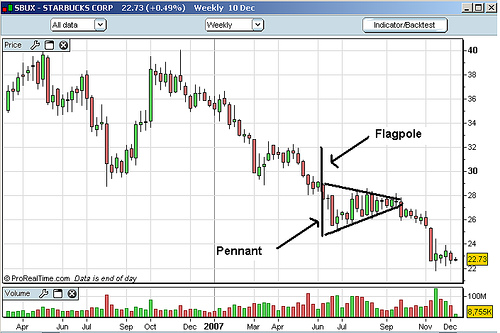
Sources: Commontrader - Own work, CC BY 3.0, https://commons.wikimedia.org/w/index.php?curid=5556078; https://commons.wikimedia.org/w/index.php?curid=5556071
For the final word on Technical Analysis, we will quote from a real live Technical Analyst who was asked what his short-term prediction for the stock market was.
“The market’s rise after a period of reaccumulation is a bullish sign. Nevertheless, fulcrum characteristics are not yet clearly present and a resistance area exists 40 points higher in the Dow, so it is clearly premature to say the next leg of the bull market is up. If, in the coming weeks, a test of the lows holds and the market breaks out of its flag, a further rise would be indicated. Should the lows be violated, a continuation of the intermediate term downward trend is called for. In view of the current situation, it is a distinct possibility that traders will sit in the wings awaiting a clearer delineation of the trend and the market will move in a narrow trading range.” ‒ A Random Walk Down Wall Street
Ah, I think it means, if the market does not go up or down, it will remain unchanged. So, really, Folks, if you want to make a ton of money on Wall Street as a Technical Analyst, all you have to do is learn how to convince people you know what you are doing even though you don’t. Could a $500,000 per year ‒ plus bonuses! ‒ job be in your future? Think about it! (Oh, by the way, if you do become a Technical Analyst, we wish you much good luck! You will need it.)