
6.4: Active versus Passive Management Revisited
- Page ID
- 83495

Video - Audio - YouTube (Material for this section starts on slide #20.)
In our discussions of index funds and passive management in chapter 2, we discussed the controversy surrounding active versus passive management. Passive management advocates will often make the claim that nobody can beat the market, something we have already seen is simply not true. One aspect of passive management that is not usually discussed is the effect that manias and crashes have on passive management and index funds.
Passive Management, Index Funds, Manias, and Crashes
When a mania occurs, especially if it is concentrated in a particular country or sector of the economy, index funds may become skewed and their holdings lopsided toward that country or sector. This is a serious problem with smaller and more obscure indexes but sometimes it is even a problem with broadly based indexes.
In the graphic below, we see the composition of the MSCI EAFE index as of December 31, 1989, and the composition of the Standard and Poor’s 500 Index as of March 31, 2000. Recall that the MSCI EAFE was designed to track the international stock markets outside the United States. (It has been replaced by the wonderfully named MSCI All Country World Index ex-USA. Now there’s a name you won’t quickly forget, right?)
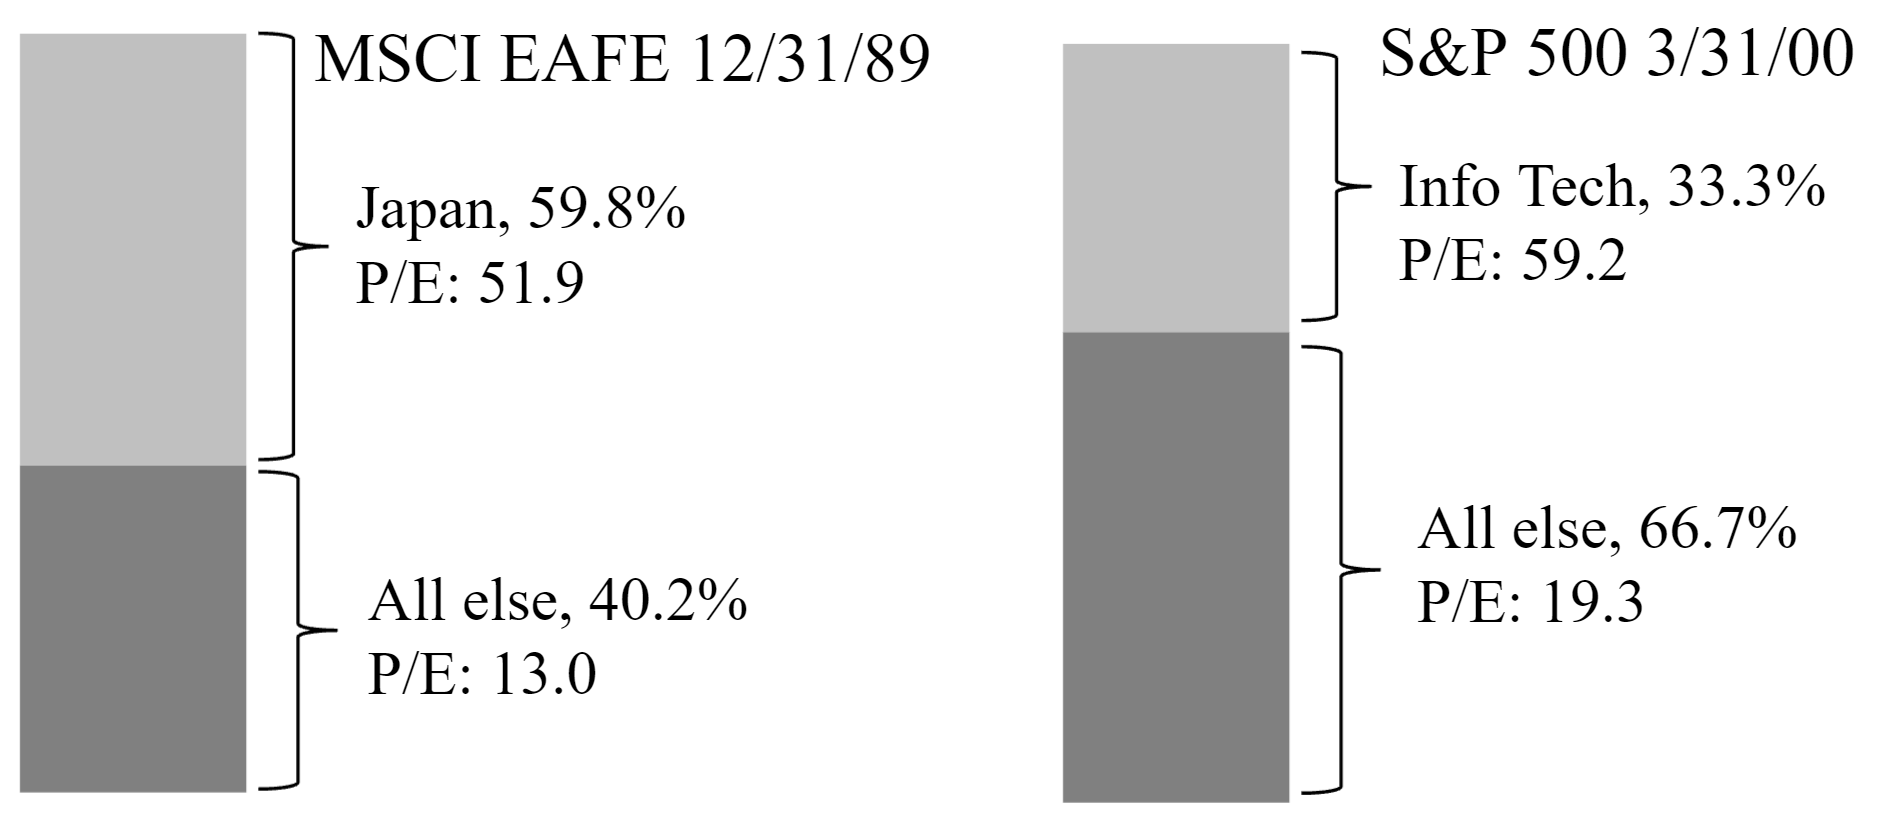
Source: Capital Group
In the late 1980’s, the Japanese stock market and real estate market skyrocketed. What happened is the EAFE became skewed toward Japan, so much so that fully 60% of the value of the index was composed of Japanese stocks. All the other countries and areas, Canada, Western Europe, Australia, Hong Kong, Singapore, etc. made up only 40% of the index. Note the Price-to-Earnings ratios of each. The Japanese stock market had a P/E ratio of 51.9 when all the other markets had a P/E ratio of 13.0. An investor believed they were getting a well-diversified, broadly based index when in reality, almost 60% of their investments were concentrated in Japan with a very high Price-to-Earnings ratio. By August of 1990, the Japanese stock market had fallen in half. From a peak of almost 39,000 in 1989, the market fell to approximately 7,500 at its lowest point in 2008/2009.
The same phenomenon happened to the S&P 500 during the late 1990’s. The Information Technology sector, the so-called “New Economy” stocks, soared. It became known as the Internet bubble, also called the Dot-Com Bubble. The NASDAQ Composite index, which is often used to track the technology sector of the economy, went from 800 in 1995 to 5,000 in March of 2000. Subsequently, fully one third of the S&P 500 was composed of the technology sector stocks. Two thirds were everything else in the United States economy, real estate, health care, energy, consumer products, etc. Note the relative P/E ratios. The technology sector had a nosebleed Price-to-Earnings ratio of almost 60. Everything else had a lofty but not outrageous P/E ratio of a bit over 19. What happened next? Although most stock prices suffered over the next two and half years, the prices of stocks in the technology sector collapsed. Many Dot-Com companies evaporated, never to be seen or heard from again. Recall that between March of 2000 and October of 2002, the NASDAQ Composite dropped to approximately 1,100 before starting to recover.
This same phenomenon is playing itself out somewhat in recent years. As of March 2022, the valuations of the top ten stocks in the S&P 500 reached unprecedented levels. Our Introduction to Investments class at Southwestern College has a bonus assignment on mutual funds. We ask the students to identify the percentage of the S&P 500 index that is made up of just the top ten stocks. Investors who are putting resources into S&P 500 index funds believe they are getting a broadly based, well-diversified index of stocks. In March of 2022, what they were really getting was approximately 30% of just 10 companies. Fifty out of 500 companies made up over 50% of the index. The Russell 1000 Growth Index was even worse. This index is used by many Exchange-Traded Funds. On March 24, 2022, the top ten companies constituted approximately 46% of the entire index of over 500 companies in the iShares Russell 1000 Growth ETF! The bear market of 2022 brought these levels down somewhat but they are still elevated. How will it end? We shall see. But we hope the parachutes are very large for investors of these very large growth companies.
The Argument for Active Management
Today in the financial media, passive management is touted as the better alternative to active management. As we saw, index funds do have the advantage of very low-cost investing. (That is, of course, unless your third-party administrator sneaks a high-cost index fund into your 401k. Be wary and review the fees in your 401k plan carefully. Your colleagues will thank you!) But decades ago, Benjamin Graham warned against any investment strategy that relied on deterministic or robotic decision making and removed the element of human judgment. And as we have discussed, there are individuals who have excelled in the investment world. There are investors who have “beaten the market.”
“As with any human endeavor, whether it is athletic competition, the performing arts or technological innovation, some people clearly perform at a higher-than-average level.” – Mark Denning, mutual fund manager with over 35 years of experience
The trick for us mutual fund investors is to find those individuals who have clearly performed at a higher-than-average level for decades. They are out there. A good start are the six mutual fund families that are listed in the chapter 2 section of the Introduction to Investments class website. But they are not the only ones. As we have mentioned before, you have an entire lifetime of research and discovery ahead of you when you begin the journey of investing.
Remembering that we are not rational beings, one must be careful when pointing out the disadvantages of passive investing. Many investors have convinced themselves that no active managers can beat the market even though there are many who have. If you point out this contradiction to them, be prepared for a vitriolic response. They will accuse you of being a shill for the money managers and companies that have beaten the market. At the very least, they will repeat the Efficient Market theorists’ thesis that those managers are just lucky. Right. “And the more I practice, the luckier I get.”
The Argument against Active Management
Apart from the cost, there is another very good reason that some investors might prefer passive management and index funds. One never knows when and whether your active money manager might succumb to some of the more foolhardy and ridiculous ...
Anomalies, Silly Theories, and Oddities
Given the financial incentive to discover a surefire way to make untold riches in the stock market, throughout the years, various theories, systems, and traditions have emerged. Most are superstition and downright silliness. There is the Lipstick Indicator that watches the sales of lipstick and other small indulgences to determine whether a recession is on the horizon. The Boston Snow Indicator, often referred to as the B.S. Indicator, posits that a snowy Christmas in Boston will signal a market upswing in the coming year. A particularly sexist and offensive oddity is the Hot Waitress Indicator. Don’t bother investigating this one. The Aspirin Count Theory believes that the higher the sales of aspirin, the worse the market is doing, and vice-versa. Hemlines of skirts were also supposed to predict the markets. In the 1920’s and 1960’s, skirt hemlines went up and so did the stock markets. In the 1930’s and 1970’s, hemlines went down, and so did the stock markets. You decide what to make of this theory.
However, the most popular and one of the silliest indicators is the Super Bowl Theory which states that the market will do well if a NFL National Conference team wins and will do poorly if an American Conference wins. That this so-called theory gets attention every year at Super Bowl time is a testament to the urgent need of media outlets to create some kind, any kind, of content to fill up the airwaves and Internet. When it was first introduced in 1978, the correlation had been 100%. The Super Bowl Theory had never been wrong. Have these people never heard of coincidences? For example, what would you think if we told you that the per capita consumption of mozzarella cheese correlates with 96% accuracy to the number of Ph.D. awards in Civil Engineering? Or that there is almost 100% correlation between United States spending on science, space, and technology and suicides by hanging, strangulation, and suffocation? Unless you are already a dyed-in-the-wool conspiracy follower, you would conclude that these are mere coincidences. The same is true of the Super Bowl Theory and all the other previous theories.
There are also Timing Theories that dictate when and how you should buy and sell. Supposedly, Monday is the best day to buy stocks. Or maybe it is the best day to sell stocks. We don’t recall. Some individuals look at January and if January does well, then the year will do well. As we have mentioned, the stock market generally goes up more often than it goes down. So, in truth, we could pick any month of the year and say, “If the stock market goes up in June, it will go up in the next twelve months,” and we would be correct more often than we would be wrong. Others expect there to be a Santa Claus rally at Christmas time. Of course, if the market falters in December, they will chalk it up to tax-related selling. There is one piece of advice that starts with empirically proven statistics and that is the adage, “Sell in May and go away.” Traditionally, the best months of the year are from November to April. September is the worst month of the year and October is close behind. However, trying to trade in and out of stocks using this information is a fool’s errand. The difference in returns over decades is very small. As Jack Bogle would admonish us, this particular contrivance has no business being in the investor’s toolkit. For us prudent, long-term oriented investors, a buy-and-hold strategy remains the best course of action. “Chill in May and go on vacation!”
Let’s end our discussion of silliness with a place that is synonymous with childishness and absurdity, and that is Washington, D.C. The conventional wisdom is that the markets will perform better with a Republican president in charge and worse with a Democrat in charge. In actuality, the reverse is true. Of course, over the long term, the difference is small. However, the reason for this is more a result of dumb luck than anything else, bad luck on the part of Republican presidents and fortunate luck on the part of Democratic presidents. Hoover, Nixon, and Bush, Junior, were in charge when the markets had some of their worst downturns in modern history. Kennedy/Johnson, Clinton, and Obama were in the White House when the markets produced some of their best returns. The reality is that both parties are pro-capitalism, no matter how the slogans and advertising might try to paint the other party. Again, for us prudent, long-term investors, it is not something we should concern ourselves with. Focus on buying and holding high-quality companies with solid businesses and leave the political arguments for when your crazy Uncle Lucas comes for Thanksgiving Dinner.