
4.4: The Value Line: All the Financial News That’s Fit to Print
- Page ID
- 83311

The Value Line is an investment research company that collects data and analyzes the performance of thousands of companies. They have been around for decades and are still one of the most respected and trusted sources of data and analysis. Traditionally, it was often the only source many investors used for data and analysis of a stock, along with the company’s annual and quarterly reports, the 10K's and 10Q's. The Value Line is expensive but can be obtained for free at various libraries. Your Humble Author is a big fan of The Value Line, especially their Timeliness and Safety indicators. One study which ignored transaction costs and tax consequences only used their Timeliness indicator. It showed how you would have beaten the market handsomely over a twenty-year period by just buying and selling stocks as they received and lost their #1 Timeliness designation.
Recently, The Value Line has switched to the so-called “freemium” business model that is very popular with Internet websites. An individual has access to some of their data for free on their website but must subscribe to one of their packages to get all the data on companies.
A Sip from the Financial Fire Hose
Let’s take a sip from the financial fire hose. Scan through the The Value Line February 11th, 2022, report for Johnson ‘n’ Johnson, the medical company. Can you find the following?
- The Value Line indicators?
- The future price projections?
- The historical data?
- The cash assets, receivables, inventory, and other assets?
- The description and analysis of the business?
- The historical annual rates?
- The insider and institutional buying & selling?
- The amount of debt and number of shares outstanding?
- The company’s financial strength, stability, price growth, and earnings predictability ratings?
Do you see the highlighted historical yearly dividends? From them, we can easily compute the dividend growth rate. Do you see the predicted price in three, four, or five years? Yes, they are giving us a range and we must use our own judgment but at least now we have a prediction from a company with a long track record of excellent results. By the way, do you remember when we were discussing mutual funds and we said approximately a 20%, 25%, or 30% annual turnaround was recommended? That means the mutual fund managers are holding on to their stocks for an average of 3, 4, or 5 years. That is about as far into the future that anyone would dare predict, including The Value Line.
Plus, did you look at the Annual Rates section? The Value Line has already computed the dividend growth rate for the past 5 and 10 years and is giving us their prediction for the dividend growth rate for the next three to five years. We could compute our own historical growth rate for whatever number of years we wanted or we could use their computed historical growth rates. And we could use our own judgment for the dividend growth rate going into the future or use theirs. Last, read the analyst’s report. It gives you a very good idea of where the company is and where they are heading. Your Humble Author does not make any decision about an individual stock without consulting The Value Line!
Example Stock Predictions using Our Models and Data from The Value Line
Now let’s use the data from The Value Line to compute the Gordon Growth Model, the Discounted Cash Flow Model, and the Internal Rate of Return for Johnson ‘n’ Johnson. We are breaking the spreadsheet into three parts below. However, when you use the spreadsheet, you will see all three parts on one page.
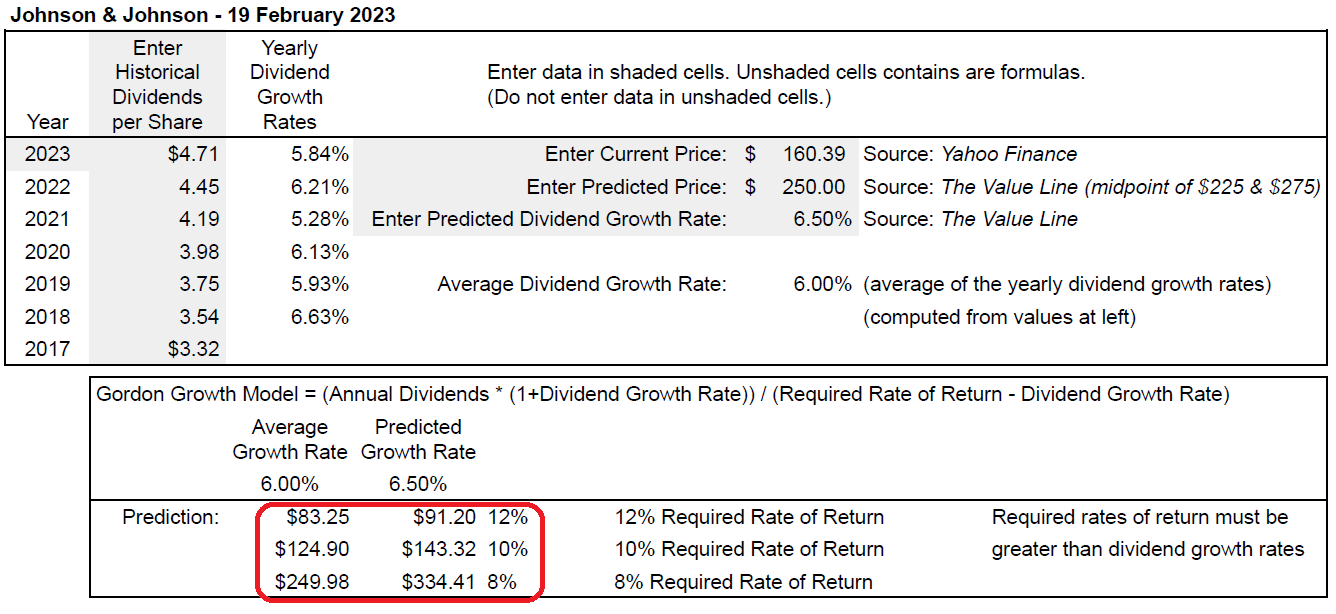
In the shaded areas, we enter the historical dividends per share, the current price, the predicted price in 3, 4, or 5 years, and The Value Line’s predicted dividend growth. The spreadsheet does the rest! This part calculates the Gordon Growth Model predictions. Note how our choice of required rate of return changes the prediction results drastically.
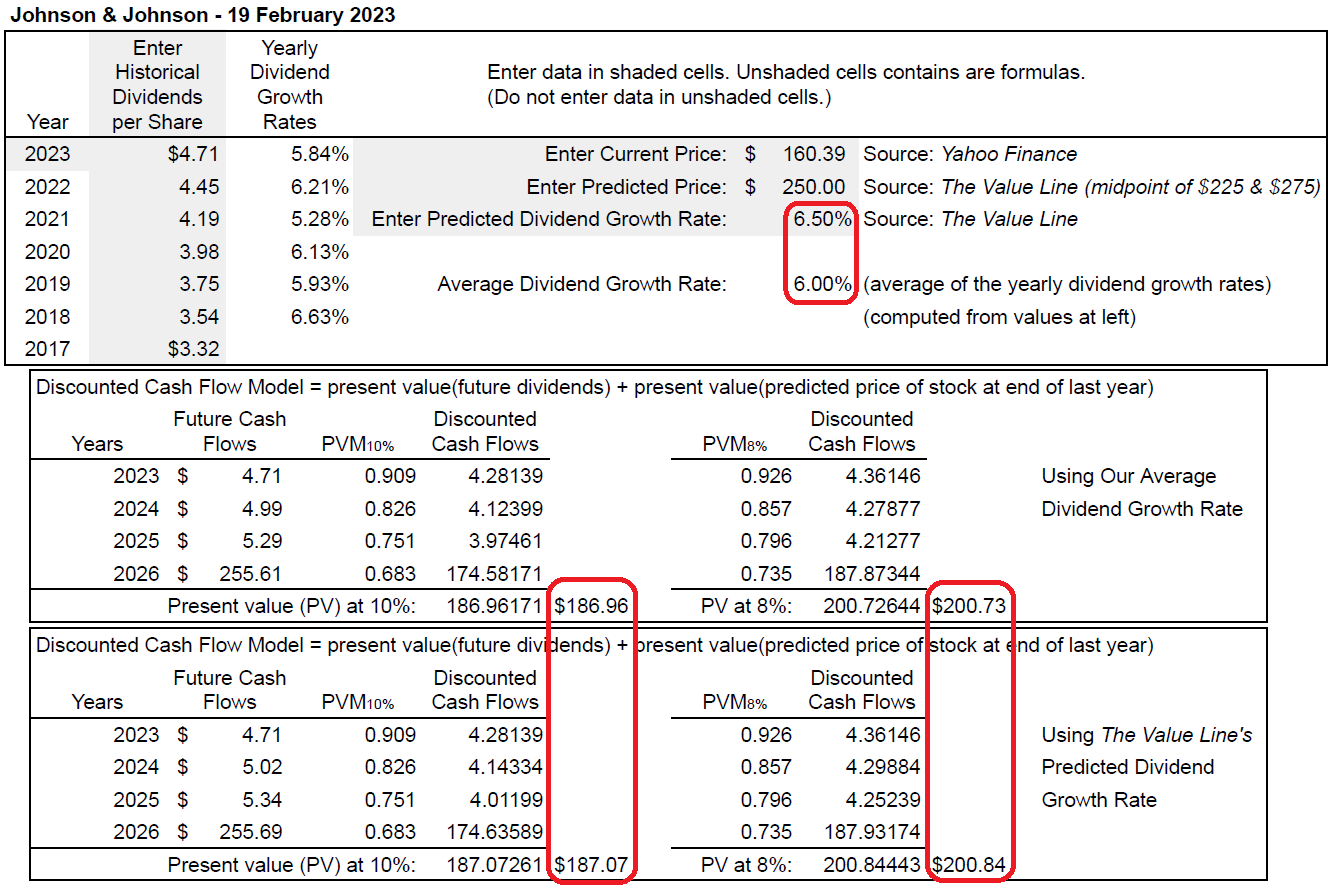
Here we calculated the predictions from the Discounted Cash Flow Model using both the average dividend growth rate of 6.00% over the past seven years and The Value Line’s predicted dividend growth rate of 6.5%. They yield very similar results.
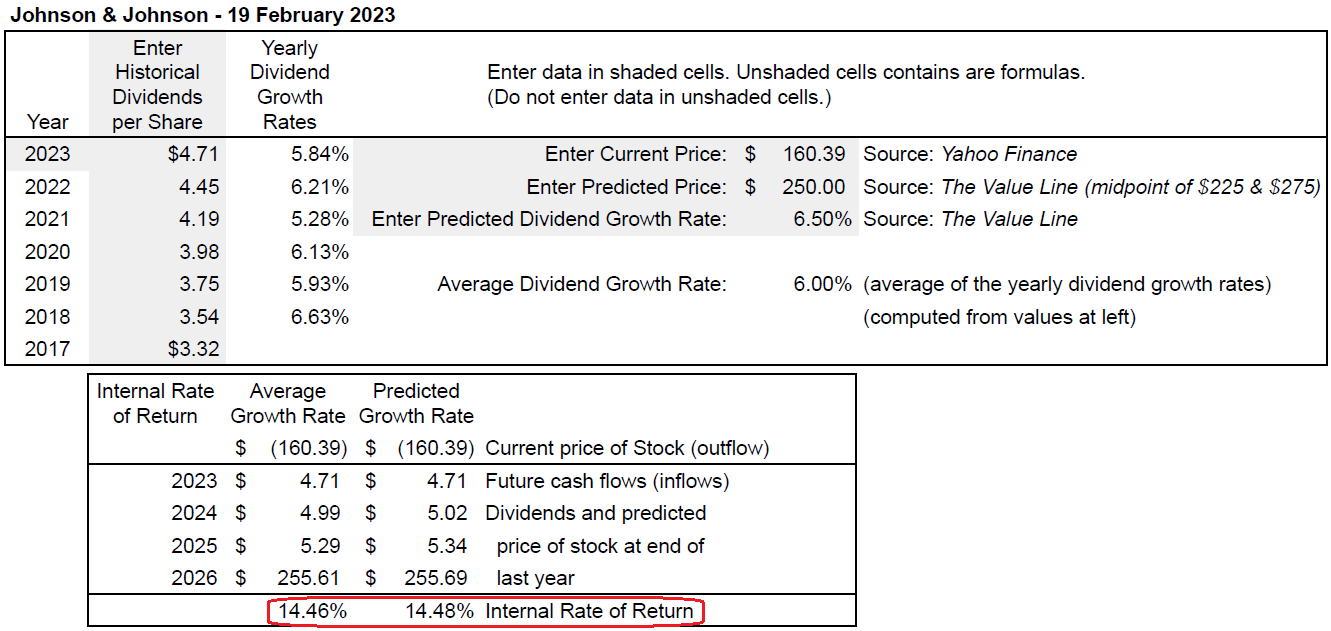
The Internal Rate of Return calculations using both average dividend growth rate and The Value Line’s predicted dividend growth rate again give us similar results. Would you consider owning Johnson ‘n’ Johnson? Ah, have you ever used Q-tips or Band-Aids? How ‘bout Tylenol? Oh, by the way, you may have gotten their Covid-19 one-dose vaccine, too.
I can hear you saying, “Aye, Paiano! Do we have to use the spreadsheet? It’s so confusing!” We promised that you could perform all the calculations in this course with a 99¢ calculator and we have kept that promise. You can do all these calculations manually but wouldn’t you rather bang away at the spreadsheet until you figure out how to use it. It really ain’t that hard! Again, spreadsheets are kinda’ like a big Bingo calculator: B3 + N15 - G11 … and so forth. The real prize here is that all we need to do is consult The Value Line for the data to go into our spreadsheets or to use in our manual calculations. Are you excited? Are you ready? Good! Because, ...
Now it’s your turn! Find a library near you that has The Value Line. Before you go, think of a few companies that you would like to research, maybe downloading their annual reports from their websites beforehand. Ask the reference librarian for The Value Line packages. Find the Index of companies in alphabetical order. The Index will tell you which packet contains the company you are seeking. The Value Line groups competitors close to one another so you can easily look at the competition. Get lost! Ah, in a nice way, that is. Have fun! Before you leave the library, flip through The Value Line Index and gawk at the sheer number of publicly traded companies. Could any one person ever become qualified to give advice on more than a small percentage of the companies available? Is it any wonder that mutual fund companies have entire global research teams of highly qualified individuals? In my humble opinion, this is a great opportunity for us individual retail investors. There will never be an end to how much you can learn! You now have a lifelong, fun-filled, profitable hobby. You’re welcome, by the way.
Some speculators and traders love to trash The Value Line. “They are old-fashioned! They are stodgy and out-of-touch!” The Value Line makes mistakes, too, just like everybody else. But it would be very illuminating how their long-term results stack up against the long-term results of The Value Line! Who do you think would have the better results?