
1.4: Risk versus Return ‒ The Eternal Struggle of Investing
- Page ID
- 79465

Here it is, Dear Readers! This is the entire course in one section! Do you want to eat well or do you want to sleep well? By now, you should be seeing that there is a pattern in the world of investments. The more return you want from your investments, the more risk you will have to accept. In the previous section, we saw that stocks have given us the best returns over time but have also subjected us to the most risk. Bonds are less risky but give us less return. Short-term investments are risk free or pretty darned close but they pay very little. Mutual funds will more or less reflect the underlying assets that they invest in. In the corresponding presentation on risk versus return, you will see how these various investment asset classes have done over very long periods of time. We see that stocks are the stars! Bonds are a distant second. And short-term investments have barely kept up with inflation and currently are losing to inflation. Take a quick look at this graph that compares stocks (businesses), bonds (loans), Treasury bills (short-term guaranteed investments), and inflation as measured by the Consumer Price Index.
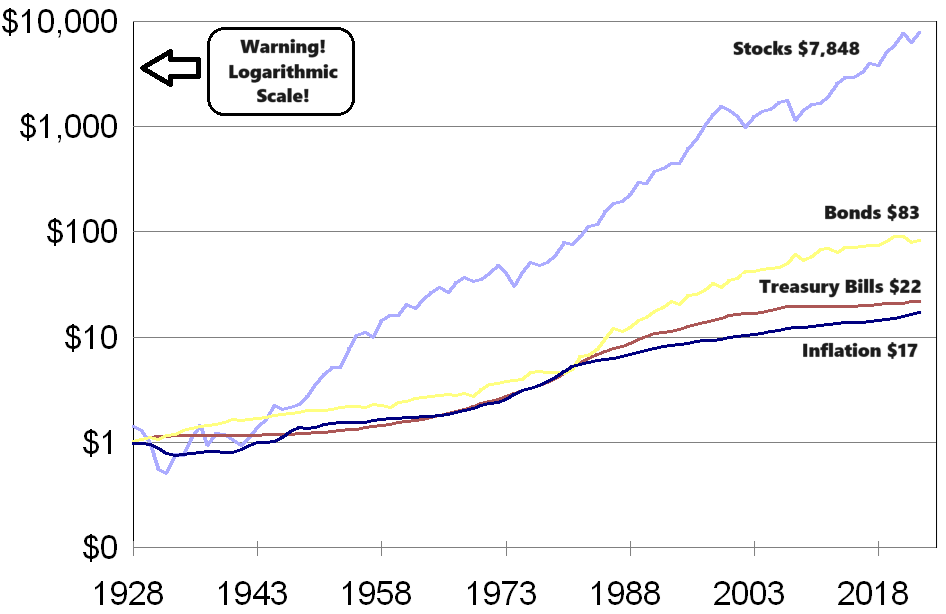
Source: NYU Stern School of Business, Federal Reserve Bank of Minneapolis
We see that the rewards from investing in businesses via stocks have completely overwhelmed the two other choices and have handily beaten inflation. However, what is different about this graph than most graphs we are used to viewing? What is this graph hiding? In this graph and many graphs in the world of investing, we use a logarithmic scale. In the opinion of Your Humble Author, all graphs using a logarithmic scale should have warning labels attached to them since most individuals don’t completely understand how they work. Each unit on the left is 10 times bigger than the previous unit. Logarithmic graphs are used when the numbers grow exponentially. The graph is hiding the enormous difference between stocks on the one hand and bonds, Treasury bills, and inflation on the other. It is also minimizing the large downturns that stocks experience from time to time. Here is an arithmetic version of the same graph:
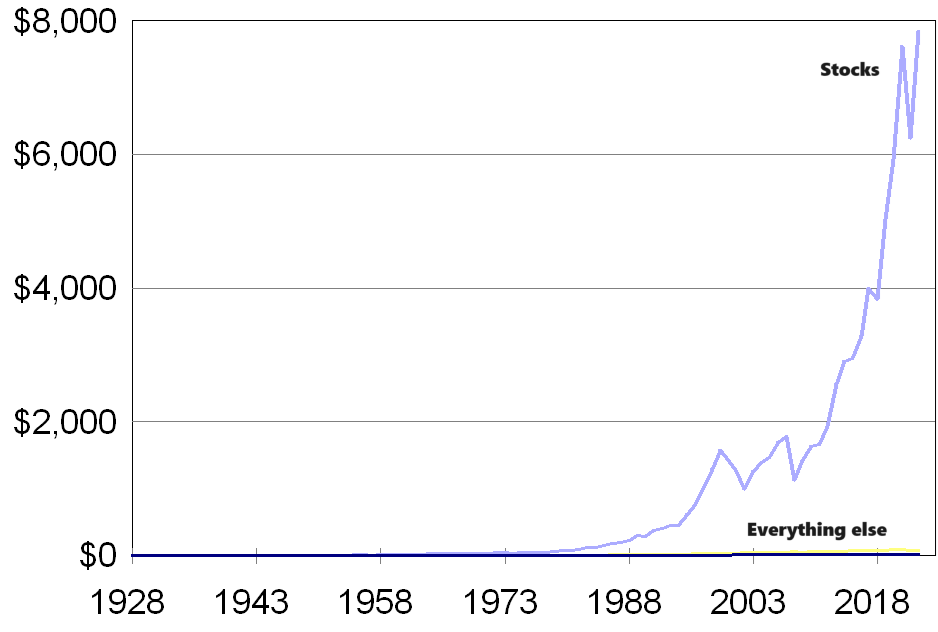
Do you see why we initially used a logarithmic scale? Because of the enormous differences in results, the bonds, Treasury bill, and inflation don’t even begin to show any rise in value in the arithmetic graph. Around 1988, the arithmetic graph also begins to show us the exponential curve that stocks exhibit. It also highlights that what we thought were little rises and falls in the price of stocks are actually very dramatic. Stocks are volatile!
What happens if we go back to the dawn of the Industrial Revolution?
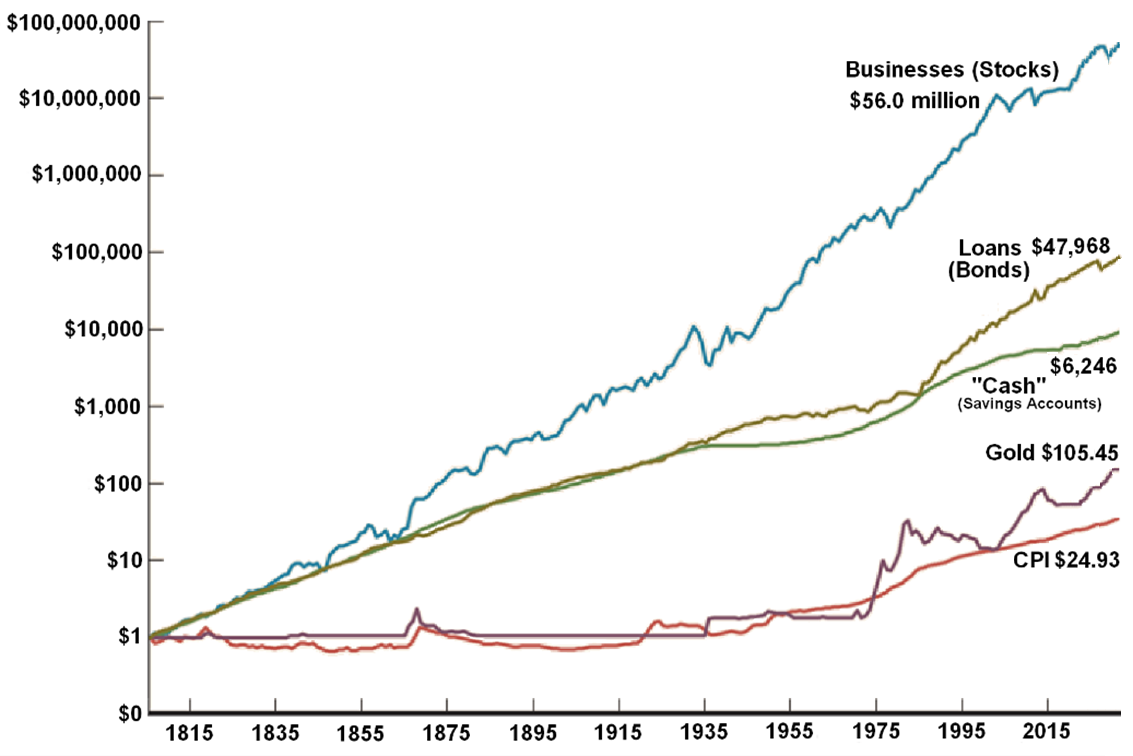
The numbers become staggering and we are left with a few takeaways. Bonds and "cash" investments have done admirably; they have beaten inflation. Gold? Not so much. However, stocks are the hands-down best choice, right? Well, yes, but again, let's not be too hasty. We need to look at the other side of investing, risk, as well as the return. We will examine in detail the risks involved with stock investing soon.
It is no accident that stocks and bonds have produced better returns than short-term investments. If that were not the case, why would investors assume the higher risks of stocks and bonds? The answer is they would not. If guaranteed (or pretty darned close to being guaranteed) short-term investments returned the same as stocks or bonds, investors would prefer those guaranteed short-term investments. They would choose an investment for which there is no chance of losing money and they would be happy to accept the risk-free rate of return on their money. In theory, there is no investment with absolute zero risk. However, short-term United States Treasury bills come as close to absolute zero risk as you can get in this world. Therefore, when investors want to know what the current risk-free rate of return is, they often look at the interest rate that three-month United States Treasury Bills are currently paying. (We will cover Treasury Bills in more detail in our next section dedicated to short-term investments.)
To make prudent investment decisions, we investors need to know what the risk premium is for our potential investors. The risk premium is the reward for bearing risk. It is the extra return on a risky asset over the return that we receive from a risk-free rate of return. As we would expect, the risk premium for stocks is the highest at over 8%. The risk premium for large company bonds is a bit less than 4% and less than 2% for government bonds. Here are the risk premiums for large company stocks, large company bonds, government bonds, and Treasury bills (guaranteed short-term "cash" investments).
| Investment | Average Return | Risk Premium |
|---|---|---|
| Large Company Stocks | 11.66% | 8.30% |
| Large Company Bonds | 6.93% | 3.57% |
| Government Bonds | 4.86% | 1.50% |
| Treasury Bills ("Cash") | 3.36% | 0.00% |
Source: NYU Stern School of Business, Federal Reserve Bank of Minneapolis
These risk premiums may not seem like much but over time, the effects of the higher returns are enormous as we saw in the graphics above and in the presentation. Investment returns are very easy to measure. How much did you start with? How much did you end with? How long did it take you to earn this amount? From this information, we can calculate your return. But what about the risks involved. How do we measure risk?
Variance and Standard Deviation ‒ Two Imperfect Measures of Risk
Investment risk, on the other hand, is much more difficult to measure. The reality is that risk is impossible to measure and predict. There is no measurement that accurately reflects the amount of risk that investors must accept when choosing an investment. That does not stop us from trying, though. Each year, the investment community measures the average annual return and the amount of variance from the average return. Using statistics, the resulting measures of risk are called variance and standard deviation. By far, the most popular measure of risk is standard deviation. Standard deviation is the measure we will use for our class.
I already know what you are thinking. “Aye, this is math! I need to drop this class!” Relax. Please don’t drop the class. We don’t do any variance or standard deviation calculations. We leave those calculations for your statistics class. We just do a quick library or Internet search and the investment community readily and happily gives us the results. Please. Don’t drop the class. Keep reading.
It is important to understand what the variance and its more popular and important companion, standard deviation, can tell us about a potential investment. In general, the higher the variance and standard deviation, the riskier the investment. The higher the variance and standard deviation, the more the investment return will deviate from the average annual return of that investment. In other words, we said that stocks can give us an average annual return of 8%, 9% or even 10% over the long term but we also know that in any one year, the probability is very high that we won’t get 8% or 9% or 10%. We might get +17% in one year, -9% the next year, +22% after that, and then -4%. With stocks, the variances and deviations from the annual returns are extreme. A high standard deviation means the volatility is high. The investment is risky.
Please take a close look at the following frequency distribution graph:
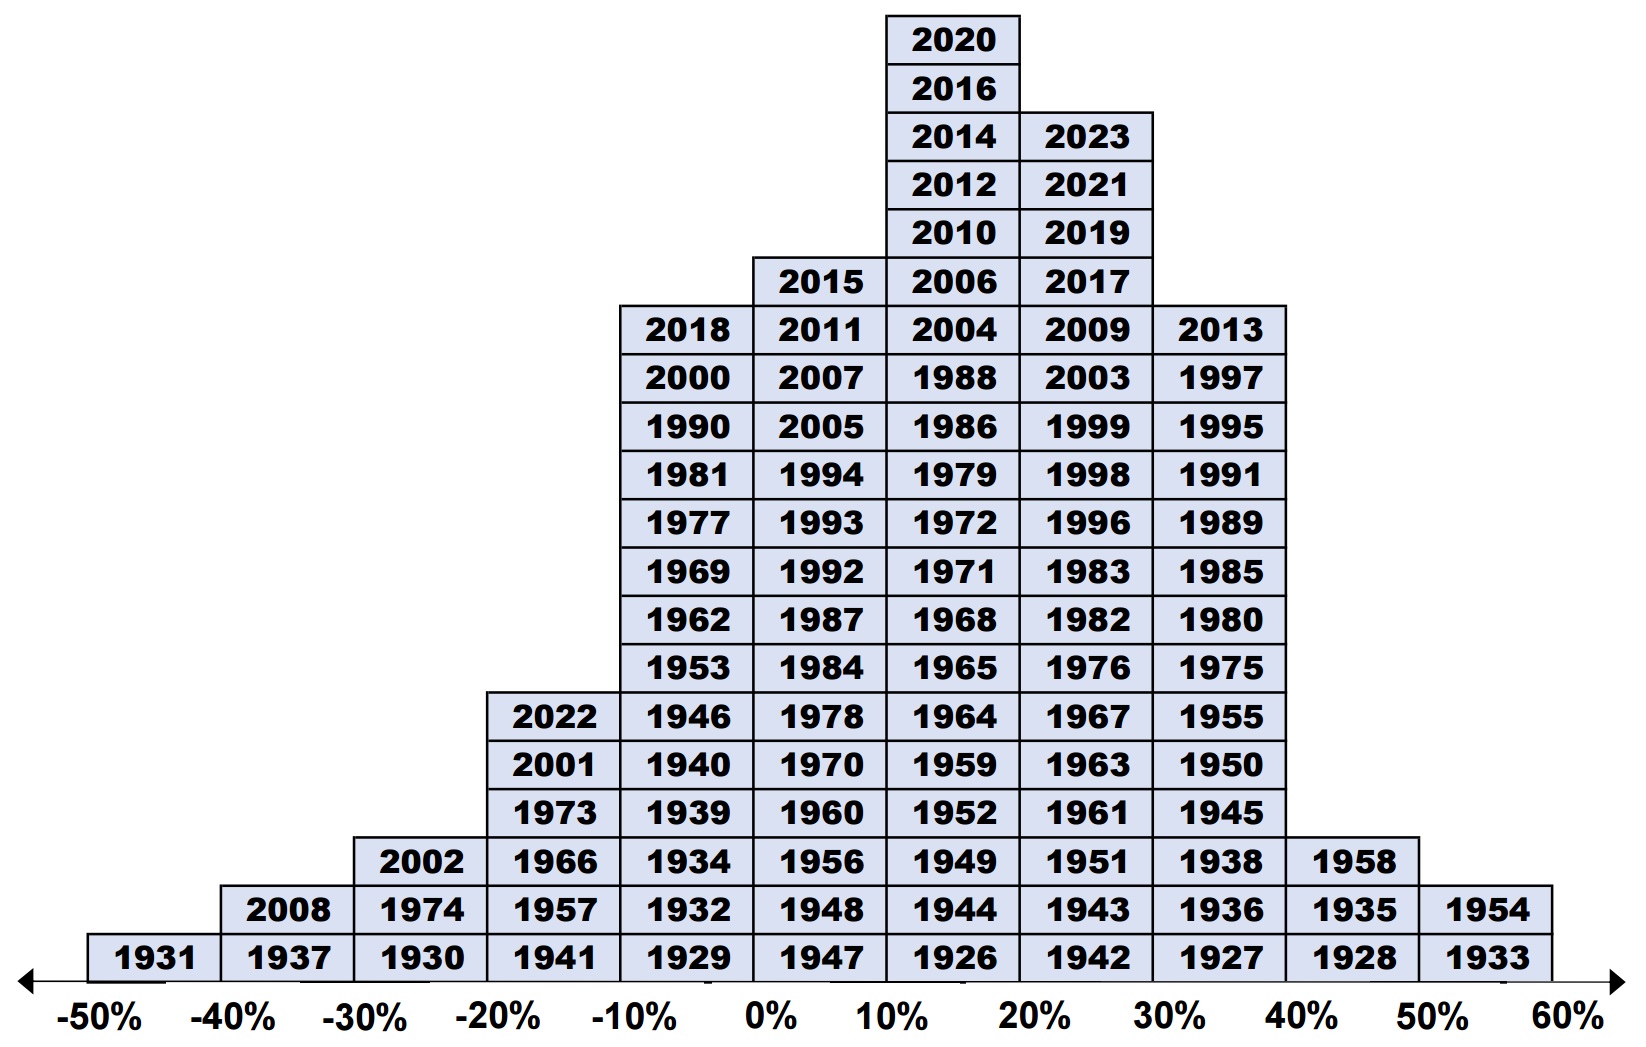
Source: NYU Stern School of Business
How do we interpret this graph? This graph shows us the annual returns from the stock market for every year from 1926 until 2023. Each year is placed in the column that corresponds to the return for that year. For example, in 2020, the return from the stock market was between 10% and 20%. In 2015, the return was between 0% and 10%. In 2018, the return was between -10% and 0%.
From the graph, we see that stocks are similar to Henry Longfellow’s little girl with the little curl right in the middle of her forehead. When she was good, she was very, very good, but when she was bad, she was horrid. “Minus 20% in 2001 and 2022, minus 30% in 2002, minus 40% in 2008!? No way! Not for me! I ain’t gettin’ involved in investing in stocks,” is how some people react. Relax. Calm down. We are going to learn how to use this volatility to our advantage. We can make volatility our friend, not our enemy.
Also, does the distribution graph above resemble anything that you are familiar with? Why yes, you may remember it as the normal curve, also known as the normal distribution or the bell curve. Here it is in all its mathematical glory:
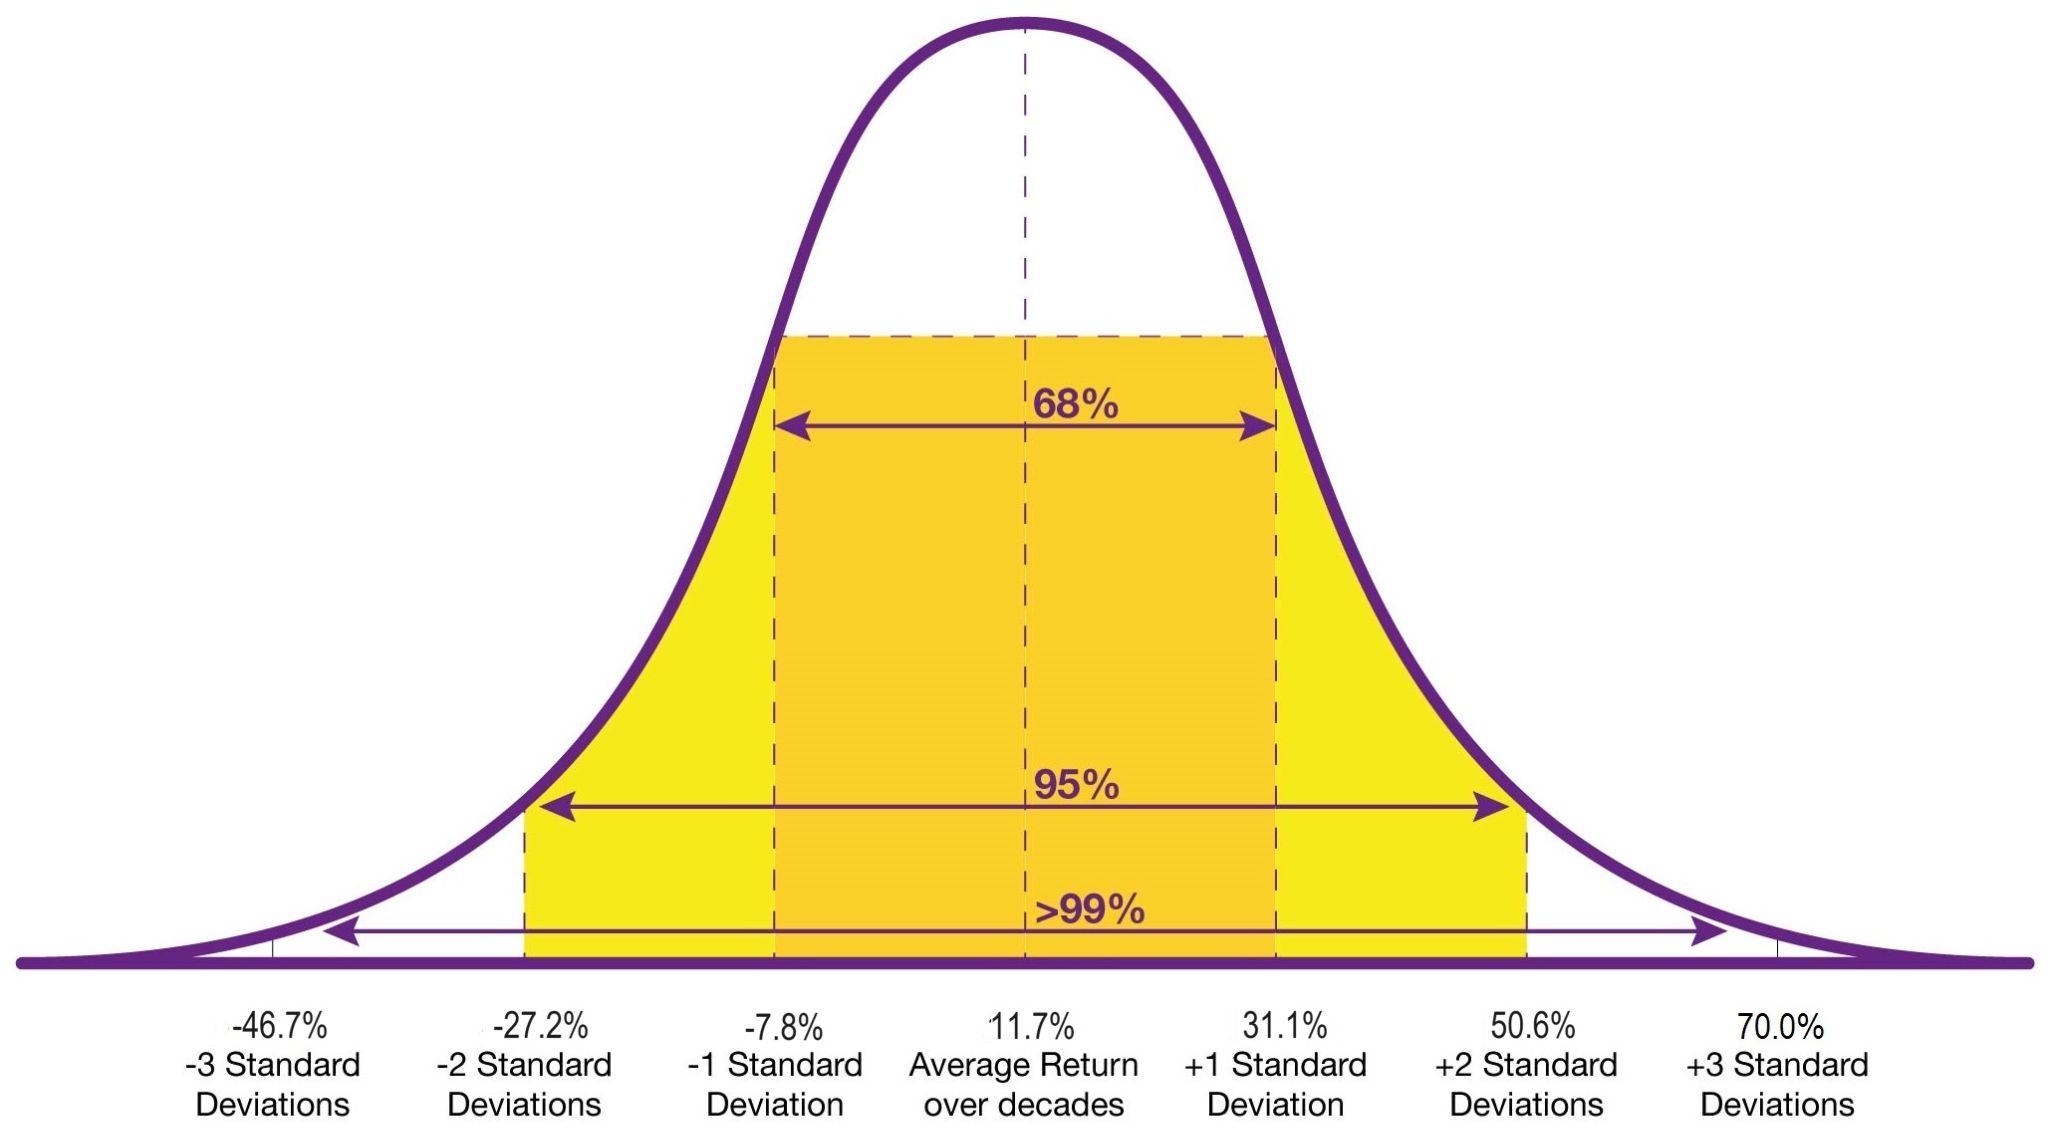
Source: NYU Stern School of Business ; Graphics courtesy of Ferran Capo: StudioCapo
If you are allergic to all things mathematical, please feel free to ignore the above graphic and just read on. What this graph is trying to show us is that the returns from the stock market tend to clump around the average return for the past century. What the graph is also telling us is that the probability that we will actually get that market average is quite low. We can’t know what the return will be next year but history tells us there is about a two-thirds chance that the return will be between ‑8.0% and 31.0%. There is a 95% probability that the return will be between ‑27.5% and 50.5%. And there is a better than 99% chance that the return will be between ‑47.0% and 70.0%.
Here is another view of risk versus return:
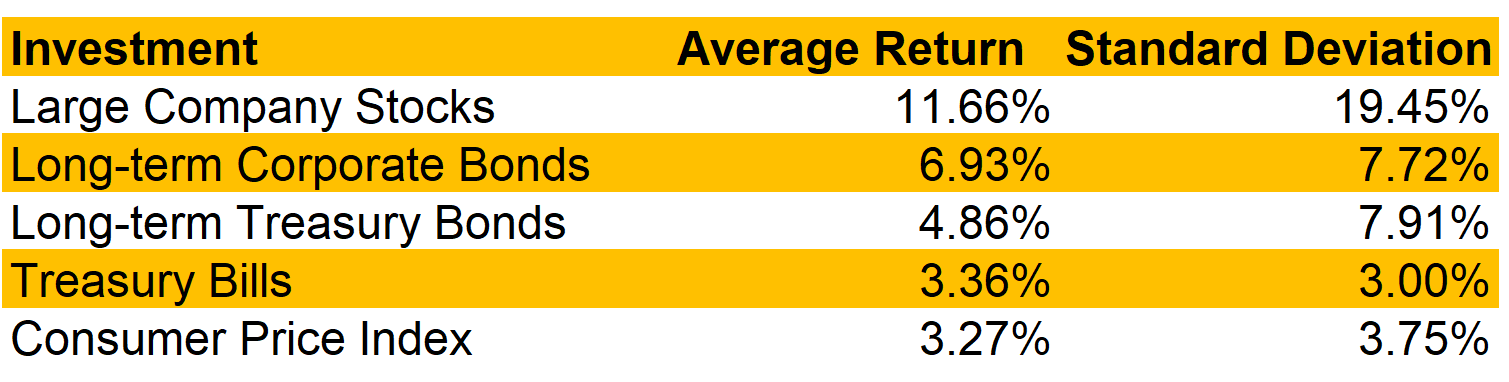
Source: NYU Stern School of Business, Federal Reserve Bank of Minneapolis
If we start with Treasury Bills, the least risky investment, and work our way up to stocks, we see the average annual return rise but we also see the standard deviation rise. It is a bit interesting that the corporate bonds gave us more return while actually having a bit less volatility.
“So, does you’se got’s it yet? You’se wants high returns? You’se gonna’ gets high risk! You’se gonna’ lose some money, maybe a lot o’ money! And if’n anybodies tells you’se differently, de’re lying!”
The lessons from history are that if we want high average annual returns, we are going to have to accept high risk and high volatility. There are going to be times when we lose money, sometimes a lot of money. There will be market downturns, corrections, crashes, etc. It is inevitable. As famed investor Peter Lynch says in his landmark book, One Up on Wall Street, “A stock market decline is as routine as a January blizzard in Colorado. If you’re prepared, it can’t hurt you. A decline is a great opportunity to pick up the bargains left behind by investors who are fleeing the storm in panic.” The good news is that history also tells us that the global economy and the stock markets around the world have always come back from those snowstorms.
Please note that there are charlatans and grifters and con artists aplenty in the shadows of the investment industry. They will brazenly ‒ and illegally, by the way ‒ tell you that they can guarantee, for example, a 12% risk-free average annual rate of return. They are lying, pure and simple. There is no such thing as a 12%, risk-free rate of return. It’s a blue unicorn, a flying panda; it simply does not exist. Some crooks might even make claims of 300% or 3,000%. Check the class website for some examples. Or better yet, just type “100% return in 3 days using options” into any Internet search engine and see how many sharks want to separate you from your money.
Investing versus Speculating/Trading ‒ Revisited
“But isn’t someone doing it? Aren’t there people who make tremendous rates of returns?” you may rightly ask. The answer is yes. There are individuals who make tremendous rates of return. But those people are not prudent, long-term investors like us. They are speculators, also known as traders. Being a speculator/trader can be very profitable but it is also very stressful and perilous. Furthermore, you are up against the best in the world. Here is a quote from one of the famed speculators of the early 20th century, Jesse Livermore.
“The speculator is not an investor. His object is not to secure a steady return on his money at a good rate of interest, but to profit by either a rise or a fall in the price of whatever he may be speculating in.” – Jesse Livermore
So do you want to be an investor or a speculator/trader? As we mentioned at the beginning, we can help you learn how to become a patient, prudent, successful long-term investor. We cannot help you learn how to become a successful short-term speculator. Sorry. We can’t do it ourselves; how could we possibly teach anyone else to do it? If we have not yet convinced you to renounce any dreams you may have had of making riches quickly by day trading, surrounded by two computers and four monitors while simultaneously on the phone with two different companies, please take some time to listen to the story of John Gutfreund and John Meriweather from the book Liar’s Poker by the accomplished investment author Michael Lewis. You never, ever want to play Liar’s Poker with John Meriweather, let alone try to out trade him.
It’s really very simple. When the task is immensely difficult and the competition is ferocious, as it is in speculating/trading or in sports or the arts, for that matter, it is only natural that a select few will rise to the top. Can you throw or hit a fastball at 98 miles per hour? If you successfully can hit a fastball at 98 miles per hour three times out of ten tries, you can snag yourself a contract for tens of millions of dollars each year. Can you dunk a basketball? Can you sing the lead part in a five-act opera? Can you write or direct or act in a movie with a $100+ million dollar budget? Can you hit a tiny white ball 350 yards down the fairway in just three shots? The average person can’t accomplish any of these. But that does not mean there aren’t people who can. There are. Are you going to compete with them in their venue? I think not.
One of the best observations ever about investing versus speculating/trading was made by John Bogle, the founder of the Vanguard Group mutual fund company. He was interviewed by Steve Forbes, the Editor-in-Chief of Forbes magazine, back in 2009. The interview used to be available on the magazine’s website but was taken down long ago. I contacted them and begged them to make it available again. I never got a response. So we put the passage here for you. Read carefully, Dear Students.
“Well, the first thing you have to think about is, and this is an issue that I’ve almost never heard discussed, Steve, and that’s the first question you have to ask yourself is: Am I an investor, or am I a speculator? An investor is a person who owns business and holds it forever and enjoys the returns that U.S. businesses, and to some extent global businesses, have earned since the beginning of time. They have capital, they earn a return on their capital and that capital grows over time. It’s not complicated. That’s the business of investing.
Speculation is betting on price. I think I can buy this for $10 and sell it for $12 or $14 or $20 or $100. Speculation has no place in the portfolio or the kit of the typical investor. Speculation leads you the wrong way. It allows you to put your emotion first, whereas investment gets emotions out of the picture. You own these businesses, they’re still sound, if the market doesn’t think they’re worth as much as they were, well, pity, the market doesn’t know everything.” ‒ John “Jack” Bogle, Founder and former CEO of the Vanguard Group
When the video was still available, we would show this segment in the face-to-face class and I would call out, “We do, Mr. Bogle! We do! We emphasize the distinction between investors and speculators/traders in our Introduction to Investments class!” The entire interview is over 30 minutes and highly informative and enterprising. Let’s hope Forbes resurrects it.
Oh, by the way, Jesse Livermore, the famed speculator/trader, wound up heavily in debt and committed suicide. Please do not endeavor to become a speculator/trader. But if you do, we wish you the best of luck. You’ll need it.
Observations about the End of the World
Some readers will ask, “Well, what if stock prices all go to zero? What if the economy and the stock market don’t come back?” This is a very probing question. It speaks to our justifiable fears about investing, especially in stocks. Let’s rephrase the question: What if the world ends? The truth is someday the world is going to end. There are numerous scenarios. For example, we know that in about 1 or 2 billion years, the sun will expand and swallow Mercury and Venus and maybe even the Earth. However, it won’t need to swallow the Earth for our world to end. By the time it gets to Venus, temperatures on the Earth will be hot enough to melt tin and lead and copper. Thankfully, we have a long time to prepare for this scenario. But what about all the other disasters looming on our horizon? Global warming, climate change, income inequality, nuclear war, rising sea levels, pandemics, tsunamis, earthquakes, fires, floods, disco returning!
As we said at the beginning, there will always be proclamations of doom and gloom, especially from charlatans ready to sell you their sure-fire method for surviving the end times. Don’t listen to them! If the world does end, if our technologically based civilization cracks and falls and dissolves into a pool of tears, if there is no food at the grocery store, no gas at the gas station, no clothes at the mall, the cell phones aren’t working, the utility companies are not pumping out electricity or natural gas, the trash isn’t being picked up, the sewers are clogged, the hospitals, schools, fire departments, police stations, banks are all boarded up, etc., your stock portfolio will be the last thought on your mind. You will be digging for beetle grubs and boiling bark for dinner. Let’s meet at the beach. You bring the marshmallows. I’ll bring the vodka. We can get drunk and watch the world burn.
Take heart, Dear Students! This scenario is not going to happen! Failure is not an option! As I have already told you, Your Humble Author is firmly convinced that the next 20, 30, 50 years are going to be the most prosperous years in the history of our civilization. There is no doubt that we have tremendous hurdles to overcome, some might say they are insurmountable. But never underestimate the innovative power of our species. Just look at what we did with Covid in 2020. A vaccine usually takes at least 4 years and often up to 10 years to develop. Multiple groups around the world created safe and effective vaccines in a matter of months! We will overcome climate change. We will phase out fossil fuels. We will have driverless cars and some will be able to fly. We will cure cancer. We will colonize Mars. We will have universal language translators. We will have domestic robots. We will see the day when close to 100% of the citizens of our world are connected to the Internet. We will ensure that never again does disco become the dominant cultural icon of our nation! Economically, I am very confident of this and more. (Politically, I am very scared. Democracy is being attacked in many countries around the world, including the United States. But that discussion is for another class in another department. Thank goodness this isn’t Kindergarten where all the disciplines are taught in the same classroom. Go take up our political woes with your Political Science professor.)
So What Is a Realistic Rate of Return for Me?
After you have taken this course, you will have a strong foundation of the most popular types of securities investments: stocks, bonds, “cash,” and mutual funds. You will also know what levels of returns and what levels of risks you should reasonably expect to receive. And if you are a patient, long-term investor, I believe it is realistic to expect 8% to 10%. I am certainly working on it myself. So far, so good. Of course, as we will reiterate time and time again, there are no guarantees.
You are now most likely thinking, “But is 8% or 9% or 10% good enough for me?” It turns out the answer to this question is a resounding, “Yes!” There are some caveats we need to add, though. If you start early, if you invest patiently and consistently, if you do not get cocky or greedy, if you do not chase after every “Next Big Thing” that comes along, and most importantly, you do not panic when the market swoons, as it inevitably will do from time to time, then ‒ unless the world ends ‒ we believe it is entirely reasonable and realistic to expect 8% or 9% or 10% over the long term. As mentioned, some investors have done better. The trick is to take advantage of the time value of money, also known as the compound annual return or the compound annual growth rate.
The time value of money is the amount to which a sum you invest now will increase based on a specified rate of return and time period. Calculating amounts into the future is called compounding. The result is the future value of money. Future value can be computed for a single amount, also known as a lump sum, a principal, or a single payment. Future value can also be determined for a series of deposits, also known as a stream of investments or an annuity. (In our class, we usually don’t use the term annuity because an annuity is also an insurance product. We discuss annuity insurance products at the end of the class. We do not have kind words for them.)
There is a future value handout available on the class website. We leave the calculations to you as an optional exercise. Quite possibly you have already taken our Financial Planning and Money Management, now called Principles of Money Management, class at Southwestern. We spend a good deal of time learning future value calculations in Principles of Money Management. At the very least, please review the answer key and listen to the commentary to see the kinds of wealth that one can reasonably build over the working careers. We will also see some great examples in our next chapter on mutual funds. The news is good!
The future value calculations allow us to move from the present into the future. Later on, when we learn how to assign valuations to stocks and bonds, we will use the inverse of future value, present value, to move from the future back to the present. (“Huh? What?” Relax. Study what is in this chapter. We have a long road ahead of us.)
So are you ready to start your journey to become a prudent, long-term investor? Are you excited? I know I am! Well, before we get to the good stuff, we are going to take a small detour. We will now revisit short-term investments, vehicles that we use if we need the money in three, six, or nine months or even a year or two, depending upon the importance of the uses for the short-term funds. Short-term investments aren’t very exciting. They aren’t supposed to be. We don’t want excitement with money that we need in the short term. We want certainty.
“Oh, yeah?! This guy says I can earn 25% per month! Whaddya’ say about that, huh?”
Before we move on to short-term investments, we want to warn you again that there are plenty of con artists out there ready to take your money. Dear Students, if you are involved in the investment world for any period of time, eventually you are going to come across an advertisement, flyer, electronic mail or United States mail solicitation that promises eye-popping returns of 25%, 100%, 3,000% per year or even 300% or more per day. Investment scams have been with us forever. They will always be with us. Sadly, many uninformed individuals fall for their snake oil. Here is an example of one such outrageous claim:

This advertisement was found on the Yahoo! Finance web site which is generally considered a reliable and reputable media outlook. Prepare to see far more outlandish and preposterous claims on less reputable locations. This guy is claiming that he was able to generate returns of 25% per month. That is over 1,300% per year. This is total rubbish!
Oh, by the way, these advertisements are against the law. “What?! Huh?! Don’t we have freedom of speech in the United States?” you ask. Well, yes, you are correct. We are free to express our viewpoints, opinion, and our understanding of the facts in the marketplace of ideas. But when it comes to investment advice and products, that freedom of speech is severely limited. So how do people get away with this? The Securities and Exchange Commission has a skeletal crew of regulators that can not begin to tackle this problem. They only go after the worst scoundrels. The same kind of illegal behaviors also go on in the world of weight loss supplements. Some even sneak controlled, prescription-only drugs such as Prozac and Viagra into their products and some even put dangerous, banned chemical substances. Be careful out there, Dear Students!