
3: The Federal Tax System
- Page ID
- 12748

At the end of this chapter, you should be able to: (1) describe the major components of the federal tax system; (2) know how the different forms of business organizations are taxed; (3) recognize the difference between marginal and average tax rates; and (4) understand how depreciation, capital gains, and depreciation recapture affect the amount of taxes a firm pays. To achieve your learning goals, you should complete the following objectives:
- Learn to distinguish between the firm’s gross income, adjusted gross income, and personal deductions.
- Learn how to calculate the firm’s tax liability by finding its taxable income
- Learn how to find the firm’s average tax rate and marginal tax rates.
- Learn how to find a firm’s tax liabilities by using tables of Federal Income Tax Rates.
- Learn how depreciation can reduce the firm’s tax liabilities.
- Learn how to find the amount of taxes paid on interest and dividend income.
- Learn how to distinguish between capital gains and losses and depreciation recapture.
- Learn how taxes are calculated on depreciation recapture and capital gains and losses.
- Learn about the different ways depreciation can be calculated and the advantages and disadvantages of each depreciation method.
Introduction
Chapter 2 proposed that one financial management objective is to organize the firm so that its value is maximized. Of course, “the firm” could mean any business organization ranging from a large corporate firm to a small business or even an individual household. Later, we will see that the firm’s value is determined by its after-tax cash flow, which can differ significantly from the firm’s profits measured by its accounting income. As a result, we need to understand the differences between a firm’s cash flow and its accounting income—this discussion will come later. Fortunately, for the most part, a detailed knowledge of specific accounting differences for the different types of business organizations isn’t essential for our purposes. So we begin by discussing some of the major components of the federal tax system that have a bearing on a firm’s after-tax cash flow.
Due to the influence of taxes on cash flow, it is important to have an understanding of how the tax system works. This chapter intends to present a few of the basic concepts related to taxes that are important from a financial management perspective. Our focus is on the federal tax code, because of its importance in determining after-tax profit and after-tax cash flow. Nevertheless, there are a number of additional taxes (e.g. state and local taxes) that can have a significant impact on a firm’s earnings and cash flow. It is important to consider the impacts of all taxes when making financial decisions. The federal tax laws are written by Congress. The Internal Revenue Service (IRS) is the agency responsible for administering the code and collecting federal income taxes. The IRS issues regulations which are its interpretation of the tax laws. The regulations are effectively the tax laws faced by businesses and individuals. One final word of caution: always remember that tax laws can and do change, and these changes are not always announced in ways that inform small businesses. Nevertheless, ignorance is not an excuse for incorrectly filing one’s taxes.
Individual Taxes
Individual (ordinary) tax liabilities are determined by subtracting certain allowable deductions from one’s total income to obtain taxable income. Taxable income is then used as the basis from which the tax liability is calculated. The general procedure is:
- Gross income – Adjustments to income = Adjusted gross income.
- Adjusted gross income – Personal exemptions and deductions = Taxable income.
- (Taxable income) x (Average tax rate) = Tax liability.
Gross income consists of all income received during the tax year in the form of money, goods and services, and property. Adjustments to income, including some past losses, may include income that is not taxed, such as interest income generated by nontaxable municipal bonds. Adjusted gross income may be reduced by subtracting personal exemptions and deductions regardless of whether you itemize or not and includes such things as business expenses and deductions for some types of Individual Retirement Account (IRA) contributions. A personal exemption is the allowable reduction in the income based on the number of persons supported by that income. You may claim deductions for yourself, your spouse, and other dependents who meet certain criteria. As of 2018, the personal exemption amount is zero until 2025. In addition, you can reduce your taxable income by either claiming a standard deduction or itemizing allowable expenses.
The standard deduction is an amount allowed for all taxpayers who do not itemize, and represents the government’s estimate of the typical tax-deductible expenses that you are likely to have. As of 2018, the standard deduction is $12,000 for single, $18,000 for head of household, and $24,000 for married filing jointly. These are adjusted annually for inflation. If your tax-deductible expenses are greater than the standard deduction, you can list them separately and deduct the total value of the itemized deductions. Itemized deductions include expenses for such things as medical expenses, certain types of taxes, mortgage interest expense, and charitable contributions. After reducing Adjusted gross income by subtracting Personal exemptions and deductions, we obtain our Taxable income, the amount of income that will be used to calculate your Tax liability.
The Federal income tax in the United States is called a progressive tax, meaning that the percentage tax rate increases as taxable income increases. In contrast, regressive taxes have their tax rate remain constant or decrease as taxable income increases. State sales taxes, property taxes, social security taxes, and in some cases, state income taxes are regressive taxes because as a percentage of one’s income paid as taxes they increase with a decline in one’s income.
Two different tax rate measures include the Average tax rate and the Marginal tax rate defined below:

The average tax rate represents the “average” tax rate that is paid on each dollar of taxable income. The marginal tax rate is the tax rate that is paid on the next dollar of taxable income. In a progressive tax system, the marginal tax rate will always be equal to or greater than the average tax rate.
The federal tax rate schedule for 2018 taxable income is shown in Table 3.1.
Table 3.1. Federal Income Tax Rates in 2018
| Tax Bracket | Married Filing Jointly | Single |
| 10% Bracket | $0 – $19,050 | $0 – $9,525 |
| 12% Bracket | $19,050 – $77,400 | $9,525 – $38,700 |
| 22% Bracket | $77,400 – $165,000 | $38,700 – $82,500 |
| 24% Bracket | $165,000 – $315,000 | $82,500 – $157,500 |
| 32% Bracket | $315,000 – $400,000 | $157,500 – $200,000 |
| 35% Bracket | $400,000 – $600,000 | $200,000 – $500,000 |
| 37% Bracket | Over $600,000 | Over $500,000 |
Because of the progressive nature of the tax, the marginal tax rate increases as your income increases. The first $19,050 of taxable income for married couples filing a joint return are taxed at a rate of 10%, the next $58,350 ($77,400 – $19,050) of taxable income are taxed at a rate of 12%, and so on. Suppose a married couple had $120,000 of taxable income in 2018.
Their Federal tax liability would be calculated on each increment of income as follows: The average tax rate paid equals Total tax liability/taxable income = $18,279/$120,000 = 15.2% and the marginal tax rate paid on the last dollar earned would be 22%.
10% tax on first $19,050 ($19,050 – $0) = 10% x
$19,050 = $1,905.00
12% tax on next $58,350 ($77,400 – $19,050) = 12% x $58,350
=$7,002.00
22% tax on next $42,600 ($120,000 – $77,400) = 25% x $44,700 =
$9,372.00
Total Tax Liability on $120,000 = $18,279.00
It is important to distinguish between the marginal and average tax rate. The average tax rate is useful because it allows us, with a single number, to characterize the proportion of our total income that is taxed. In many cases, however, we are interested in the amount of tax that will be paid on any additional income that is earned, perhaps as a result of profitable investment. In these situations, the marginal tax rate is the appropriate rate to use. For example, suppose your average tax rate is 18.4 percent and you are in the 22 percent tax bracket, and you receive a $1,000 raise. The additional income you earn will be taxed at the marginal tax rate of 22 percent, regardless of the average tax rate, so that your increase in after-tax income is only $1,000(1 – .22) = $780. The marginal tax rate is also significant when considering the impact of tax deductions. Suppose you are in the 22 percent tax bracket and you contribute $2,000 to your favorite charity. This reduces your taxable income by $2,000, saving you $440 in taxes (22% times $2,000) so that your after-tax cost of your contribution is only $2,000(1 – .22) = $1,560.
Total Marginal Tax Rates
As we pointed out earlier, because of the progressive nature of the federal tax code, the effective marginal rate that individuals pay is nearly always greater than the federal marginal tax rate. However, there are more levels of government collecting tax revenues than just the federal government. In addition to the federal tax, most personal income is also subject to state taxes, Social Security taxes, Medicare taxes, and perhaps city taxes. State taxes vary but often run in the 4 – 6 percent range. Social Security (6.2 percent) and Medicare (1.45 percent) taxes are split between employer and employee, and the rate for most employees is 7.65 percent (self-employed pay both the employer and employee half, usually 15.3 percent). In 2018, the social security tax is imposed only on individual income up to $128,400. There is no maximum income limit on the Medicare tax. City taxes can run 3 – 4 percent. Therefore, the effective marginal tax rate for someone in the 24 percent federal tax bracket who pays social security tax will generally be over 37 percent. If the same person were self-employed they would be subject to an additional 7.65 percent, and a marginal tax rate that could exceed 50 percent of taxable income in some cases. It should be noted that one-half of “self-employment tax” is deductible from income subject to federal tax, so the effective marginal tax rate increases by only 7.65(1 – .24) = 5.81 percent for someone in the 24 percent tax bracket. As you can see, it is extremely important to understand what the effective marginal tax rate is when making financial management decisions.
Bracket Creep
Progressive tax systems are subject to an undesirable feature, often termed “bracket creep.” Bracket creep is an inflation-induced increase in taxes that results in a loss in purchasing power in a progressive tax system. The idea is that inflation increases tend to cause roughly equal increases in both nominal income and the prices of goods and services. Inflation induced increases in income push taxpayers into higher marginal tax brackets, which reduces real after tax income. Consider an example of how inflation reduces real after-tax income and therefore purchasing power.
For the couple in our previous example with a taxable income of $120,000, their real after-tax income, their purchasing power in today’s dollars, is equal to their Gross income less any Tax liabilities which in their case is: $120,000 – $18,279 = $101,721. Another way to calculate their purchasing power is to multiply (1 – average tax rate T) times their gross income: (1 – 15.2325%)$120,000 = $101,721.
Inflation is a general increase in price. Suppose that, as a result of inflation, that next year inflation will increase your salary 10%. However, suppose that inflation will also increase the cost of things you buy by 10%. As a result, to purchase the same amount of goods next year that were purchased this year will require a 10% increase in this year’s expenditures. For the couple described in our earlier example, this will require expenditures of $101,721 times 110% = $111,893.10.
Now let’s see what happens to our couple’s after-tax income. A 10% increase in taxable income means they will have $120,000 times 110% = $132,000 in taxable income next year. Recalculating the couple’s tax liabilities on their new income of $130,000:
The average tax rate paid equals Total tax liability/taxable income = $20,919/$132,000 = 15.85% while the marginal tax rate paid on the last dollar earned would be 22%. Subtracting couple’s tax liabilities from their income leaves them $111,051, less than $111,893.10 which is the amount required to maintain the same purchasing power before inflation. In other words, as a result of the combination of inflation and bracket creep with increases on the average tax rate, the couple’s purchasing power is reduced
The IRS recognizes the impacts of bracket creep, and periodically adjusts the tax schedules and/or deductions in an attempt to smooth or eliminate purchasing power losses due to bracket creep.
10% tax on first $19,050 ($19,050 – $0) = 10% x
$19,050 = $1,905.00
12% tax on next $58,350 ($77,400 – $19,050) = 12% x $58,350 =
$7,002.00
22% tax on next $54,600 ($132,000 – $77,400) = 25% x $54,700 =
$12,012.00
Total Tax Liability on $132,000 = $20,919.00
Interest and Dividend Income
Interest and ordinary dividends earned by individuals are generally taxed as ordinary income. One exception is interest income earned on municipal bonds issued by state and local governments (bonds are promissory notes issued by a business or government when it borrows money). Municipal bonds are exempt from federal taxes, which makes them attractive to investors in high marginal tax brackets.
Suppose you are in a 25% marginal tax bracket and are considering investing $1,000 in either a corporate bond that yields 10% per year, (yield means the rate of return the investment provides) or a municipal bond yielding 8% each year. You can calculate your after-tax cash flow from each investment by subtracting the tax liability from the before-tax cash flow from each investment.
The corporate bond provides a $100 cash flow before taxes but only $75 is left after paying taxes. Meanwhile, the municipal bond is exempt from federal taxes and provides an $80 before and after-tax cash flow. This example illustrates the importance of considering after-tax cash flow as opposed to before-tax cash flow when considering investment opportunities.
| Asset | Before-tax cash flow return | – Taxes | = After-tax cash flow |
| Corporate bond | $1,000(.10) = $100 | $100(25%) | $75.00 |
| Municipal bond | $1,000(.08) = $80 | $0 | $80.00 |
We can also measure an investment’s return using percentages. Percentage measures standardize return measures so investments of different sizes can be compared. We calculate the percentage return during a period as the cash flow received during the period divided by the total amount invested. For example, the percentage rate of return on the corporate bond was $75/$1000=7.5%, while the percentage rate of return on the municipal bond was $80/$1000=8.0%.
When the returns on the bonds are expressed as rates of return, it is clear that the municipal bond is the preferred investment.
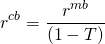
Suppose you wanted to find the before-tax rate of return on a corporate bond (rcb), a pre-tax equivalent rate of return that would provide the same after-tax rate of return as a tax free municipal bond (rmb ). To find rcb , equate the after-tax rates of returns on the corporate and municipal bonds, rcb (1 – T ) = rmb , and solve for the following:
(3.1)
In our example municipal bond rate is 8% so that for an investor in the 25% marginal tax bracket, the pre-tax equivalent rate of return is:
(3.2)
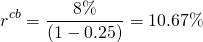
In other words, a corporate bond yielding 10.67% would produce the same after-tax return as the municipal bond yielding 8% for an investor in the 25% tax bracket.
Interest Paid by Individuals
Interest paid by individuals is generally not tax deductible for personal expenditures, such as interest on a loan for a car used solely for personal travel. One primary, and important, exception to this is that interest on a home mortgage is usually deductible from taxable income if filing using itemized deductions. There is also a limited deduction available for student loan interest payments.
Capital Gains and Losses
From an accounting standpoint, we define book value (or basis) as acquisition cost less accumulated depreciation, which is determined by tax codes. (Book value may also be altered by improvements to depreciable assets.) For a variety of reasons, an asset’s market value is usually different from its book value. When an asset is liquidated at a market value greater than its book value we say it has appreciated in value. If the appreciation is equal to or less than its original acquisition cost, we refer to the appreciation value as depreciation recapture. Appreciated value in excess of its acquisition value is referred to as capital gains.
Likewise, when an asset’s liquidation value is less than its book value, we say that the asset has experienced capital losses and define: capital losses = book value – market value (if book value > market value). The tax rate for individuals on “long-term capital gains”, which are gains on assets that have been held for over one year before being sold, depends on the ordinary income tax bracket. For taxpayers in the 10% or 15% bracket, the rate is 0%. For taxpayers in the 22%, 24%, 32%, or 35% bracket, it is 15%. For those in the 37% bracket, the rate is 20%. Other rates also exist under certain situations. The tax rate paid on depreciation recapture is the taxpayer’s income tax rate since depreciation was used to shield income from income tax payments.
Suppose you are in the 24% tax bracket. You have just sold some land (a non-depreciable asset) for $50,000. The land was purchased 5 years ago for $30,000. Since you sold the land for more than its book value (the purchase price in this case) you will realize a capital gain of $50,000 – $30,000 = $20,000. Your tax liability on the sale will then be the capital gain times the capital gains tax rate or in this case $20,000(15%) = $3,000.
Capital losses must first be used to offset any capital gains realized that year; however, if you have any capital losses remaining after offsetting capital gains, you may offset ordinary income. If you still have capital losses remaining, you may carry the losses forward to offset future capital gains and income. This can be a powerful tool. Suppose the land in the above example brought a selling price of $20,000. Now you have realized a capital loss of $30,000 – $20,000 = $10,000. If you have not realized capital gains for the year, you can use the loss to offset your ordinary income, which in this example is being taxed at 24%. Your tax savings from the capital loss would be $10,000(24%) = $2,400. In other words, you can use the loss to reduce the level of taxable income by $10,000, which saves you $2,400 in taxes you would have been required to pay without the loss. If you had realized at least $10,000 in capital gains on assets held over 12 months during the year, your capital loss would have only saved you $10,000(.15%) = $1,500. It is clear that the current capital laws require some careful planning to capture the full benefits. (Note: some capital losses are limited to $3,000 per year to be taken against regular income. Anything left over can be carried forward to future years.)
Tax Credits
Tax deductions are subtracted from Adjusted Gross income and reduce the level of Taxable income. This results in a tax savings that is equal to the marginal tax rate for each dollar of allowable deduction. Tax credits, on the other hand, are direct deductions from one’s Tax liability. Tax credits, therefore, result in a tax savings of one dollar for each dollar of tax credit. For example, consider the tax savings of a $1,000 deduction versus a $1,000 tax credit for an individual facing a 24% marginal percent tax rate:
tax deduction: tax savings = $1,000(24%) = $240;
and
tax credit: tax savings = $1,000(100%) = $1,000.
Clearly, you would prefer one dollar of tax credits more than one dollar of tax-deductible expense. Tax credits come and go sporadically in the tax laws. They have been used in the past to stimulate investment in some types of assets. There are still some tax credits available today. For example, certain college tuition and child care expenses may be eligible for tax credits. Also, for each dependent child under age 17, up to $2,000 credit may be available.
Business Taxation
Remember that Subchapter S corporations, partnerships, and sole proprietorships are taxed according to the individual tax rate schedule the owner faces. Many Subchapter S corporations, partnerships, and sole proprietorships may get a 20% reduction of their Qualified Business Income, which might be their net business income. C corporations, on the other hand, are taxed according to corporate income tax rates. The corporate tax ate schedule for 2018 is now 21%.
Not all the income generated by a business’s operations is subject to taxes. Most expenses incurred in order to generate the business income are deductible. In addition, there are a number of other adjustments to business income which deserve mention. Also be aware that many, but not all, states impose an additional tax on corporate income.
Depreciation
When a business purchases assets that can be used in the business for more than one year (often called capital expenditures), the business is generally not allowed to deduct the entire cost of the asset in the year in which it was purchased. Depreciation is an accounting expense that allocates the purchase cost of a depreciable asset over its projected economic life. This deduction acts as an expense for both accounting and tax purposes; so increases in depreciation expense result in decreased profit measures for a business. Nevertheless, depreciation expense is a noncash expense; that is, you aren’t sending a check to anyone for the amount of the depreciation expense. This allows depreciation expense to act as a tax shield, which lowers taxable income, resulting in lower tax obligations and consequently higher after-tax cash flow. Accordingly, higher depreciation expenses result in lower profits but higher after-tax cash flow.
For tax purposes, there are rules that determine how you depreciate an asset. You can only depreciate an asset that has been placed in service, which means that it is available for use during the accounting period. There are also conventions that determine the point in time during the accounting period you must assume the asset was placed into service. Most depreciable assets are assumed to be placed into service at the mid-point of the year, regardless of the actual date they are placed in service. This is known as the half-year convention. There are also rules about the recovery period over which an asset can be depreciated. Table 3.2. shows the allowable recovery periods for different classes of farm property.
Table 3.2. Farm Property Recovery Periods[1]
| Assets |
Recovery Period in Years |
|
| Gen. Dep. System | Alter. Dep. System | |
| Agricultural structures (single purpose) | 10 | 15 |
| Automobiles | 5 | 5 |
| Calculators and copiers | 5 | 6 |
| Cattle (dairy or breeding) | 5 | 7 |
| Communication equipment | 7 | 10 |
| Computers and peripheral equipment | 5 | 5 |
| Cotton ginning assets | ||
| Drainage facilities | 15 | 20 |
| Farm buildings | 20 | 25 |
| Farm machinery and equipment | 7 | 10 |
| Fences (agricultural) | 7 | 10 |
| Goats and sheep (breeding) | 5 | 5 |
| Grain bin | 7 | 10 |
| Hogs (breeding) | 3 | 3 |
| Horses (age when placed in service) | ||
|
Breeding and working (12 yrs or less) |
7 | 10 |
|
Breeding and working (more than 12 yrs) |
3 | 10 |
|
Racing horses (more than 2 yrs) |
3 | 12 |
| Horticultural structures (single purpose) | 10 | 15 |
| Logging machinery and equipment | 5 | 6 |
| Nonresidential real property | 39 | 40 |
| Office furniture, fixtures and equipment (not calculators, copiers, or typewriters) | 7 | 10 |
| Paved lots | 15 | 20 |
| Residential rental property | 27.5 | 40 |
| Tractor units (over-the-road) | 3 | 4 |
| Trees or vines bearing fruit or nuts | 10 | 20 |
| Truck (heavy duty, unloaded weight 13,000 lbs. or more) | 5 | 6 |
| Truck (weight less than 13,000 lbs.) | 5 | 5 |
| Water wells | 15 | 20 |
There are two depreciation methods that can be used for tax reporting purposes: straight line (SL) and modified accelerated cost recovery system (MACRS). Straight line allocates the depreciation expense uniformly each period. The amount of depreciation is found by multiplying the straight line recovery rate for each year times the asset’s unadjusted basis (original cost). The SL recovery rate is simply the inverse of the number of years in the asset’s recovery period adjusted by the required half-year placed in service convention. The straight recovery rates for 3-year, 5-year, and 7-year assets are shown in Table 3.3.
Table 3.3. Straight Line Recovery Rates for 3, 5, 7 Year Assets
| Year | 3-Year | 5-Year | 7-Year |
| 1 | 16.67% | 10% | 7.14% |
| 2 | 33.33% | 20% | 14.29% |
| 3 | 33.33% | 20% | 14.29% |
| 4 | 16.67% | 20% | 14.28% |
| 5 | 20% | 14.29% | |
| 6 | 10% | 14.28% | |
| 7 | 14.29% | ||
| 8 | 7.14% |
As you might guess from its name, MACRS produces larger depreciation expenses in early years than the SL method of depreciation and lower depreciation expenses in the later years than the SL method of depreciation. The federal government specifies the allowable rates of MACRS depreciation. These rates are determined by using a combination of the declining balance (either 150% or 200%) and straight-line depreciation methods. Prior to 2018, farmers were not permitted to use 200% declining balance. The MACRS depreciation expense for each year is calculated by multiplying the unadjusted basis (acquisition cost) of the asset by the appropriate recovery rate for that year. The MACRS (200% method) recovery rates for the 3-year, 5-year, and 7-year asset classes are shown in Table 3.4.
Table 3.4. MACRS Recovery Rates for 3, 5, and 7-Year Assets
| Year | 3-Year | 5-Year | 7-Year |
| 1 | 33.0% | 20.00% | 14.29% |
| 2 | 44.45% | 32.00% | 24.49% |
| 3 | 14.81% | 19.20% | 17.49% |
| 4 | 7.41% | 11.52% | 12.49% |
| 5 | 11.52% | 8.93% | |
| 6 | 5.76% | 8.93% | |
| 7 | 8.93% | ||
| 8 | 4.46% |
Suppose your business just purchased a $100,000 asset that has a 3-year useful life, and falls into 3-year class of assets. Using the SL method, the depreciation expense each year for the next 3 years would be:
| Year | Recovery Rate | Unadjusted Basis | Depreciation Expense | Accumulated Depreciation |
| 1 | .1667 | $100,000 | $16,670 | $16,670 |
| 2 | .3333 | $100,000 | $33,330 | $50,000 |
| 3 | .3333 | $100,000 | $33,330 | $88,330 |
| 4 | .1667 | $100,000 | $16,670 | $100,000 |
Note that the book value or basis of the asset (acquisition cost – accumulated depreciation) would be $0 after it has been fully depreciated at the end of 4 years. Because of the half-year convention, it takes 4 years to depreciate the asset, even though it falls into the 3-year classification.
Depreciation expense for the same asset using the MACRS method would be calculated as:
| Year | Recovery Rate | Unadjusted Basis | Depreciation Expense | Accumulated Depreciation |
| 1 | .3333 | $100,000 | $33,333 | $33,333 |
| 2 | .4445 | $100,000 | $44,450 | $77,780 |
| 3 | .1481 | $100,000 | $14,810 | $92,950 |
| 4 | .741 | $100,000 | $7,410 | $100,000 |
Note again that the depreciation expense using MACRS is higher in the early years and lower in later years than with the SL method and that the book value after 4 years is again zero. Businesses often use MACRS for tax purposes and SL for profit reporting. Can you think of any reasons why?
Some businesses that invest small amounts in capital assets are allowed to deduct up to $1,000,000 of the cost of acquired depreciable property as a current expenditure instead of a capital expenditure. This is known as direct expensing, and is available only to businesses that don’t make large capital purchases each year. The allowable expensing amount is reduced by one dollar for each dollar of capital investment expenditure over $2,500,000 during the year. Other restrictions also apply.
Bonus or Additional Depreciation
Property purchased with a recovery period of 20 years or less may be eligible for 100% additional depreciation the year it is purchased. It is required unless the taxpayer elects out of it by class or recovery period (3, 5, 7, 10, 15, 20 year classes). It can be used on either new or used property but has limitations if purchased from a relative. Passenger automobiles may be limited to an extra $8,000 additional depreciation rather than 100%. The 100% depreciation decreases to 80% in 2024 and reduces by 20% each year after that until 2028 when it disappears.
Interest and Dividends Received
Interest and ordinary dividend income received by sole proprietorships and partnerships is taxed as ordinary income. Interest income received by corporations is taxed as corporate income. However, dividend income received by corporations is allowed eighty percent tax exclusion (only 20 percent is taxed) before being taxed as corporate income. The reason for the exclusion is that corporate income is already subject to double taxation, and taxing dividends as corporate income would result in triple (or more) taxation. Can you explain why?
Which is better for a corporation in a 21% marginal tax bracket: $1,000 of interest income or $1,000 of dividend income? Remember what we care about is after-tax cash flow (ATCF) so let’s evaluate both investments:
| Investment Income | – Taxes | = ATCF |
| Interest income $1,000 | – $1,000(.21) | = $790 |
| Dividend income $1,000 | – $1,000(.20)(.21) | = $958 |
The ATCF from the dividends of $958 would be preferred to the $790 from the interest income. The dividends are effectively taxed at a lower rate than interest income. We can find the effective rate on each dollar of dividend income received by multiplying the two marginal tax rates by the proportion of income subject to tax: that is $1(.20)(T) = $1(.20)(.21) = 0.042 or 4.2%. Accordingly, the effective tax rate T for dividends in this case is 4.2% as opposed to 21% for interest income at this marginal tax rate. What incentives do federal tax laws give regarding the type of investments that corporate businesses make?
Interest and Dividends Paid
Interest expenses paid by businesses are tax deductible. Dividends or withdrawals paid by businesses are not tax deductible. Consider a firm in a 21 percent tax bracket that pays $1,000 in interest expense and $1,000 in dividends or withdrawals. What is the after-tax cost of each expense?
| Expense Type | Expense | – Tax-savings | = After-tax expense |
| Interest expense | $1,000 | – $100(.21) | = $790 |
| Dividend expense | $1,000 | – $0 | = $1000 |
Dividends and withdrawals cost the firm $1 of after-tax income for each $1of dividend paid. Interest expense, on the other hand, costs the firm $1(1 – T) = $1(1 – .21) = $0.79 of after-tax income for each $1 of interest expense paid. Another way to think about it is to find out how much before-tax income it takes to pay $1 of both interest and dividend expenses. Using the formula discussed earlier:
Before-tax dividend expense = $1.00/(1 – .21) =
$1.266
Before-tax interest expense = $0.79/(1 – .21) = $1.00
It takes $1.27 of before-tax income to pay $1 in dividend or withdrawal expense, while it takes only $1 in before-tax income to pay $1 in interest expense. The two ways for a firm to finance its assets are to use debt or equity financing. Which method of financing do the federal tax loans favor?
Summary and Conclusions
The main lesson for managing taxes is to look at investments and cash flow on an after-tax basis, and this requires that all tax obligations are accounted for in the tax management process. Management of the firm’s taxes also requires managers to understand how different business organizations can create different tax obligations, the difference between average and marginal tax rates, the different tax obligations associated with interest versus dividend income, capital gains and capital losses, depreciation schedules, book value and market value of assets, tax deductions, and tax credits. Understanding these and other tax-related concepts will help financial managers manage the difference between what you earn and what you get to keep.
Questions
- Tiptop Farms, a sole proprietorship, had a gross income of
$600,000 in 2018. Tiptop Farms expenses were equal to $320,000.
Tiptop had interest expenses of $80,000 and depreciation expenses
of $75,000 during the year. Tiptop’s owner withdrew $25,000 from
the business during the year to help pay college expenses for the
owners’ children. The tax schedule for 2018 is:
Income Tax Rate $0 – 40,000 15% $40,001 – 100,000 28% $100,000 – 150,000 31% $150,001 + 35% - What was Tiptop’s taxable income during 2018?
- What is Tiptop’s tax liability for 2018?
- What is Tiptop’s average and marginal tax rate for the year?
- If Tiptop is considering the purchase of a new investment, what tax rate should they use?
- Consider a couple filing jointly, whose taxable income last year was $130,000. Assume that state taxes on their taxable earnings were 5%. The couple pays social security at the rate of 6.2%, and Medicare taxes at the rate of 1.45%. Half of the couple’s social security and Medicare taxes are paid by their employer. Also recognize that social security was only charged on the first $128,400. Find the couples tax liability, its average tax rate, and its marginal tax rate. What is higher, the couple’s average tax rate or their marginal tax rate? Explain your answer.
- Suppose that last year, inflation was 8%, meaning that the price of every- thing you buy has increased by 8%. If your before-tax income increased by 8% would you be just as well off as before? If not, how much more than 8% would you need to increase to buy as much as you did before inflation?
- A corporate bond is providing a yield of 12% per year, while at
the same time, a municipal bond (which is tax exempt) is yielding
9% per year. Each bond only pays interest each year until the bond
matures, at which time the principal investment will be returned.
Each bond is equally risky, and your marginal tax bracket is 30%.
You have $1,000 to invest.
- What is the after-tax cash flow from each bond? Which bond would you invest in?
- What is the percentage after-tax return on each bond?
- What before-tax equivalent on the corporate bond would make you choose it as an investment?
- Suppose that you are also subject to a 5% state tax from which neither the corporate or municipal bond is tax exempt. What is the after-tax return on each bond?
- Suppose you invest in a new tractor during the tax year that
costs you $78,000, plus $2,000 for delivery and set up. Your
marginal tax rate is 40%. Note: new farm machinery has a class
life of 5 years.
- What is the depreciation expense each year using the straight line method of depreciation?
- What is the depreciation expense each year using the MACRS 200% declining balance method of depreciation?
- What is the tax shield each year from each method?
- Which method would you use for tax purposes? How about profit reporting? Explain.
- Businesses often use MACRS for tax purposes and SL for profit reporting. Can you think of any reasons why?
- Most assets use the General Depreciation System for recovery periods. See IRS guidelines for more information. ↵