
4.6: Preparing a Production Cost Report
- Page ID
- 857
- Prepare a production cost report for a processing department.
Question: The results of the four key steps are typically presented in a production cost report. The production cost report8 summarizes the production and cost activity within a department for a reporting period. It is simply a formal summary of the four steps performed to assign costs to units transferred out and units in ending work-in-process (WIP) inventory. What does the production cost report look like for the Assembly department at Desk Products, Inc.?
- Answer
-
The production cost report for the month of May for the Assembly department appears in Figure 4.9. Notice that each section of this report corresponds with one of the four steps described earlier. We provide references to the following illustrations so you can review the detail supporting calculations.
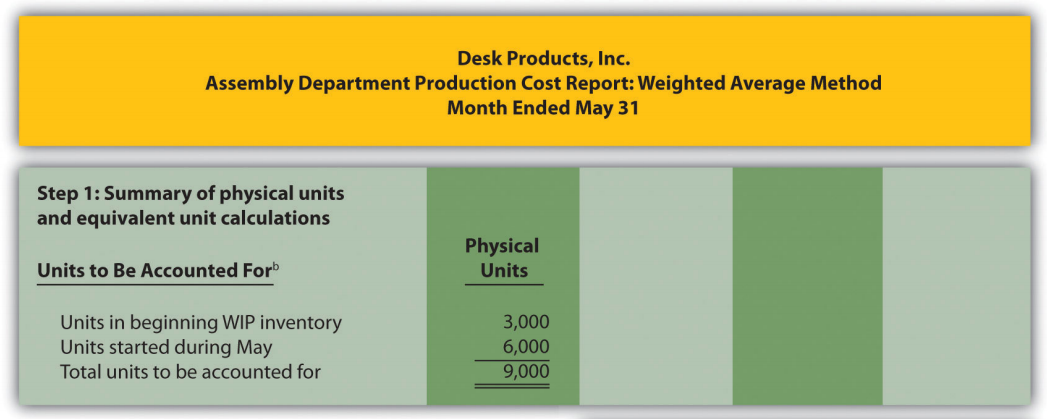
Figure \(\PageIndex{4}\): .9b.png" /> 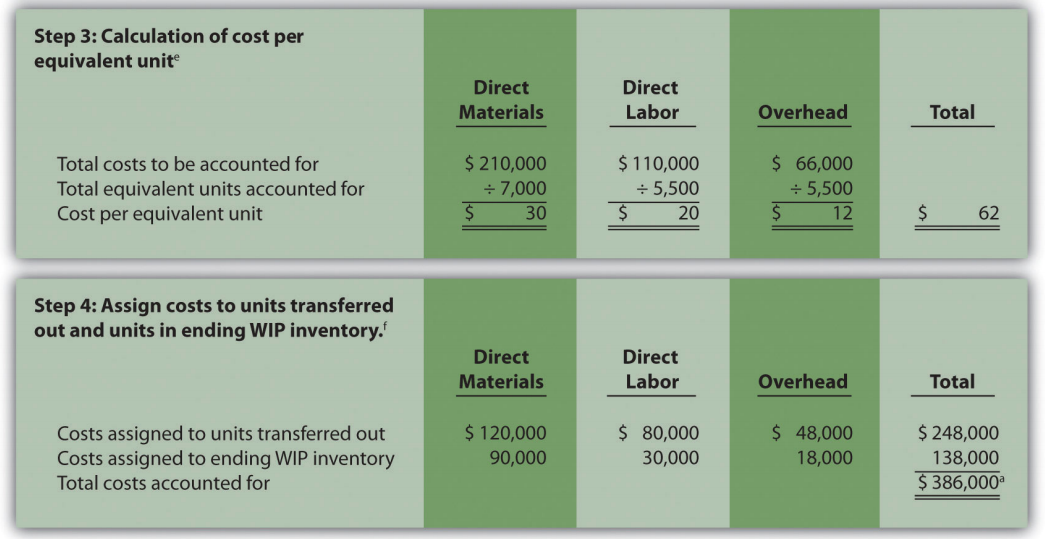
Figure \(\PageIndex{9}\): - Production Cost Report for Desk Products’ Assembly Department a Total costs to be accounted for (step 2) must equal total costs accounted for (step 4).
b Data are given.
c This section comes from Figure 4.4.
d This section comes from Figure 4.5.
e This section comes from Figure 4.6.
f This section comes from Figure 4.7.
How Do Managers Use Production Cost Report Information?
Question: Although the production cost report provides information needed to transfer costs from one account to another, managers also use this report for decision-making purposes. What important questions can be answered using the production cost report?
- Answer
-
A production cost report helps managers answer several important questions:
- How much does it cost to produce each unit of product for each department?
- Which production cost is the highest—direct materials, direct labor, or overhead?
- Where are we having difficulties in the production process? In any particular departments?
- Are we seeing any significant changes in unit costs for direct materials, direct labor, or overhead? If so, why?
- How many units flow through each processing department each month?
- Are improvements in the production process being reflected in the cost per unit from one month to the next?
Beware of Fixed Costs
Question: Why might the per unit cost data provided in the production cost report be misleading?
- Answer
-
When using information from the production cost report, managers must be careful not to assume that all production costs are variable costs. The CEO of Desk Products, Inc., Ann Watkins, was told that the Assembly department cost for each desk totaled $62 for the month of May (from Figure 4.9, step 3). However, if the company produces more or fewer units than were produced in May, the unit cost will change. This is because the $62 unit cost includes both variable and fixed costs (see Chapter 5 for a detailed discussion of fixed and variable costs).
Assume direct materials and direct labor are variable costs. In the Assembly department, the variable costs per unit associated with direct materials and direct labor of $50 (= $30 direct materials + $20 direct labor) will remain the same regardless of the level of production, within the relevant range. However, the remaining unit product cost of $12 associated with overhead must be analyzed further to determine the amount that is variable (e.g., indirect materials) and the amount that is fixed (e.g., factory rent). Managers must understand that fixed costs per unit will change depending on the level of production. More specifically, Ann Watkins must understand that the $62 unit cost in the Assembly department provided in the production cost report will change depending on the level of production. Chapter 5 provides a detailed presentation of how cost information can be separated into fixed and variable components for the purpose of providing managers with more useful information.
The four key steps of assigning costs to units transferred out and units in ending WIP inventory are formally presented in a production cost report. The production cost report summarizes the production and cost activity within a processing department for a reporting period. A separate report is prepared for each processing department. Rounding the cost per equivalent unit to the nearest thousandth will minimize rounding differences when reconciling costs to be accounted for in step 2 with costs accounted for in step 4.
Using Excel to Prepare a Production Cost Report
Managers typically use computer software to prepare production cost reports. They do so for several reasons:
- Once the format is established, the template can be used from one period to the next.
- Formulas underlie all calculations, thereby minimizing the potential for math errors and speeding up the process.
- Changes can be made easily without having to redo the entire report.
- Reports can be easily combined to provide a side-by-side analysis from one period to the next.
Review Figure 4.9 and then ask yourself: “How can I use Excel to help prepare this report?” Answers will vary widely depending on your experience with Excel. However, Excel has a few basic features that can make the job of creating a production cost report easier. For example, you can use formulas to sum numbers in a column (note that each of the four steps presented in Figure 4.9 has column totals) and to calculate the cost per equivalent unit. Also you can establish a separate line to double-check that
- the units to be accounted for match the units accounted for; and
- the total costs to be accounted for match the total costs accounted for.
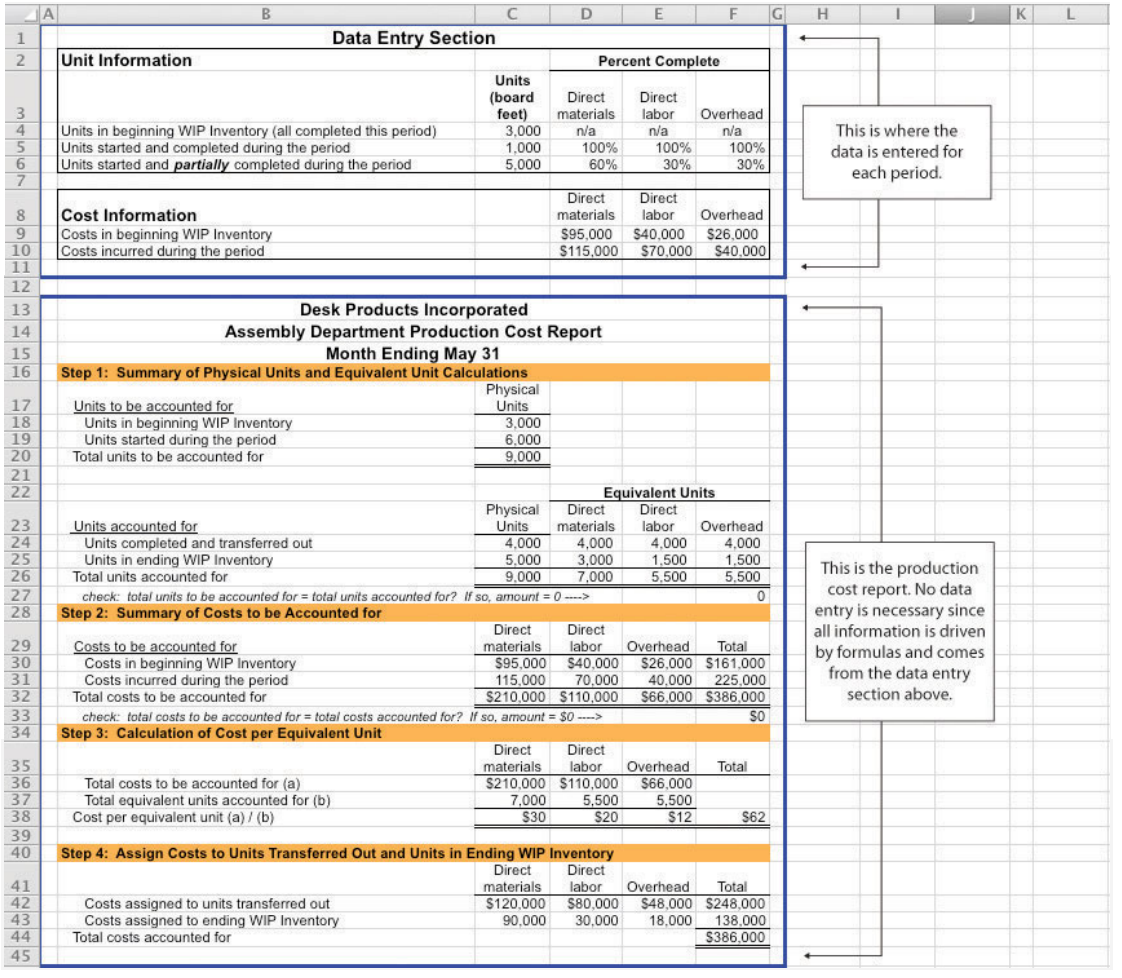
For those who want to add more complex features, the basic data (e.g., the data in Table 4.2) can be entered at the top of the spreadsheet and pulled down to the production cost report where necessary.
An example of how to use Excel to prepare a production cost report follows. Notice that the basic data are at the top of the spreadsheet, and the rest of the report is driven by formulas. Each month, the data at the top are changed to reflect the current month’s activity, and the production cost report takes care of itself.
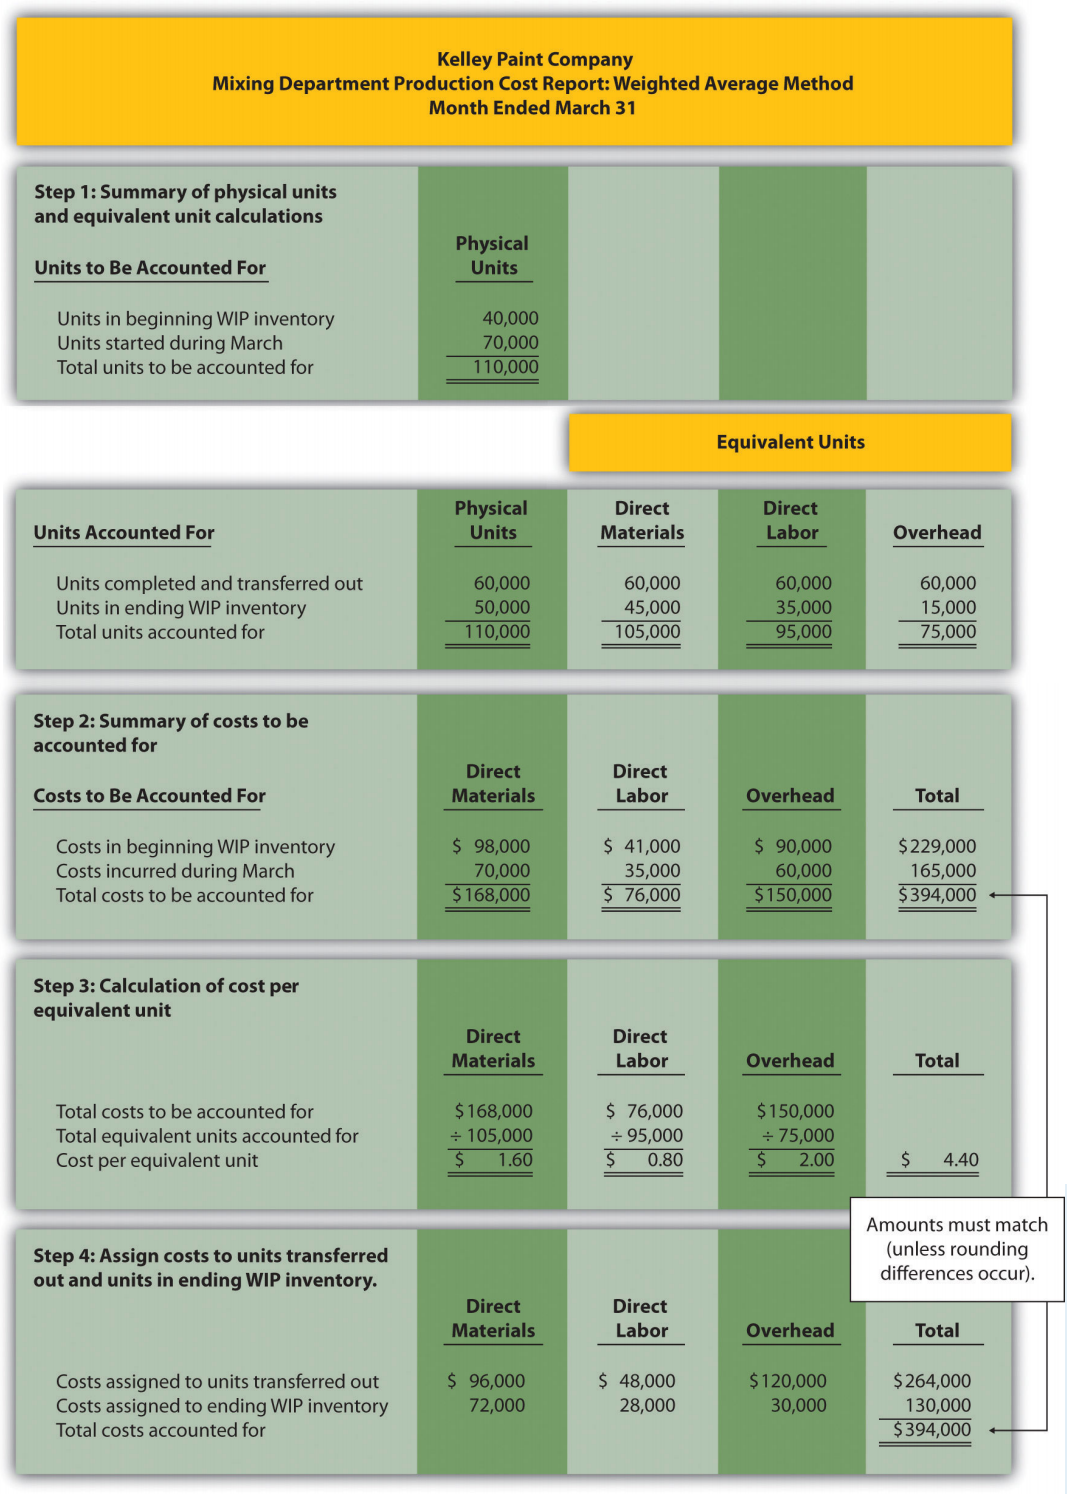
Using the information in Note 4.24 "Review Problem 4.4", prepare a production cost report for the Mixing department of Kelley Paint Company for the month ended March 31. (Hint: You have already completed the four key steps in Note 4.24 "Review Problem 4.4". Simply summarize the information in a production cost report as shown in Figure 4.9 "Production Cost Report for Desk Products’ Assembly Department".)
- Answer
-
(See solutions to Note 4.24 "Review Problem 4.4" for detailed calculations.)
Definition
- A report that summarizes the production and cost activity within a department for a reporting period.