
8.1: Introduction to Variance Analysis
- Page ID
- 44253

Budgets are the result of planning efforts to estimate a company’s performance for a period of time in the future. They are tools that guide managers and employees for keeping operations on track to achieve stated goals. Once a budget’s time period expires, its estimates then serve as benchmarks against which actual results may be compared.
The discussion of budgeting for a manufacturing company included budgets for each of the three product costs: direct materials, direct labor, and factory overhead. Those budgets were as follows.
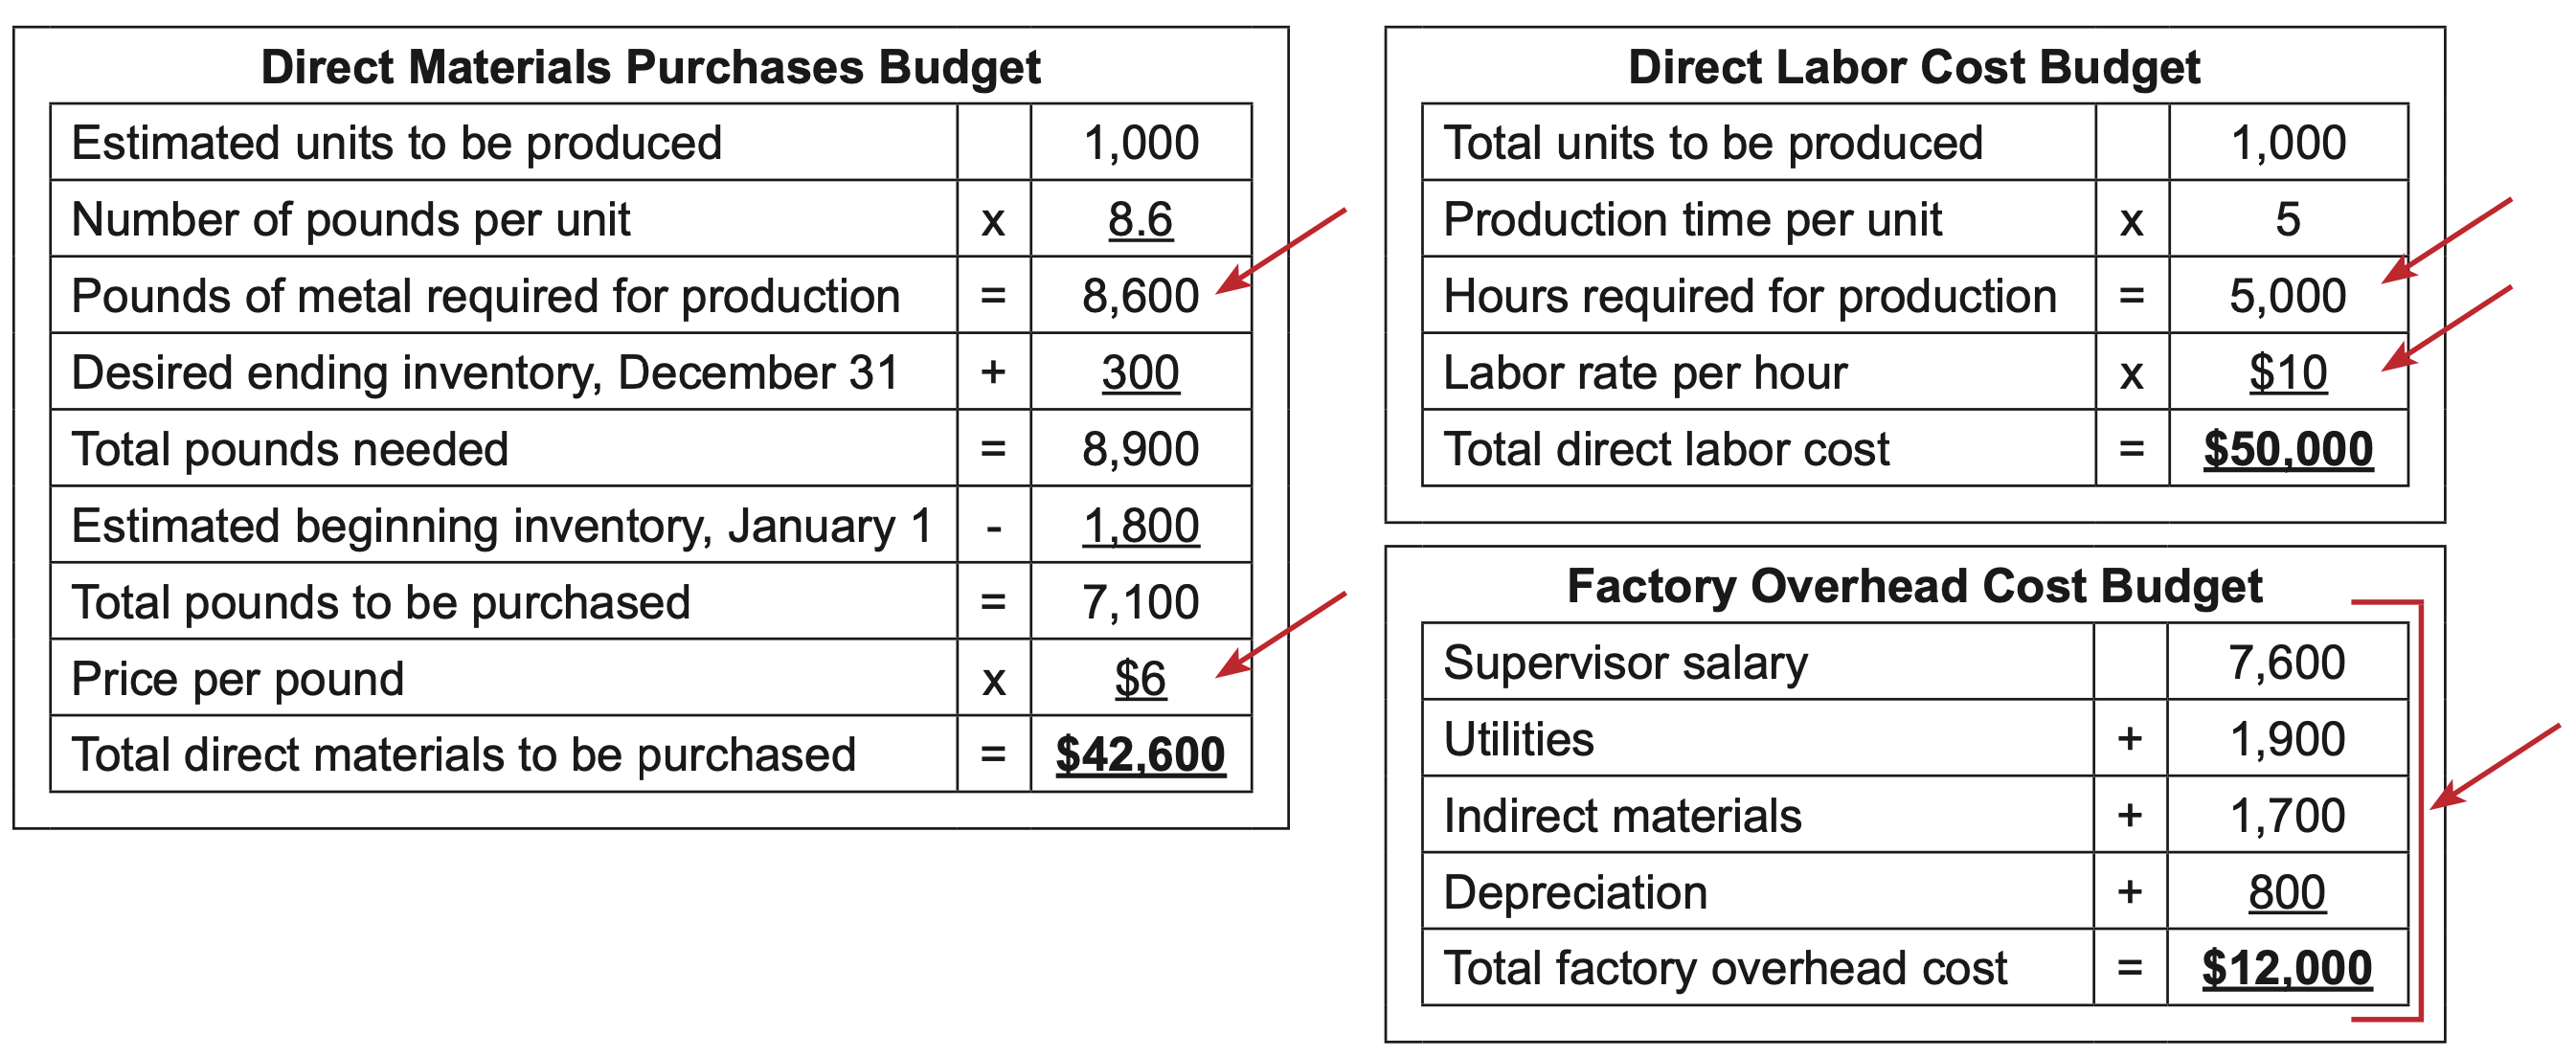
Two key estimates are part of the direct materials production budget: the number of pounds needed for the desired level of production and the price per pound. Likewise, the direct labor cost budget shows the number of labor hoursrequired to produce a desired number of units and the labor rate per hour.
The factory overhead cost budget is prepared a bit differently, listing a dollar amount for each cost. Some factory overhead costs may be further broken out into their fixed and variable components.
The amounts indicated by an arrow in the sample budgets are performance goals, also called standards. Variance analysis is a process that compares these standards to actual amounts once the budget period has expired.
Standard costs are estimated goals that are used to calculate how much a product or batch of products “should cost” to manufacture. Elements in bold below show standard costs taken from the previous budgets.
|
Direct materials: |
8,600 pounds x $6.00 per pound = $51,600 |
|
Direct labor: |
5,000 hours x $10.00 per hour = 50,000 |
|
Factory overhead: |
12,000 |
Actual cost of production may be different than standard cost if any of the five goals listed above is either not met or exceeded. If any one of the quantities or dollar amounts is higher than its standard, the result for that amount is said to be unfavorable since more was consumed spent than was planned. An unfavorable outcome in this example would be if 8,900 pounds were used in production when only 8,600 were budgeted. A quantity or unit cost is favorable when it is lower than what was anticipated. A favorable result would be if $9 per labor hour were spent since it is lower than the anticipated amount of $10 per hour.
The following example conducts a variance analysis on the three costs of manufacturing. It involves the production of 1,000 units. The standard quantities and prices per unit are as follows:
|
Production costs |
Standard price |
Standard quality |
Standard unit cost |
|
Direct materials |
$6.00 per pound |
8.6 pounds/unit |
$51.60 |
|
Direct labor |
$10.00 per hour |
5 hours/unit |
50.00 |
|
Factory overhead |
$12.00 per hour |
1 hour/unit |
12.00 |
|
\(\ \quad \quad\)Standard cost per unit |
$113.60 |