
4.1: Inventory
- Page ID
- 43076

A merchandising business manufactures products, marks them up, and sells them to customers. A merchandiser may therefore be either the buyer or the seller in a given transaction.
Inventory is items that are purchased for resale. The process of inventory valuation involves determining the quantities and dollar value of the inventory that a company owns.
The perpetual inventory system is the process of keeping a current running total of inventory, both in number of units on hand and its dollar value, at all times. When product is purchased for resale, inventory immediately increases. When inventory is sold, its total value is immediately reduced.
Items in inventory are not always purchased at the same price; the same items may cost different amounts at different times. Therefore, a business needs a system of deciding which cost to select as its expense amount for Cost of Merchandise Sold when it sells an item.
As a simple example, let’s say a company has purchased 30 identical items for resale to customers. It bought 10 items on 2/2 for $1 each, 10 items on 2/3 for $2 each, and 10 items on 2/4 for $3 each. The total cost of the 30 units in inventory is $60.
| Date | Purchases | ||
| 2/2 | 10 | $1 | $10 |
| 2/3 | 10 | $2 | $20 |
| 2/4 | 10 | $3 | $30 |
| TOTAL | 30 | $60 | |
The issue is this: If the company sells ONE item to a customer for $10, the cost of that one item needs to be determined.
| Date | Account | Debit | Credit | ||
| 2/12 | Accounts Receivable | 10 | ▲ Accounts Receivable is an asset account that is increasing. | ||
| Sales | 10 | ▲ Sales is a revenue account that is increasing. |
| Date | Account | Debit | Credit | ||
| 2/12 | Cost of Merchandise Sold | ??? | ▲ Cost of Merchandise Sold is an expense account that is increasing. | ||
| Merchandise Inventory | ??? | ▼ Merchandise Inventory is an asset account that is decreasing. |
The company will select an accepted method of valuing withdrawals from inventory. Three common methods are the following:
FIFO (First-In, First-Out) method withdraws inventory beginning with those units purchased earliest. In the example above, the Cost of Merchandise Sold would be $1, one of the items purchased on 2/2. As a result, the gross profit on the sale would be $9 ($10 - $1).
LIFO (Last-In, First-Out) method withdraws inventory beginning with those units purchased most recently. In the example above, the Cost of Merchandise Sold would be $3, one of the items purchased on 2/4. As a result, the gross profit on the sale would be $7 ($10 - $3).
Average Cost Method uses an average of the cost of all items currently in stock. In the example above, the average is $60/30 units, so the Cost of Merchandise Sold would be $2 per unit. As a result, the gross profit on the salewould be $8 ($10 - $2).
We will be answering the following four questions about inventory for an accounting period:
- What is total sales?
- What is total cost of merchandise sold?
- What is gross profit?
- What is the ending inventory balance?
4.1.1 Perpetual Inventory System
Inventory Grids
By entering transactions into a cost grid, you can organize your data to easily determine Cost of Merchandise Sold amounts and Merchandise Inventory balances after every purchase and sale. The grids show increases in Merchandise Inventory due to purchases, decreases in Merchandise Inventory due to sales, and the running Merchandise Inventory balance.
The following grid organizes the purchases and sales of a merchandiser for one of its products. It is essentially an expanded Merchandise Inventory account ledger. Not only does it show the dollar amount for each transaction and the updated running balance in dollars, but it also keeps track of the number of items bought, sold, and currently in inventory.
Sample Inventory Cost Grid
| Date | Purchases | Cost of Merchandise Sold | Inventory Balance | ||||||
| Units | Cost | Total | Units | Cost | Total | Units | Cost | Total | |
| 6/1 | 10 | $4 | $40 | ||||||
| 6/5 | 1 | $4 | $4 | 9 | $4 | $36 | |||
| 6/10 | 10 | $5 | $50 | 9 | $4 | $36 | |||
| 10 | $5 | $50 | |||||||
The Purchases columns show the details about items that were bought on different dates for resale to customers. Entries in the Purchases columns are the same regardless of the inventory valuation method selected. For a purchase, there is a debit to Merchandise Inventory and total inventory increases.
The Cost of Merchandise Sold columns show the detail about the order in which items are withdrawn from inventory for each sale. The amounts in these columns will vary based on whether the method is FIFO, LIFO, or average cost. For a sale, there is a debit to Cost of Merchandise Sold and total inventory decreases.
The Inventory Balance columns keep a running total of the number of items and their costs on each date. Each purchase is added to any inventory balance that already appears there. With a purchase, it is a good practice to first copy down what was in stock on the previous date in the Inventory Balance columns and add the new purchase below that. This clearly shows what is in stock on any given date. Each sale reduces the inventory balance by the cost of merchandise sold amount.
Only costs are entered into the grid; not the price that you sell the merchandise for to customers. If you are given the selling price, you can also determine the amount of sales and gross profit amounts outside of the grid.
There is a journal entry that corresponds to each purchase and sale. One key reason for the grid is that it enables you to determine the amounts for the cost of merchandise sold for each sale.
FIFO under the perpetual inventory system—FIFO (first-In, first-out) is a method of inventory valuation where the cost of the items purchased earliest is used in Cost of Merchandise Sold when one item is resold. The balance in Merchandise Inventory, which includes those items still available for sale, is comprised of the costs of those items purchased most recently.
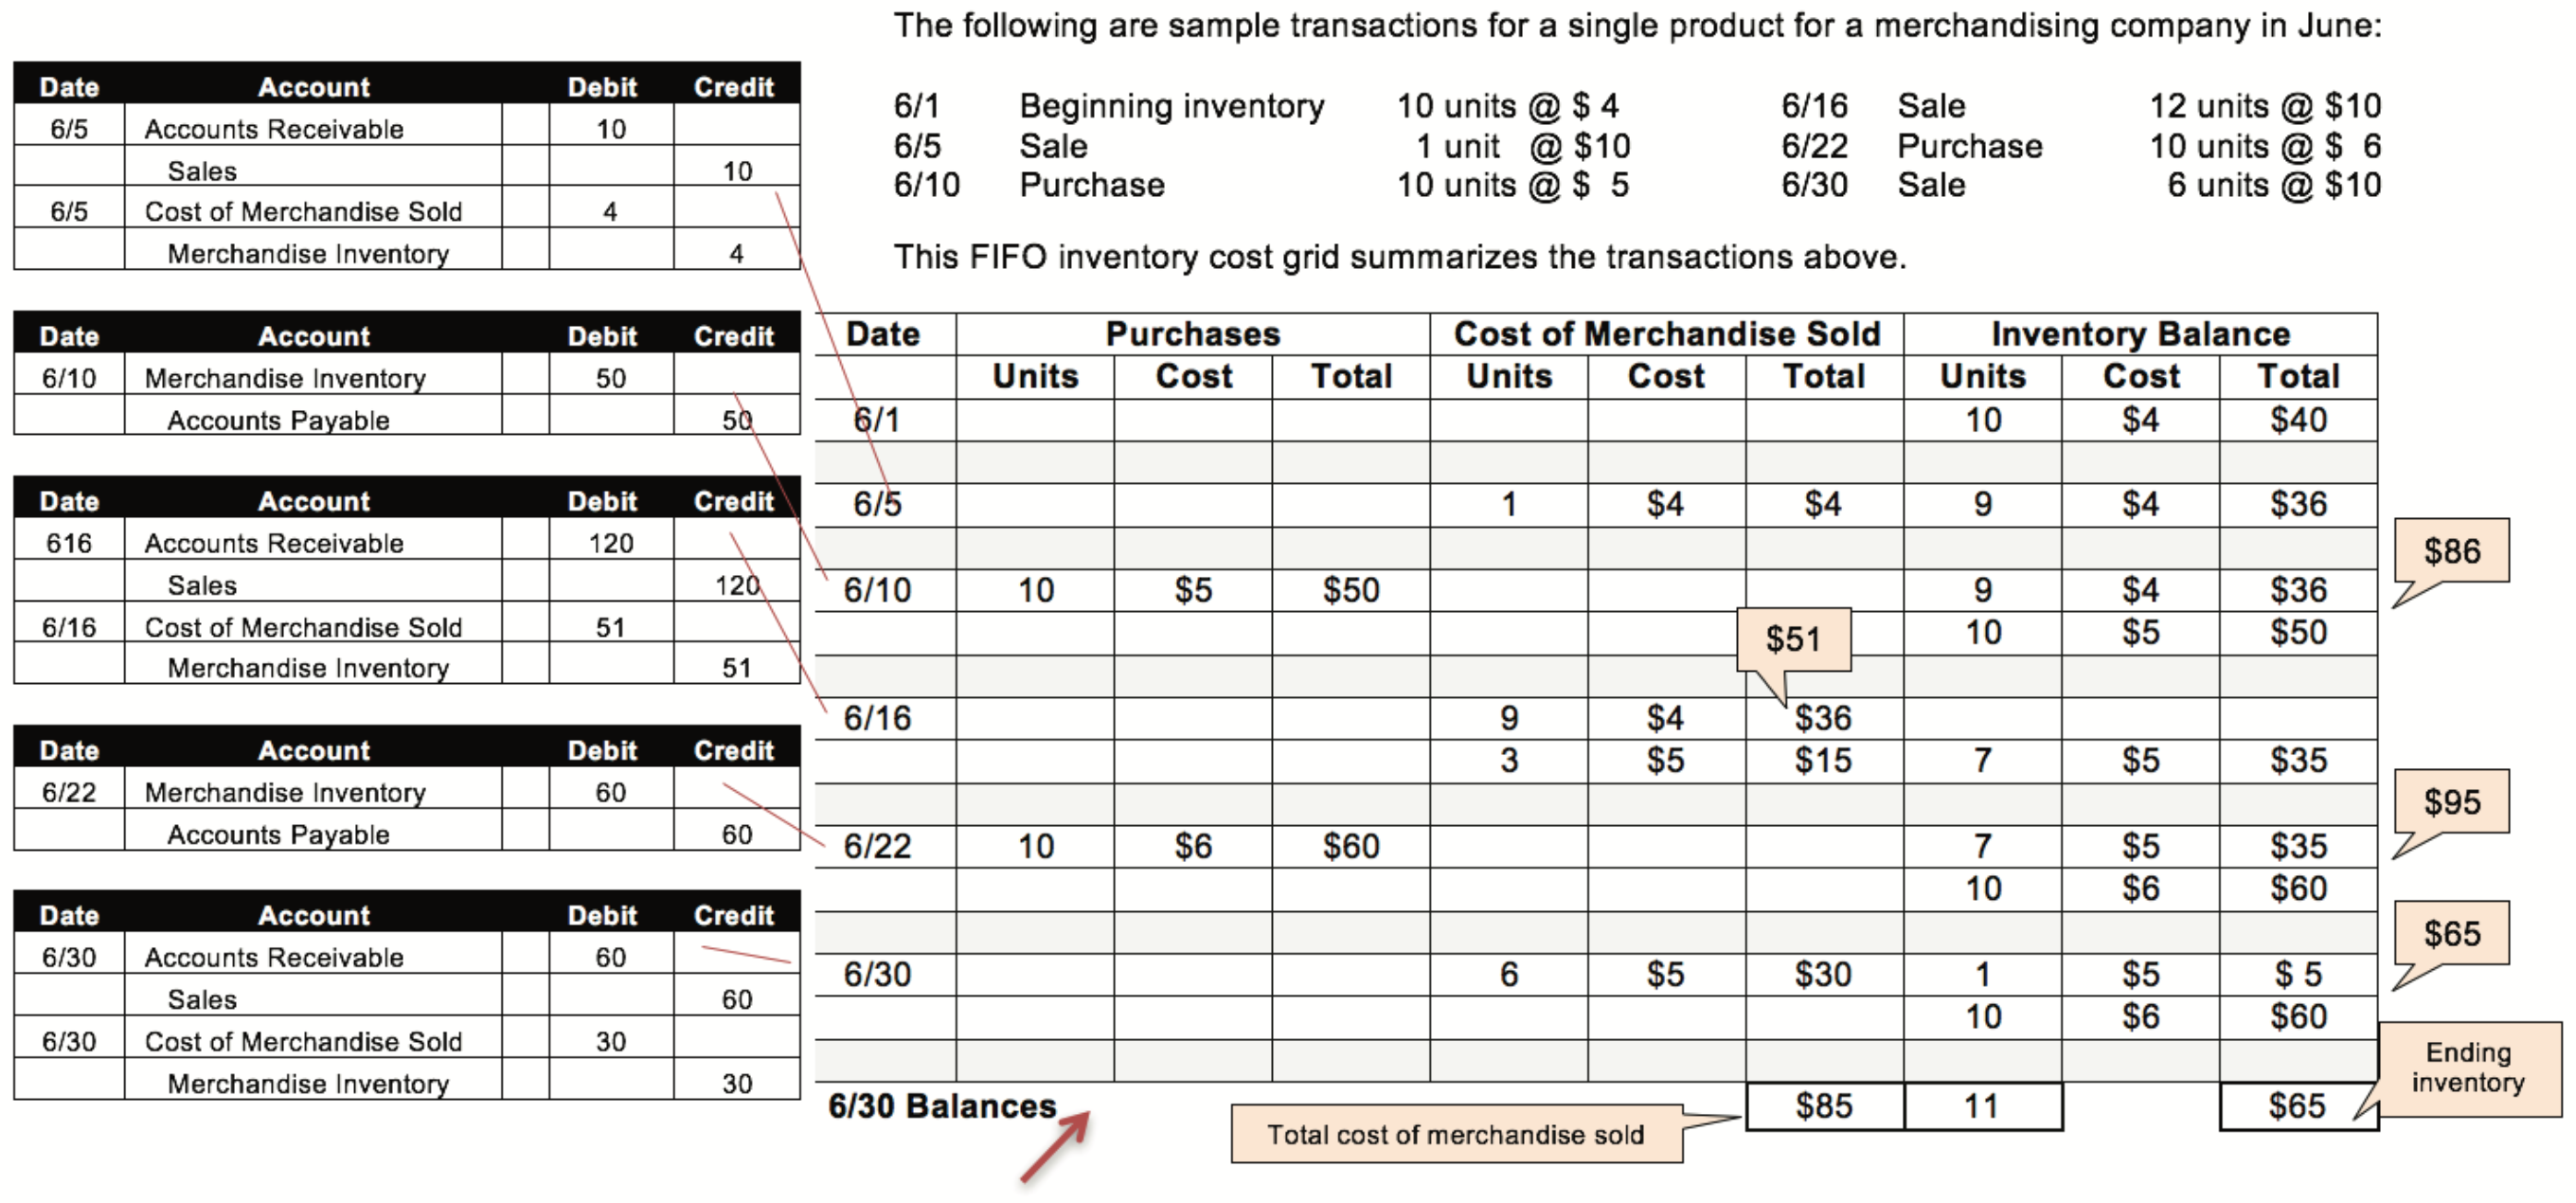
| 6/1 | The inventory balance that is given is entered. This is carried over from the previous month. |
| 6/5 | One unit is sold. Since all 10 units in stock cost $4, the only choice is a $4 cost for that item in the Cost of Merchandise Sold columns. This is deducted from the inventory balance. |
| 6/10 | Purchases are entered in the Purchases columns and added to the inventory balance. |
| 6/16 | Now it is important to know you are using FIFO. The customer ordered 12 items. You have 19 in stock at two different costs. Under FIFO you usethe “oldest” ones first – the $4 items. You sell all 9 of those and then need 3 items that cost $5 to complete the order. You use two lines in the Cost of Merchandise Sold columns – one for each unit cost. This is deducted from the inventory balance. |
| 6/22 | Purchases are entered in the Purchases columns and added to the inventory balance. |
| 6/30 | The customer ordered 6 items. You have 17 in stock at two different costs. Under FIFO you use the “oldest” ones first – the $5 items. You sell 6 ofthose and enter this in the Cost of Merchandise Sold. This is deducted from the inventory balance. |
Four inventory questions under FIFO:
- What is total sales? 19 units, $190
(1 + 12 + 6) = 19 units sold x $10 per unit
- What is total cost of merchandise sold? $85
($4 + $36 + $15 + $30) from cost of merchandise sold column
- What is gross profit? $105
Sales – cost of merchandise sold is $190 - $85
- What is the ending inventory balance? 11 units, $65 6/30 inventory balance amounts in cost grid
LIFO under the perpetual inventory system—LIFO (last-in, first-out) is a method of inventory valuation where the cost of the item purchased most recently is used in Cost of Merchandise Sold when one item is resold. The balance in Merchandise Inventory, which includes those items still available for sale, is comprised of the costs of those items purchased earliest.
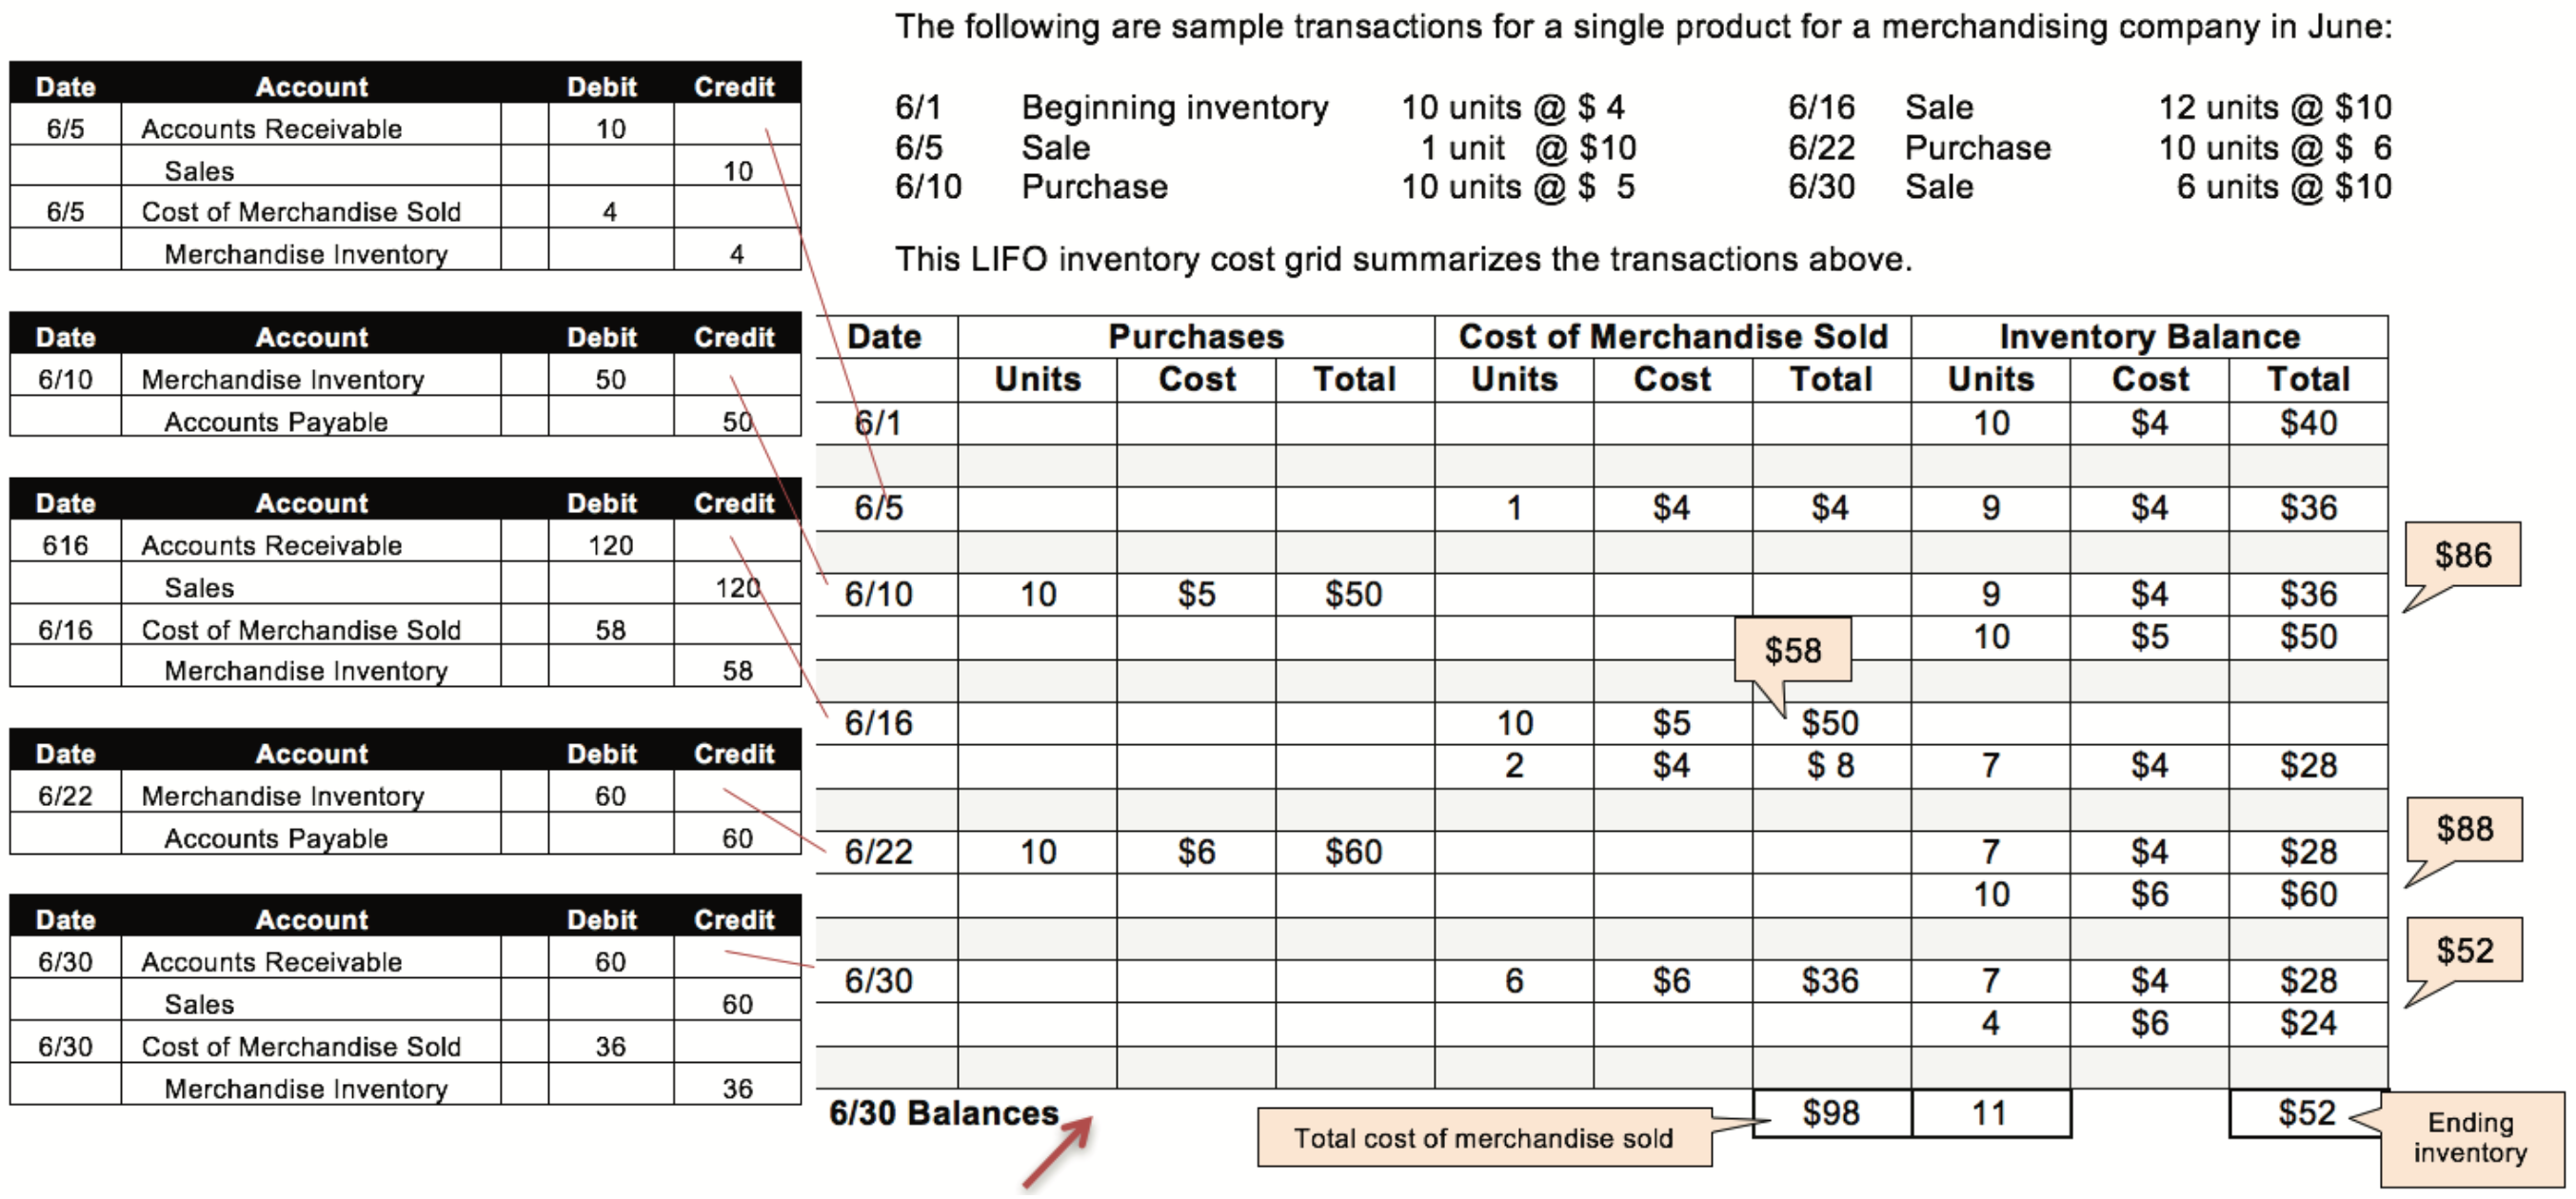
| 6/1 | The inventory balance that is given is entered. This is carried over from the previous month. |
| 6/5 | One unit is sold. Since all 10 units in stock cost $4, the only choice is a $4 cost for that item in the Cost of Merchandise Sold columns. This is deducted from the inventory balance. |
| 6/10 | Purchases are entered in the Purchases columns and added to the inventory balance. |
| 6/16 | Now it is important to know you are using LIFO. The customer ordered 12 items. You have 19 in stock at two different costs. Under LIFO you usethe “newest” ones first – the $5 items. You sell all 10 of those and then need 2 items that cost $4 to complete the order. You use two lines in the Cost of Merchandise Sold columns – one for each unit cost. This is deducted from the inventory balance. |
| 6/22 | Purchases are entered in the Purchases columns and added to the inventory balance. |
| 6/30 | The customer ordered 6 items. You have 17 in stock at two different costs. Under LIFO you use the “newest” ones first - the $6 items. You sell 6 of those and enter this in the Cost of Merchandise Sold. This is deducted from the inventory balance. |
Four inventory questions under LIFO:
What is total sales? 19 units, $190
(1 + 12 + 6) = 19 units sold x $10 per unit
- What is total sales? 19 units, $190
(1 + 12 + 6) = 19 units sold x $10 per unit
- What is total cost of merchandise sold? $98
($4 + $50 + $8 + $36) from cost of merchandise sold column
- What is gross profit? $92
Sales – cost of merchandise sold is $190 - $98
- What is the ending inventory balance? 11 units, $52
6/30 inventory balance amounts in cost grid
Average cost under the perpetual inventory system—Average cost is a method of inventory valuation where each time there is a purchase or sale, the dollar value of the remaining inventory on hand is divided by the number of units in stock to arrive at an average cost per unit. Likewise, the cost of merchandise sold is determined by using an average cost per unit.
- What is total sales? 19 units, $190.00
(1 + 12 + 6) = 19 units sold x $10 per unit
- What is total cost of merchandise sold? $90.70 ($4 + $54.36 + $32.34) from cost of merchandise sold column
- What is gross profit? $99.30
Sales – cost of merchandise sold is $190.00 - $90.70
- What is the ending inventory balance? 11 units, $58.74
6/30 inventory balance amounts in cost grid
The results of the preceding example for both FIFO and LIFO under the perpetual inventory system can be summarized in four questions.
| Four inventory questions | FIFO | LIFO | Average cost |
| 1. What is total sales? (19 units) | $190.00 | $190.00 | $190.00 |
| 2. What is total cost of merchandise sold? (19 units) | 85.00 | 98.00 | 90.70 |
| 3. What is gross profit? | 105.00 | 92.00 | 99.30 |
| 4. What is the ending inventory balance? (11 units) | 65.00 | 52.00 | 58.74 |
Under all three methods, 19 units were sold and total sales were $190. Notice, however, that under FIFO the 19 units COST $85, under LIFO these same 19 units COST $98, and under average cost these same 19 units COST $90.70. This is a $13 difference between the highest and lowest costing method.
Gross profit is also different among the three methods. Because less cost is deducted from sales under the FIFO method, gross profit is $13 higher under FIFO than it is for LIFO.
That $13 difference also appears in the ending inventory balances. Since the cost of merchandise sold was lower under FIFO than it was under LIFO and average cost, the ending inventory balance under FIFO is higher that with the other two methods.
To summarize, there is a $13 difference between FIFO and LIFO in the cost of goods sold and ending inventory amounts. FIFO includes that $13 as part of ending inventory; LIFO considers that $13 to be part of cost of merchandise sold.
NOTE: The pattern above will result when costs are rising over time. In this example, they increased from $4 to $5 to $6. If costs decrease over time, the results will be the opposite: LIFO would include the difference as part of ending inventory and FIFO would consider the difference to be part of cost of merchandise sold.
The results for the average cost method typically fall between those for LIFO and FIFO.
4.1.2 Periodic Inventory System
As was mentioned in the merchandising discussion, some companies do not keep an ongoing running inventory balance as was shown under the perpetual inventory system. Instead, these companies choose to wait until the end of the accounting period, just before financial statements are prepared, to conduct a physical inventory count to determine (1) how much ending inventory they still have in stock (counted) and (2) how much inventory they have sold during the period, which is their cost of merchandise sold (calculated).
Cost of merchandise sold is determined by first calculating cost of merchandise available for sale, which is the beginning inventory value plus purchases during the period.
The following is sample information for a single product for a merchandising company that uses the periodic inventory system in June:
| 6/1 | Beginning inventory | 10 units @ $ 4 = | $ 40 |
| 6/10 | Purchase | 10 units @ $ 5 = | 50 |
| 6/22 | Purchase | 10 units @ $ 6 = | \(\ \underline{60}\) |
Cost of goods available for sale: 30 units at a total cost of $150
| 6/5 | Sale | 1 units @ $ 10 | |
| 6/16 | Sale | 12 units @ $ 10 | |
| 6/30 | Sale | 6 units @ $ 10 |
Total units sold: 19 units
Ending inventory: 11 units (30 units available – 19 units sold from above)
The same three flow methods of withdrawing inventory from stock—FIFO, LIFO, and average cost—are used under the periodic system. The periodic system disregards the dates of the purchases and sales and just looks at the totals of each collectively.
FIFO Under the Periodic Inventory System
Under FIFO, the 19 units sold are drawn from earliest inventory in stock to determine cost of goods sold. The first 10 units are from the beginning inventory and the remaining 8 units are from the 6/10 purchase.
Cost of merchandise sold = (10 x $4) + (9 x $5) = $40 + $45 = $85
The 11 units in ending inventory include the remaining 1 unit from the
6/10 purchase and all 10 units from the 6/22 purchase.
Ending inventory = (1 x $5) + (10 x $6) = $5 + $60 = $65
The total cost of goods available for sale during the period, which was 30 units at a total cost of $150, is split between cost of merchandise sold and ending inventory.
LIFO Under the Periodic Inventory System
Under LIFO, the 18 units sold are drawn from latest inventory in stock to determine cost of goods sold. The first 10 units are from the 6/22 purchase and the remaining 8 units are from the 6/10 purchase.
Cost of merchandise sold = (10 x $6) + (9 x $5) = $60 + $45 = $105
The 12 units in ending inventory include the remaining 2 units from the
6/10 purchase and all 10 units from beginning inventory.
Ending inventory = (1 x $5) + (10 x $4) = $5 + $40 = $45
The total cost of goods available for sale during the period, which was 30 units at a total cost of $150, is split between cost of merchandise sold and ending inventory.
Average Cost Under the Periodic Inventory System
Under average cost, the 30 units available for sale are divided into their total cost, as follows:
$150 / 30 = $5 per unit
The 19 units sold are all costed at $5. Cost of merchandise sold = 19 x $5 = $95.
The 11 units in ending inventory are all costed at $5. Ending inventory = 11 x $5 = $55.
The total cost of goods available for sale during the period, which was 30 units at a total cost of $150, is split between cost of merchandise sold and ending inventory.
The results of the preceding example for both FIFO and LIFO under the periodic inventory system can be summarized in four questions.
| Four inventory questions | FIFO | LIFO | Average cost |
| 1. What is total sales? (19 units) | $190 | $190 | $190.00 |
| 2. What is total cost of merchandise sold? (19 units) | 85 | 105 | 95 |
| 3. What is gross profit? | 105 | 85 | 95 |
| 4. What is the ending inventory balance? (11 units) | 65 | 45 | 55 |
Under all three methods, 19 units were sold and total sales were $190. Notice, however, that under FIFO the 19 units COST $85, under LIFO these same 19 units COST $105, and under average cost these same 19 units COST $95. This is a $30 difference between the highest and lowest costing method.
Gross profit is also different among the three methods. Because less cost is deducted from sales under the FIFO method, gross profit is $30 higher under FIFO that it is for LIFO.
That $30 difference also appears in the ending inventory balances. Since the cost of merchandise sold was lower under FIFO than it was under LIFO and average cost, the ending inventory balance under FIFO is higher that with the other two methods.
To summarize, there is a $30 difference between FIFO and LIFO in the cost of goods sold and ending inventory amounts. FIFO includes that $30 as part of ending inventory; LIFO considers that $30 to be part of cost of merchandise sold.
NOTE: The pattern above will result when costs are rising over time. In this example, they increased from $4 to $5 to $6. If costs decrease over time, the results will be the opposite: LIFO would include the difference as part of ending inventory and FIFO would consider the difference to be part of cost of merchandise sold.
The results for the average cost method typically fall between those for LIFO and FIFO.
Also note that the results for FIFO are the same under the periodic and perpetual inventory systems.
4.1.3 Lower-of-Cost-or-Market Inventory Valuation
A company should follow the principle of conservatism, which means that if there is more than one way to report its financial information, the approach that shows the results in the least favorable light should be presented. In this way,readers of the financial information see the “worst-case scenario” and are not misled into believing the results are more positive than they really are.
The value of a company’s inventory is one of the amounts where this principle should apply. Therefore, after a company has valued its ending inventory by the FIFO, LIFO, or average cost method, it may take an additional step to ensure that the value of the inventory that is reported is not misinterpreted or overstated. Lower-of-cost-or-market is an additional calculation that is used to value inventory if the cost of a product (or products) declines after the item(s) has been purchased for inventory. “Market” can be interpreted as replacement cost, or what the item is selling for today. The company lists all the products it sells and for each product compares the price paid (cost) to the current market value. The lower of the two numbers is used to report the value of a product’s inventory on the balance sheet.
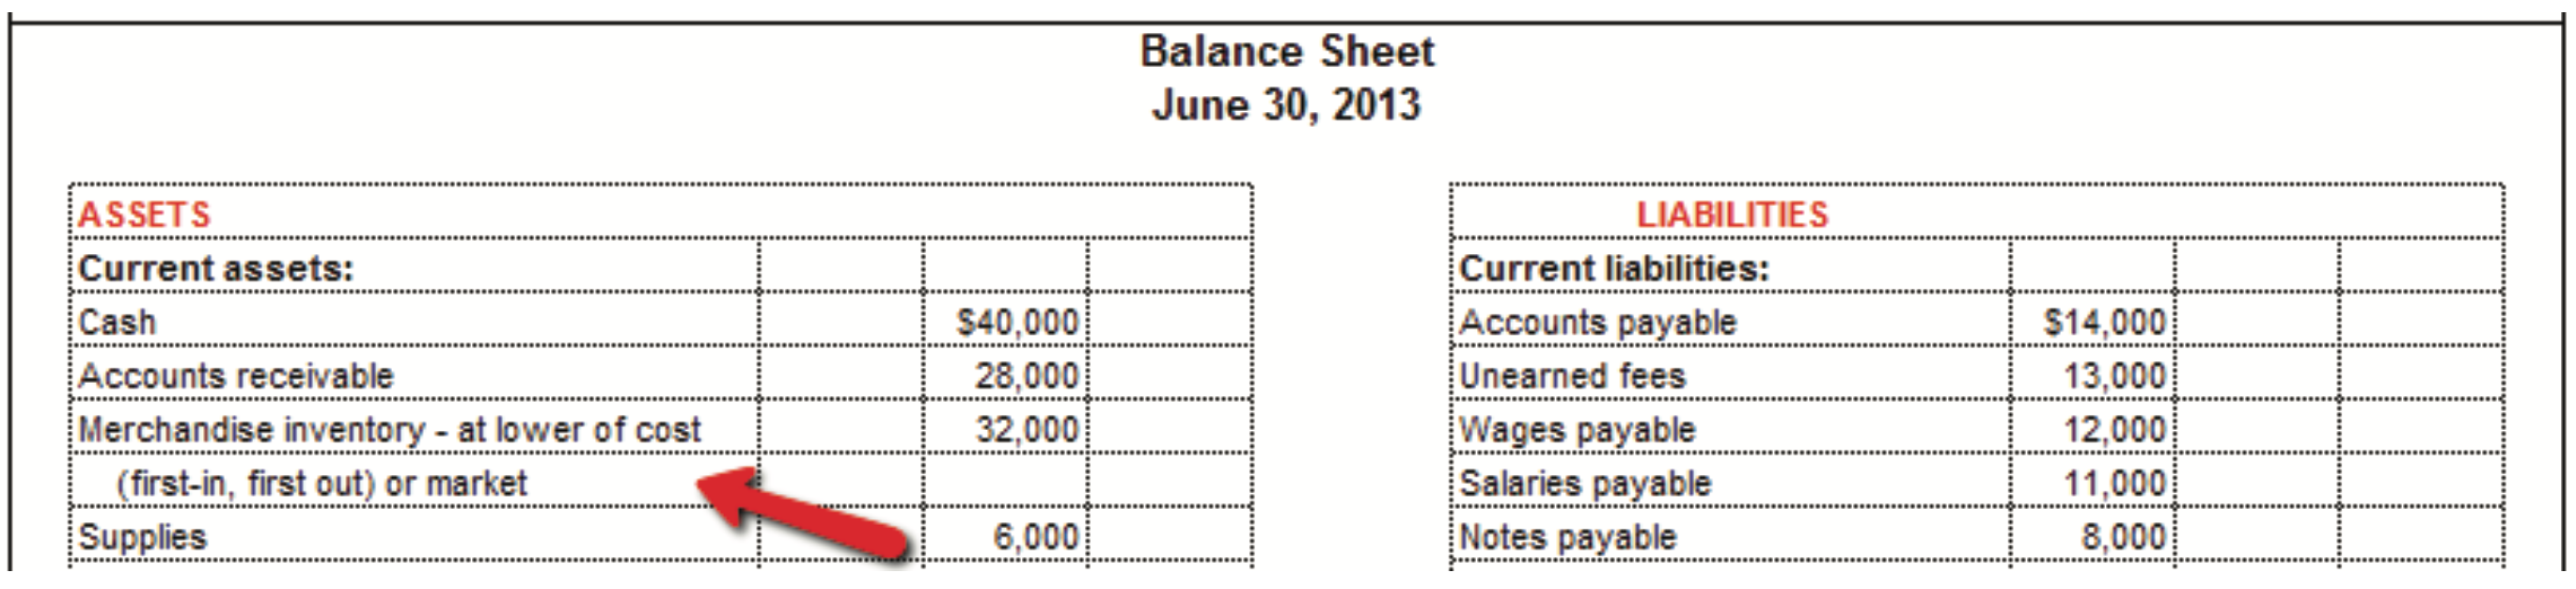
Notice how Merchandise Inventory is presented on the balance sheet when lower-of-cost-or-market is used.
The following example presents inventory data for July 31 for a business that uses the lower-of-cost-or-market basis of inventory valuation. The information in the white cells is given. The gray boxes are the cells that need to be calculated.
| Commodity | Quantity | Unit Cost | Unit Market Price | Total Cost | Total Market | Lower of Cost or Market |
| A | 10 | $ 6 | $ 5 | $ 60 | $ 50 | $ 50 |
| B | 20 | 10 | 11 | 200 | 220 | 200 |
| C | 30 | 9 | 8 | 270 | 240 | 240 |
| D | 40 | 3 | 4 | 120 | 160 | 120 |
| Totals | $650 | $610 | ||||
- Multiply the inventory quantity by the unit cost price to get total cost.
- Multiply the inventory quantity by the unit market price to get total market value.
- For lower of cost or market, take the lower of the two results in each row.
The total purchase price of all of the merchandise combined is $650. The total lower-of-cost-or-market amount for all of the merchandise as of July 31 is $610. The inventory lost $40 of value due to market decline/prices dropping.
A business has two models of cell phones in stock to sell to customers.
It has 200 units of Model #1. Each of those cost the company $100. If the company were to buy these phones today, each unit would cost $110.
It also has 200 units of Model #2, which were purchased two years ago for $100 per unit. The market price for these is currently $60 per unit. It has dropped because these units are somewhat out of date.
If lower-of-cost-or-market is NOT used, the total inventory is valued at $40,000.
| Model #1: | 200 x $100 = $20,000 | (number of units x cost per unit) |
| Model #2: | 200 x $100 = 20,000 | (number of units x cost per unit) |
| Total | $40,000 |
If lower-of-cost-or-market is used, the total inventory is valued at $32,000.
| Model #1: | 200 x $100 = $20,000 | (number of units x cost per unit) |
| Model #2: | 200 x $ 60 = 12,000 | (number of units x market price per unit since it is lower) |
| Total | $32,000 |
The inventory should be reported at $32,000 on the balance sheet even though it was purchased for $40,000. This gives the reader a clearer picture of what the inventory is actually worth.
4.1.4 Physical Inventory Count
Companies using a perpetual inventory system keep a running total of the inventory they have on hand in their record books. At times, a physical inventory count is done to verify that a company actually has the amount of inventory that is indicated in its records.
The company will count/include the items that it owns that are on hand on its premises.
Items may be on the company’s premises that it does not own, and these should not be included in the physical inventory count. These may include:
- Items on consignment from someone else (the company has agreed to sell someone else’s product for them)
- Items in for warranty repair (the company does not re-possess these)
- Items held aside for customers that have been paid for already (ownership has been transferred)
The following items would be owned by the company and should be included:
- Items returned by customers (the company re-possesses these)
- Items held aside for customers that have not been paid for yet (ownership has not yet been transferred)
The company must also count/include items that it owns that are off premise at other locations. These may include:
- Items on consignment to someone else (the other party has agreed to sell the company’s items for them)
- Items out for warranty repair with another company (the other party does not re-possess these)
- Items that the company has purchased that are in transit (i.e., on the UPS truck) if the shipping terms are FOB shipping
- Items that the company has sold that are in transit (i.e., on the UPS truck) if the shipping terms are FOB destination
Whoever is responsible for absorbing the transportation cost (buyer or seller) also owns the merchandise while it is in transit.
Effect of Errors in Physical Inventory Count
To see the effect of an error in the physical inventory count on the financial statements, let’s assume that a business reports what it counts as its Merchandise Inventory amount on the balance sheet.
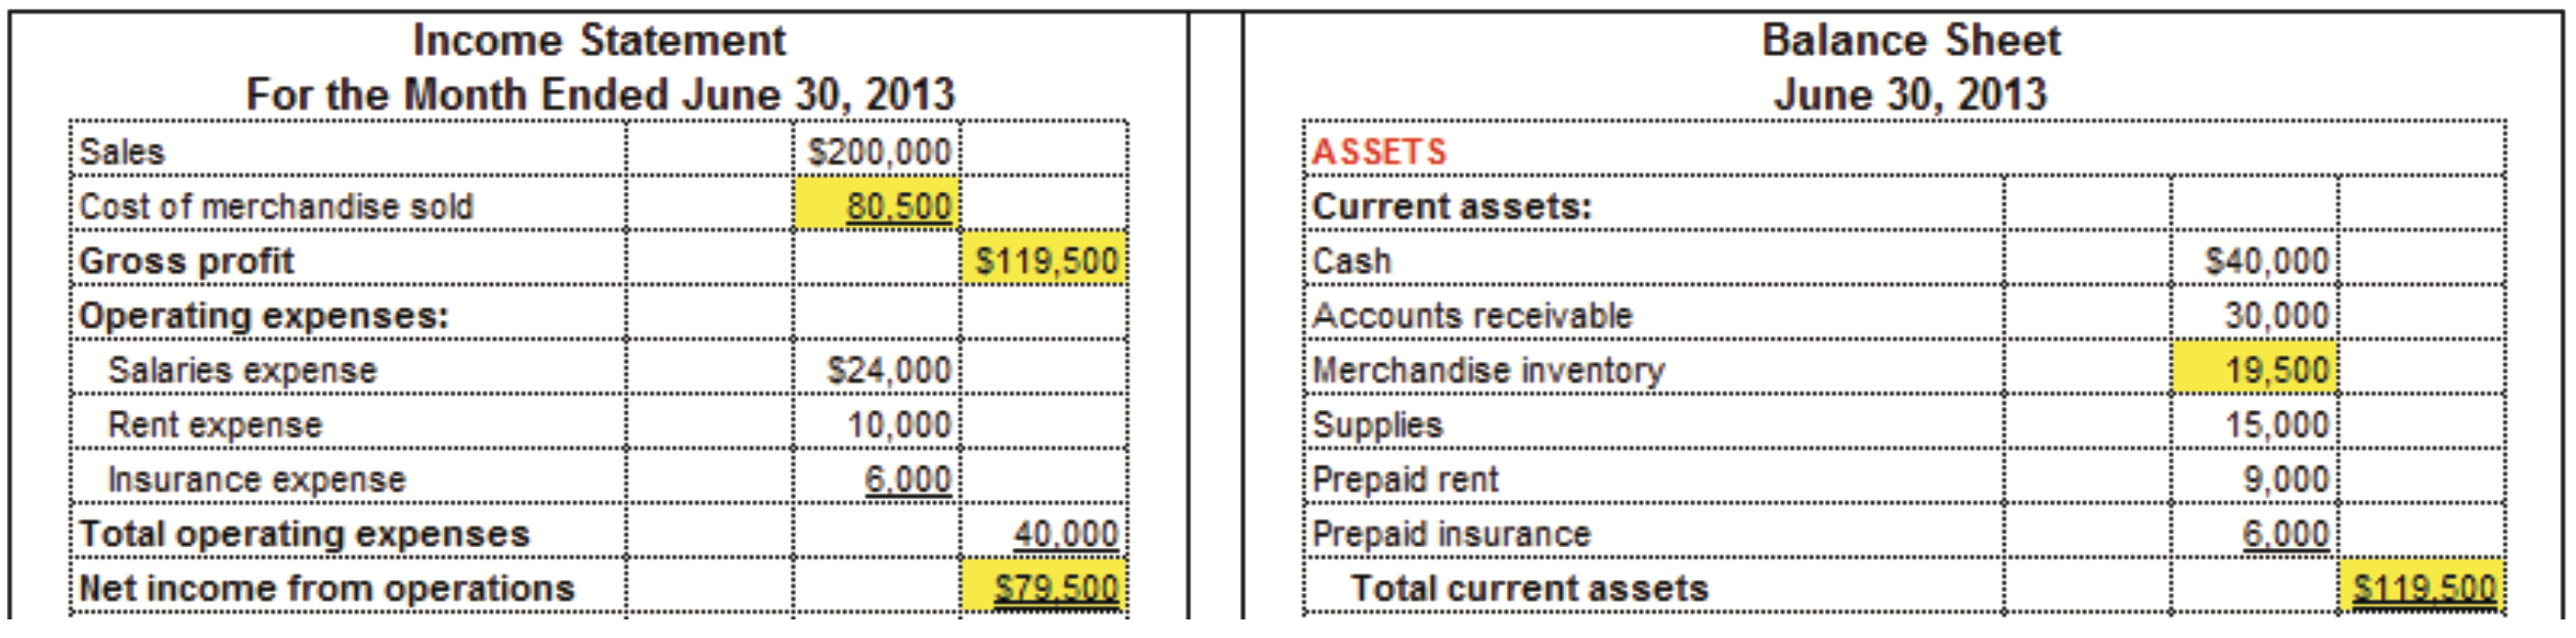
In the example below, assume that the correct amount of merchandise inventory on hand is $20,000. The amounts in yellow in the excerpts of the following financial statements are correct.
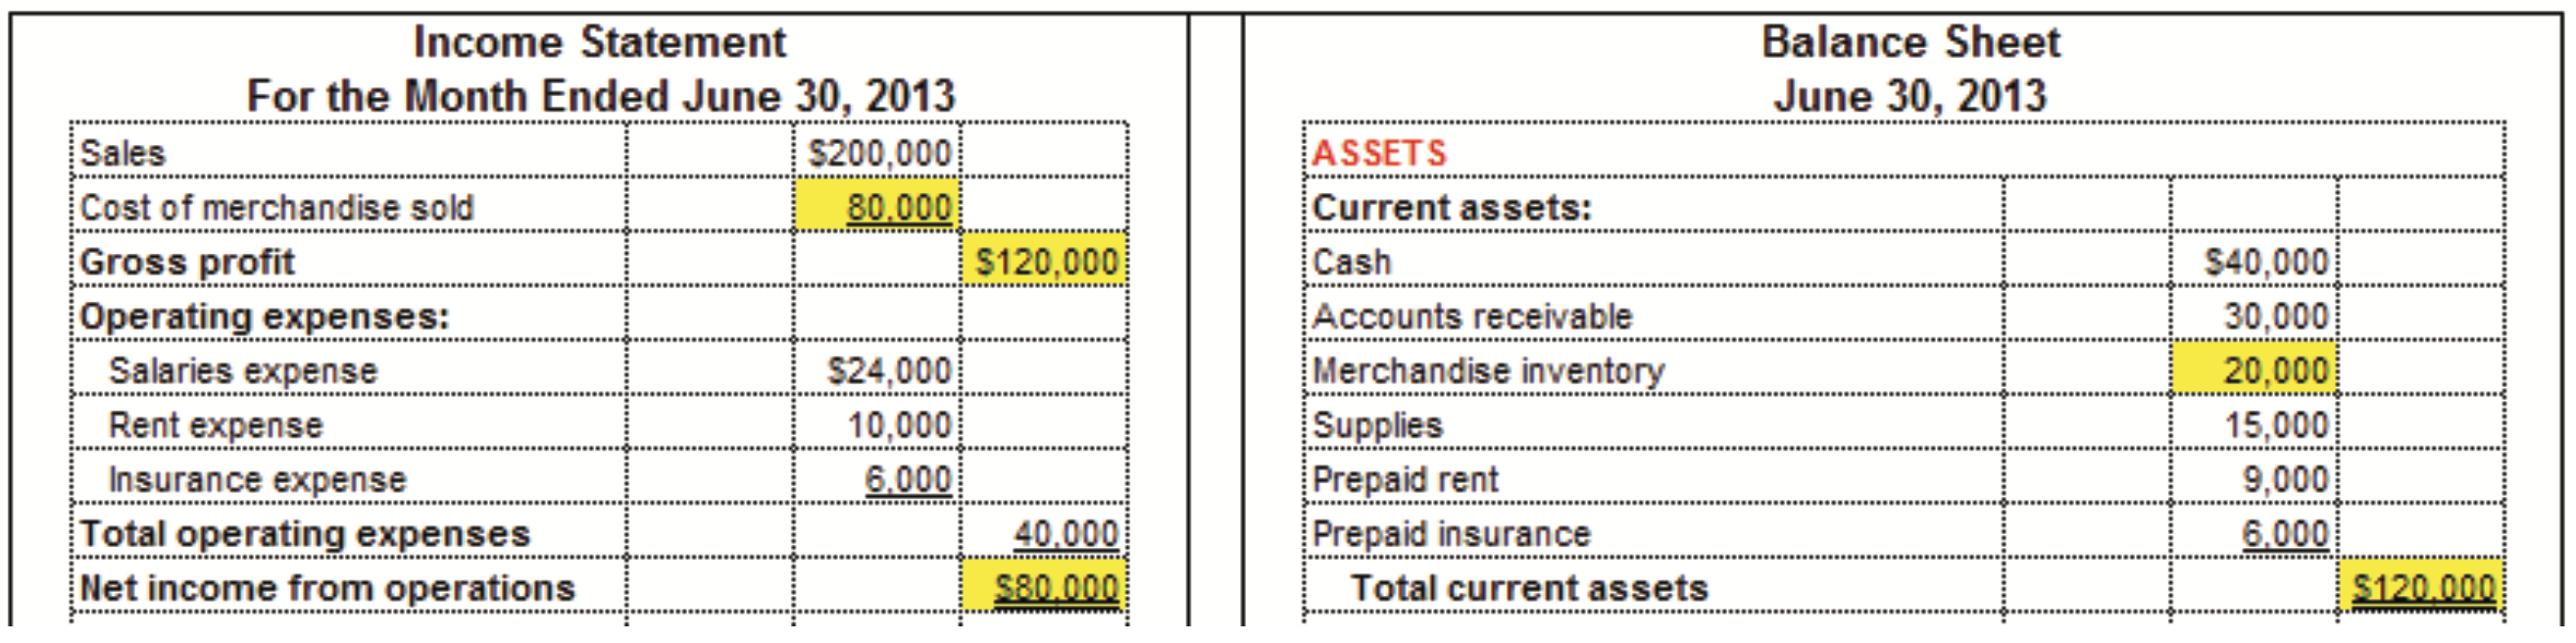
Understating Merchandise Inventory (reporting an amount that is too low)
The financial statements that follow show the effect of understating Merchandise Inventory, where something was missed in the physical inventory count. Only $19,500 rather than $20,000 is reported on the balance sheet.
As a result of this error, (1) Merchandise Inventory is understated, (2) Total assets are understated, (3) Cost of merchandise sold is overstated, (4) Net income is understated, and (5) Retained earnings and total stockholders’ equity (not shown) are understated.
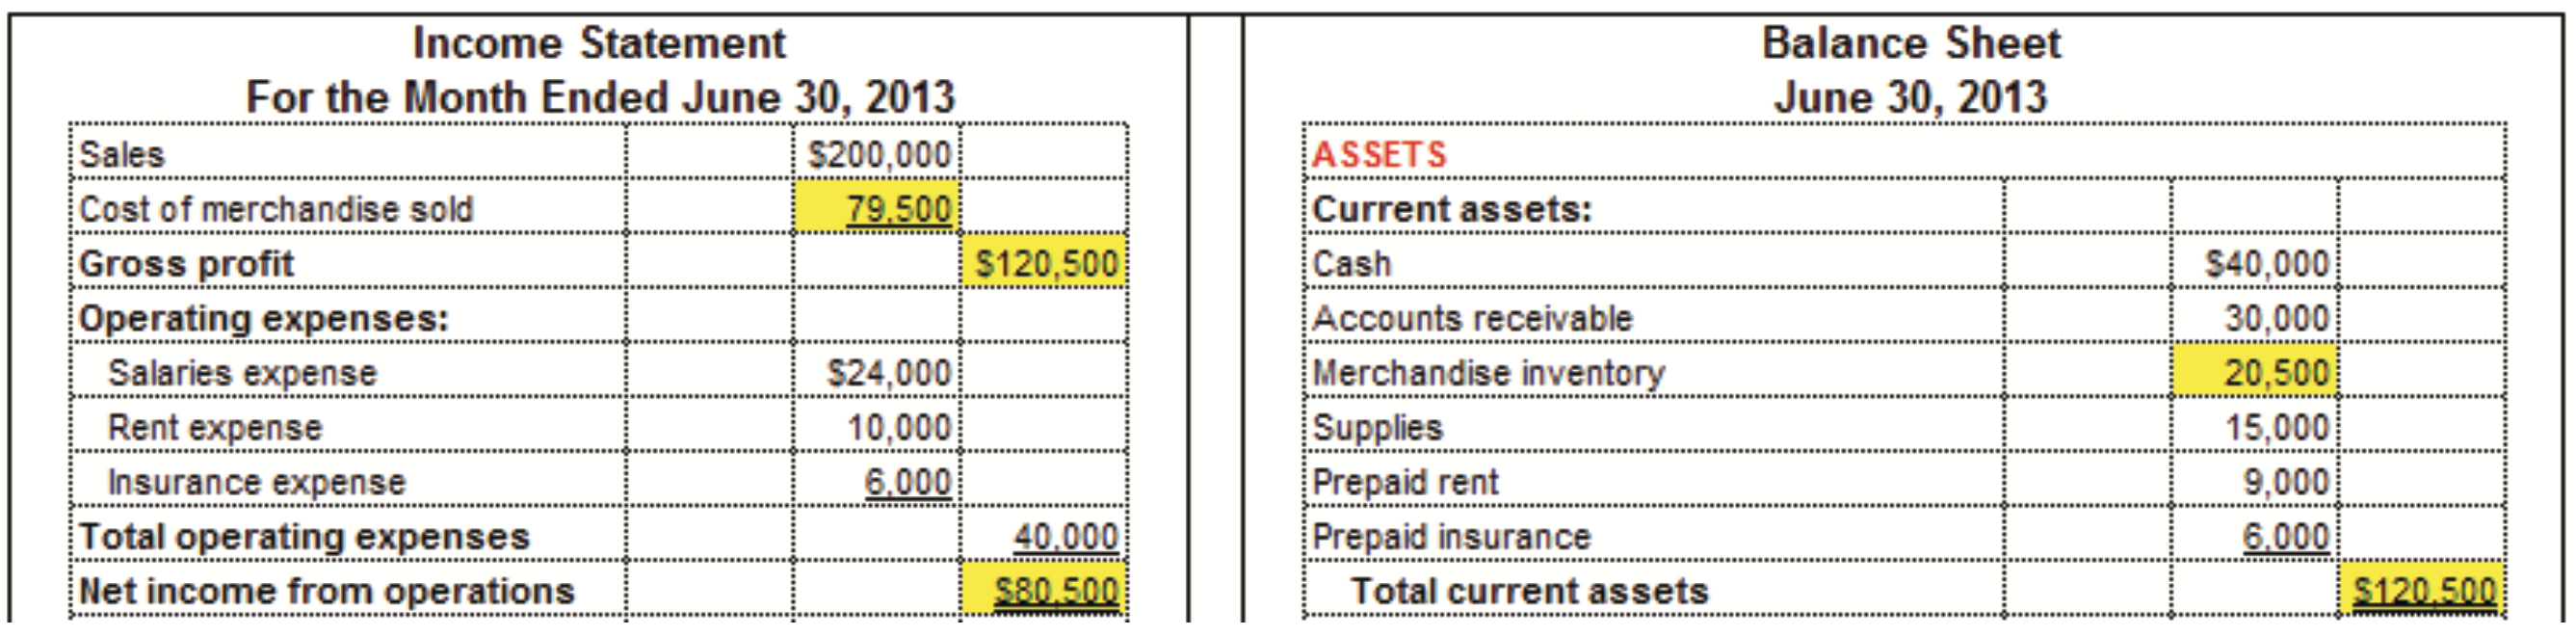
Overstating Merchandise Inventory (reporting an amount that is too high)
The financial statements that follow show the effect of overstating Merchandise Inventory, where something in the physical inventory count was included that should not have been. Instead of $20,000, $20,500 is reported on the balance sheet.
As a result of this error, (1) Merchandise Inventory is overstated, (2) Total assets are overstated, (3) Cost of merchandise sold is understated, (4) Net income is overstated, and (5) Retained earnings and total stockholders’ equity (not shown) are overstated.
| ACCT 2101 Topics—Inventory Valuation | Fact | Journal Entry | Calculate Amount | Format |
| Concept of inventory valuation methods | x | |||
| Calculate cost of merchandise sold under FIFO | x | |||
| Calculate ending inventory under FIFO | x | |||
| Calculate cost of merchandise sold under LIFO | x | |||
| Calculate ending inventory under LIFO | x | |||
| Calculate cost of merchandise sold under average cost method | x | |||
| Calculate ending inventory under average cost method | x | |||
| Journalize purchase of merchandise on account under perpetual system | x | x | ||
| Journalize sale of merchandise on account under perpetual system | x | x | ||
| Calculate gross profit | x | |||
| Calculate lower-of-cost-or-market amounts | x | |||
| Financial statements | x | x | ||
| Physical inventory counts | x | x |