
3.5: Calculate and Interpret a Company’s Margin of Safety and Operating Leverage
- Page ID
- 5197

Our discussion of CVP analysis has focused on the sales necessary to break even or to reach a desired profit, but two other concepts are useful regarding our break-even sales. Those concepts are margin of safety and operating leverage.
Margin of Safety
A company’s margin of safety is the difference between its current sales and its break-even sales. The margin of safety tells the company how much they could lose in sales before the company begins to lose money, or, in other words, before the company falls below the break-even point. The higher the margin of safety is, the lower the risk is of not breaking even or incurring a loss. In order to calculate margin of safety, we use the following formula:
\[\text { Margin of Safety in Dollars }=\text { Total Budgeted (or actual sales) - Break-Even Sales } \]
Let’s look at Manteo Machine, a company that machines parts that are then sold and used in the manufacture of farm equipment. For their core product, the break-even analysis is as follows:
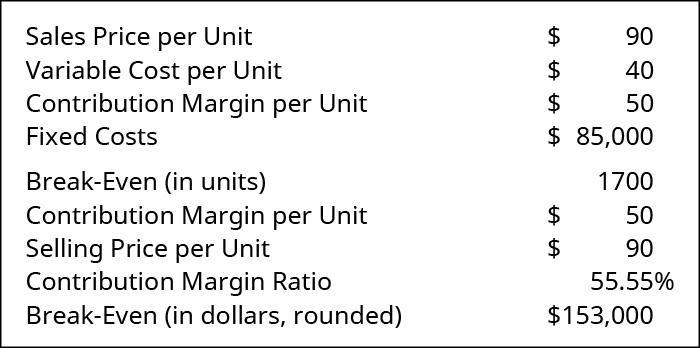
Interpreting this information tells Manteo Machine that, when sales equal \(\$153,000\), they will be at the break-even point. However, as soon as sales fall below this figure, they will have negative net operating income. They have decided that they want a margin of safety of \(\$10,000\). They can add this as if it were a fixed cost (very much the same way we added target profit earlier) and then find a new break-even point that includes a \(\$10,000\) margin of safety. If they approached it from this perspective, their new break-even would appear as follows:
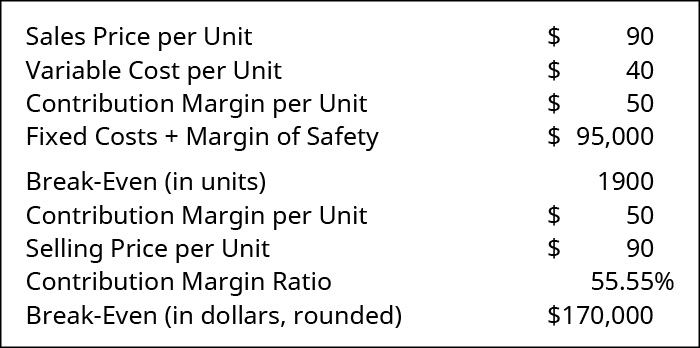
As shown in Figure \(\PageIndex{2}\), the margin of safety of \(1,900\) units is found from (\(\text { (FC + Margin of Safety)/CM per unit }=\$ 95,000 / \$ 50\)). Thus, \(1,900\) units must be sold in order to meet fixed cost and have a \(\$10,000\) margin of safety. Another way to see this is to realize the \(\$10,000\) margin of safety will be met in \(\$50\) increments based on the current contribution margin. This means the company will need to sell an additional \(200\) units, which is an additional \(\$18,000\) in sales to have the desired margin of safety. The true break-even, where only fixed costs were met, was \(1,700\) units, or \(\$153,000\) in sales. The point at which the company would have a \(\$10,000\) margin of safety is \(1,900\) units, or \(\$171,000\) in sales. Note that the new level of units is the break-even units of \(1,700\) plus the \(200\) units for the margin of safety. The same can be seen for the sales dollar. The new level of desired sales dollars is the break-even sales of \(\$153,000\) plus the additional \(\$18,000\) in sales for the margin of safety.
The margin of safety can also be determined when a company knows its sales volume. For example, Manteo Machine sold \(2,500\) units in March and wants to know its margin of safety at that sales volume:
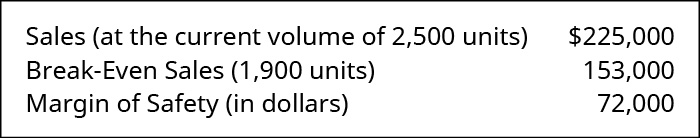
From this analysis, Manteo Machine knows that sales will have to decrease by \(\$72,000\) from their current level before they revert to break-even operations and are at risk to suffer a loss.
Ethical managerial decision-making requires that information be communicated fairly and objectively. The failure to include the demand for individual products in the company's mixture of products may be misleading. Providing misleading or inaccurate managerial accounting information can lead to a company becoming unprofitable. Ignoring relevant range(s) in setting assumptions about cost behavior and ignoring the actual demand for the product in the company's market also distorts the information provided to management and may cause the management of the company to produce products that cannot be sold.
Many companies prefer to consider the margin of safety as a percentage of sales, rather than as a dollar amount. In order to express margin of safety as a percentage, we divide the margin of safety (in dollars) by the total budgeted or actual sales volume. The formula to express margin of safety as a percentage is:
\[\text { Margin of Safety Percentage }=\dfrac{\text { Margin of Safety (dollars) }}{\text { Total Budget (or Actual) Sales (dollars) }} \]
Previously, we calculated Manteo Machine’s margin of safety as \(\$72,000\). As a percentage, it would be
\[\dfrac{\$ 72,000}{\$ 225,000}=0.32 \text { or } 32 \% \nonumber \]
This tells management that as long as sales do not decrease by more than \(32\%\), they will not be operating at or near the break-even point, where they would run a higher risk of suffering a loss. Often, the margin of safety is determined when sales budgets and forecasts are made at the start of the fiscal year and also are regularly revisited during periods of operational and strategic planning.
Operating Leverage
In much the same way that managers control the risk of incurring a net loss by watching their margin of safety, being aware of the company’s operating leverage is critical to the financial well-being of the firm. Operating leverage is a measurement of how sensitive net operating income is to a percentage change in sales dollars. Typically, the higher the level of fixed costs, the higher the level of risk. However, as sales volumes increase, the payoff is typically greater with higher fixed costs than with higher variable costs. In other words, the higher the risk the greater the payoff.
First, let’s look at this from a general example to understand payoff. Suppose you had \(\$10,000\) to invest and you were debating between putting that money in low risk bonds earning \(3\%\) or taking a chance and buying stock in a new company that currently is not profitable but has an innovative product that many analysts predict will take off and be the next “big thing.” Obviously, there is more risk with buying the stock than with buying the bonds. If the company remains unprofitable, or fails, you stand to lose all or a portion of your investment, whereas the bonds are less risky and will continue to pay \(3\%\) interest. However, the risk associated with the stock investment could result in a much higher payoff if the company is successful.
So how does this relate to fixed costs and companies? Companies have many types of fixed costs including salaries, insurance, and depreciation. These costs are present regardless of our production or sales levels. This makes fixed costs riskier than variable costs, which only occur if we produce and sell items or services. As we sell items, we have learned that the contribution margin first goes to meeting fixed costs and then to profits. Here is an example of how changes in fixed costs affects profitability.
Gray Co. has the following income statement:
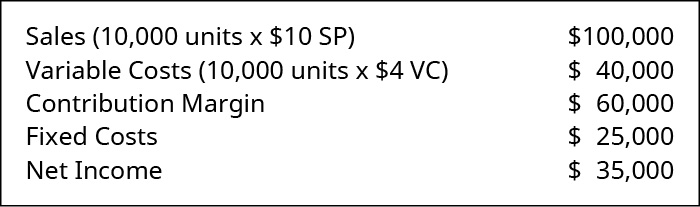
What is the effect of switching \(\$10,000\) of fixed costs to variable costs? What is the effect of switching \(\$10,000\) of variable costs to fixed costs?
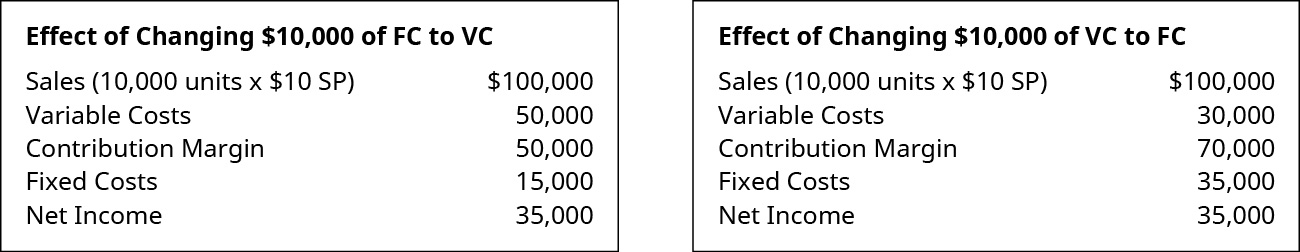
Notice that in this instance, the company’s net income stayed the same. Now, look at the effect on net income of changing fixed to variable costs or variable costs to fixed costs as sales volume increases. Assume sales volume increase by \(10\%\).
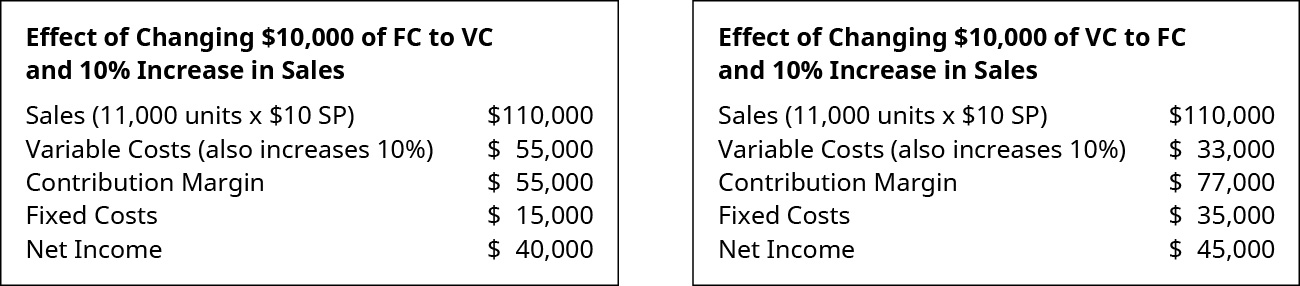
As you can see from this example, moving variable costs to fixed costs, such as making hourly employees salaried, is riskier in that fixed costs are higher. However, the payoff, or resulting net income, is higher as sales volume increases.
This is why companies are so concerned with managing their fixed and variable costs and will sometimes move costs from one category to another to manage this risk. Some examples include, as previously mentioned, moving hourly employees (variable) to salaried employees (fixed), or replacing an employee (variable) with a machine (fixed). Keep in mind that managing this type of risk not only affects operating leverage but can have an effect on morale and corporate climate as well.
Operating leverage fluctuations result from changes in a company’s cost structure. While any change in either variable or fixed costs will change operating leverage, the fluctuations most often result from management’s decision to shift costs from one category to another. As the next example shows, the advantage can be great when there is economic growth (increasing sales); however, the disadvantage can be just as great when there is economic decline (decreasing sales). This is the risk that must be managed when deciding how and when to cause operating leverage to fluctuate.
Consider the impact of reducing variable costs (fewer employee staffed checkout lanes) and increasing fixed costs (more self-service checkout lanes). A store with \(\$125,000,000\) per year in sales installs some self-service checkout lanes. This increases its fixed costs by \(10\%\) but reduces its variable costs by \(5\%\). As Figure \(\PageIndex{7}\) shows, at the current sales level, this could produce a whopping \(35\%\) increase in net operating income. And, if the change results in higher sales, the increase in net operating income would be even more dramatic. Do the math and you will see that each \(1\%\) increase in sales would produce a \(6\%\) increase in net operating income: well worth the change, indeed.
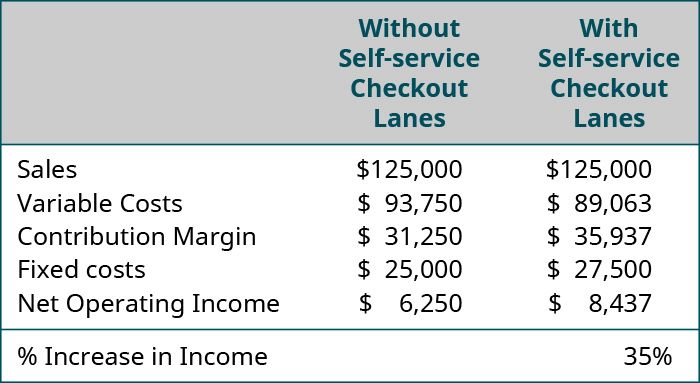
(in \(000\)s) Without Selfservice Checkout Lanes, With Selfservice Checkout Lanes (respectively): Sales \(\$125,000\), \(125,000\); Variable Costs \(93,750\), \(89,063\); Contribution Margin \(31,250\), \(35,938\); Fixed Costs \(25,000\), \(27,500\); Net Operating Income \(6,250 8,438\); Percent Increase in Income \(35\) percent.
The company in this example also faces a downside risk, however. If customers disliked the change enough that sales decreased by more than \(6\%\), net operating income would drop below the original level of \(\$6,250\) and could even become a loss.
Operating leverage has a multiplier effect. A multiplier effect is one in which a change in an input (such as variable cost per unit) by a certain percentage has a greater effect (a higher percentage effect) on the output (such as net income). To explain the concept of a multiplier effect, think of having to open a very large, heavy wooden crate. You could pull and pull with your hands all day and still not exert enough force to get it open. But, what if you used a lever in the form of a pry bar to multiply your effort and strength? For every additional amount of force you apply to the pry bar, a much larger amount of force is applied to the crate. Before you know it, you have the crate open. Operating leverage works much like that pry bar: if operating leverage is high, then a very small increase in sales can result in a large increase in net operating income.
How does a company increase its operating leverage? Operating leverage is a function of cost structure, and companies that have a high proportion of fixed costs in their cost structure have higher operating leverage. There is, however, a cautionary side to operating leverage. Since high operating leverage is the result of high fixed costs, if the market for the company’s products, goods, or services shrinks, or if demand for the company’s products, goods, or services declines, the company may find itself obligated to pay for fixed costs with little or no sales revenue to spare. Managers who have made the decision to chase large increases in net operating income through the use of operating leverage have found that, when market demand falls, their only recourse is to close their doors. In fact, many large companies are making the decision to shift costs away from fixed costs to protect them from this very problem.
During periods of sales downturns, there are many examples of companies working to shift costs away from fixed costs. This Yahoo Finance article reports that many airlines are changing their cost structure to move away from fixed costs and toward variable costs such as Delta Airlines. Although they are decreasing their operating leverage, the decreased risk of insolvency more than makes up for it.
In order to calculate the degree of operating leverage at a given level of sales, we will apply the following formula:
\[\text { Degree of Operating Leverage }=\dfrac{\text { Contribution Margin }}{\text { Net Operating Income }} \]
To explain further the concept of operating leverage, we will look at two companies and their operating leverage positions:
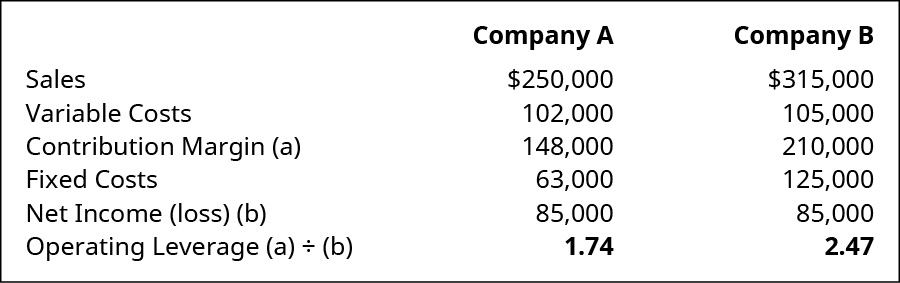
Both companies have the same net income of \(\$85,000\), but company B has a higher degree of operating leverage because its fixed costs are higher than that of company A. If we want to see how operating leverage impacts net operating income, then we can apply the following formula:
\[\text {Degree of percentage Operating Leverage } \times \text { Percentage Change in Sales } = \text { Net Operating Income}\]
Let’s assume that both company A and company B are anticipating a 10% increase in sales. Based on their respective degrees of operating leverage, what will their percentage change in net operating income be?
\[\begin{array}{l}{\text { Company } \mathrm{A}: 1.71 \times 10 \%=17.4 \%} \\ {\text { Company } \mathrm{B}: 2.47 \times 10 \%=24.7 \%}\end{array} \nonumber \]
For company A, for every \(10\%\) increase in sales, net operating income will increase \(17.4\%\). But company B has a much higher degree of operating leverage, and a \(10\%\) increase in sales will result in a \(24.7\%\) increase in net operating income. These examples clearly show why, during periods of growth, companies have been willing to risk incurring higher fixed costs in exchange for large percentage gains in net operating income. But what happens in periods where income declines?
We will return to Company A and Company B, only this time, the data shows that there has been a \(20\%\) decrease in sales. Note that the degree of operating leverage changes for each company. The reduced income resulted in a higher operating leverage, meaning a higher level of risk.
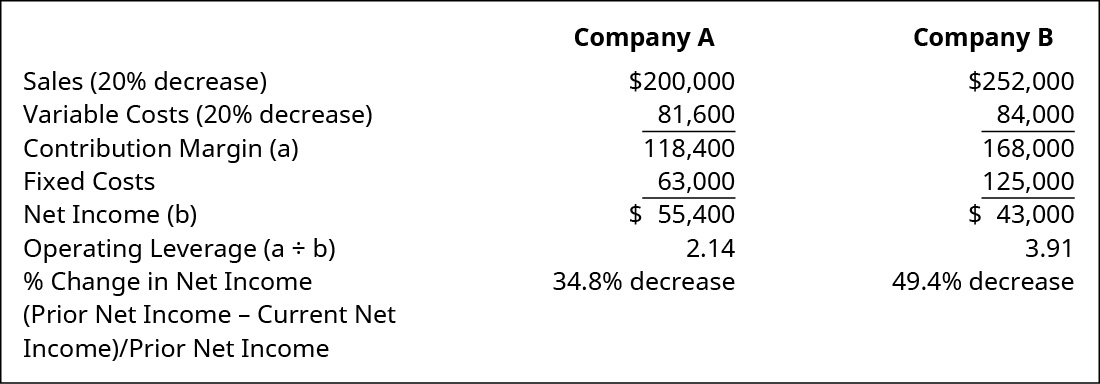
It is equally important to realize the percentage decrease in income for both companies. The decrease in sales by \(20\%\) resulted in a \(31.9\%\) decrease in net income for Company A. For Company B, the \(20\%\) decrease in sales resulted in a \(46.9\%\) decrease in net income. This also could have been found by taking the initial operating leverage times the \(20\%\) decrease:
\[\begin{array}{l}{\text { Company } A: 20 \% \text { decreases } \times 1.74 \text { operating leverage }=34.8 \% \text { decrease in net income }} \\ {\text { Company } B: 20 \% \text { decreases } \times 2.47 \text { operating leverage }=49.4 \% \text { decrease in net income }}\end{array} \nonumber \]
This example also shows why, during periods of decline, companies look for ways to reduce their fixed costs to avoid large percentage reductions in net operating income.
You are the managerial accountant for a large manufacturing firm. The company has sales that are well above its break-even point, but they have historically carried most of their costs as fixed costs. The outlook for the industry you are in is not positive. How could you move more costs away from fixed costs to put the company in a better financial position if the industry does, in fact, take a downturn?
You might wonder why the grocery industry is not comparable to other big-box retailers such as hardware or large sporting goods stores. Just like other big-box retailers, the grocery industry has a similar product mix, carrying a vast of number of name brands as well as house brands. The main difference, then, is that the profit margin per dollar of sales (i.e., profitability) is smaller than the typical big-box retailer. Also, the inventory turnover and degree of product spoilage is greater for grocery stores. Overall, while the fixed and variable costs are similar to other big-box retailers, a grocery store must sell vast quantities in order to create enough revenue to cover those costs.
This is reflected in the business plan. Unlike a manufacturer, a grocery store will have hundreds of products at one time with various levels of margin, all of which will be taken into account in the development of their break-even analysis. Review a business plan developed by Viking Grocery Stores in consideration of opening a new site in Springfield, Missouri to see how a grocery store develops a business plan and break-even based upon multiple products.