
12.4: Common-Size Financial Statements
- Page ID
- 26134
Analysts also use vertical analysis of a single financial statement, such as an income statement. Vertical analysis consists of the study of a single financial statement in which each item is expressed as a percentage of a significant total. Vertical analysis is especially helpful in analyzing income statement data such as the percentage of cost of goods sold to sales. Where horizontal analysis looked at one account at a time, vertical analysis will look at one YEAR at a time.
Financial statements that show only percentages and no absolute dollar amounts are common-size statements. All percentage figures in a common-size balance sheet are percentages of total assets while all the items in a common-size income statement are percentages of net sales. The use of common-size statements facilitates vertical analysis of a company’s financial statements.
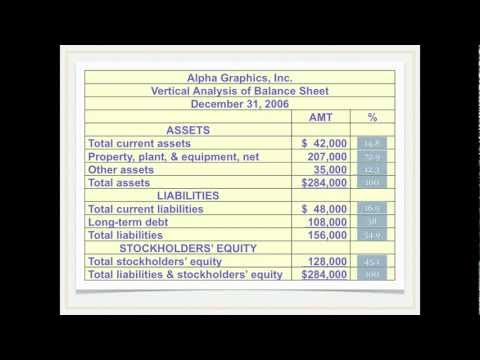
A YouTube element has been excluded from this version of the text. You can view it online here: pb.libretexts.org/llmanagerialaccounting/?p=268
The calculation for common-size percentages is: (Amount / Base amount) and multiply by 100 to get a percentage. Remember, on the balance sheet the base is total assets and on the income statement the base is net sales. The video showed an example using the balance sheet so we will look at Synotech, Inc.’s income statement with common-size percentages (calculations provided in last column).
| Synotech, Inc. | |||
| Income Statement | |||
| For year ended December 31 | |||
| Net Sales | $10,498.8 | 100.0% | ( 10,498.8 |
| 10,498.8 ) | |||
| Cost of goods sold | 5,341.3 | 50.9% | ( 5,341.3 |
| 10,498.8 ) | |||
| Gross profit | 5,157.5 | 49.1% | ( 5,157.5 |
| 10,498.8 ) | |||
| Selling, general and admin expenses | 3,662.5 | 34.9% | ( 3,662.5 |
| 10,498.8 ) | |||
| Other expense, net | 112.6 | 1.1% | ( 112.6 |
| 10,498.8 ) | |||
| Interest expense | 236.9 | 2.3% | ( 236.9 |
| 10,498.8 ) | |||
| Income before taxes | 1145.5 | 10.9% | ( 1,145.5 |
| 10,498.8 ) | |||
| Income tax expense | 383.5 | 3.7% | ( 383.5 |
| 10,498.8 ) | |||
| Net Income | 762 | 7.3% | ( 762 |
| 10,498.8 ) | |||
What does this common-size percentage tell you about the company? Since we use net sales as the base on the income statement, it tells us how every dollar of net sales is spent by the company. For Synotech, Inc., approximately 51 cents of every sales dollar is used by cost of goods sold and 49 cents of every sales dollar is left in gross profit to cover remaining expenses. Of the 49 cents remaining, almost 35 cents is used by operating expenses (selling, general and administrative), 1 cent by other and 2 cents in interest. We earn almost 11 cents of net income before taxes and over 7 cents in net income after taxes on every sales dollar. This is a little easier to understand than the larger numbers showing Synotech earned $762 million dollars.
The same process would apply on the balance sheet but the base is total assets. The common-size percentages on the balance sheet explain how our assets are allocated OR how much of every dollar in assets we owe to others (liabilities) and to owners (equity). Many computerized accounting systems automatically calculate common-size percentages on financial statements.
- Accounting Principles: A Business Perspective. Authored by: James Don Edwards, University of Georgia & Roger H. Hermanson, Georgia State University. Provided by: Endeavour International Corporation. Project: The Global Text Project. License: CC BY: Attribution
- Financial Statement Analysis: Vertical Analysis - Financial Accounting video . Authored by: Brian Routh TheAccountingDr. Located at: youtu.be/OT1BVZPNfks. License: All Rights Reserved. License Terms: Standard YouTube License