
18.6: Ratios That Analyze a Company’s Earnings Performance
- Page ID
- 26299
Equity, or long-term solvency, ratios show the relationship between debt and equity financing in a company.
Equity (stockholders’ equity) ratio The two basic sources of assets in a business are owners (stockholders) and creditors; the combined interests of the two groups are total equities. In ratio analysis, however, the term equity generally refers only to stockholders’ equity. Thus, the equity (stockholders’ equity) ratio indicates the proportion of total assets (or total liabilities and equity) provided by stockholders (owners) on any given date. The formula for the equity ratio is:
| Total Stockholder’s Equity |
| Total Assets (or Total Liabilities & Equity) |
Notice how we can use either Total Assests or Total Liabilities and Equity as the denominator, why? Because of the accounting equation — Assets = Liabilities + Equity. This calculation should look familiar as this is the same calculation we would have done in a vertical analysis (common-size percentages). Synotech’s liabilities and stockholders’ equity follow. The company’s equity ratio increased from 22.0% in 20Y4 to 25.7% in 20Y5. The information below shows that stockholders increased their proportionate equity in the company’s assets due largely to the retention of earnings (which increases retained earnings).
| 20Y5 December 31 | 20Y4 December 31 | |||
| (USD millions) | Amount | % | Amount | % |
| Current liabilities | $2,285.2 | 24.1% | $2,103.8 | 22.9% |
| Long-term liabilities | 4,755.8 | 50.2 | 5,051.3 | 55.1 |
| Total liabilities | $7,041.0 | 74.3 | $7,155.1 | 78.0 |
| Total stockholders’ equity | 2,440.8 | 25.7 | 2,015.7 | 22.0 |
| Total liabilities & equity (equal to total assets) | $9,481.8 | 100% | $9,170.8 | 100.0% |
The equity ratio must be interpreted carefully. From a creditor’s point of view, a high proportion of stockholders’ equity is desirable. A high equity ratio indicates the existence of a large protective buffer for creditors in the event a company suffers a loss. However, from an owner’s point of view, a high proportion of stockholders’ equity may or may not be desirable. If the business can use borrowed funds to generate income in excess of the net after-tax cost of the interest on such funds, a lower percentage of stockholders’ equity may be desirable.
We should point out, however, that too low a percentage of stockholders’ equity (too much debt) has its dangers. Financial leverage magnifies losses per share as well as Earnings Per Share (EPS) since there are fewer shares of stock over which to spread the losses. A period of business recession may result in operating losses and shrinkage in the value of assets, such as receivables and inventory, which in turn may lead to an inability to meet fixed payments for interest and principal on the debt. As a result, the company may be forced into liquidation, and the stockholders could lose their entire investments.
Stockholders’ equity to debt (debt to equity) ratio Analysts express the relative equities of owners and creditors in several ways. To say that creditors held a 74.3% interest in the assets of Synotech (remember the debt ratio from the previous section?) on 20Y5 December 31, is equivalent to saying stockholders held a 25.7% interest. Another way of expressing this relationship is the stockholders’ equity to debt ratio:
| Total Stockholder’s Equity |
| Total Liabilities |
Such a ratio for Synotech would be 0.28:1 (or $2,015.7 million/$7,155.1 million) on 20Y4 December 31, and 0.35:1 (or $2,440.8 million/$7,041.0 million) on 20Y5 December 31. This ratio is often inverted and called the debt to equity ratio. Some analysts use only long-term debt rather than total debt in calculating these ratios. These analysts do not consider short-term debt to be part of the capital structure since it is paid within one year.
Profitability is an important measure of a company’s operating success. Generally, we are concerned with two areas when judging profitability: (1) relationships on the income statement that indicate a company’s ability to recover costs and expenses, and (2) relationships of income to various balance sheet measures that indicate the company’s relative ability to earn income on assets employed. Each of the following ratios utilizes one of these relationships.
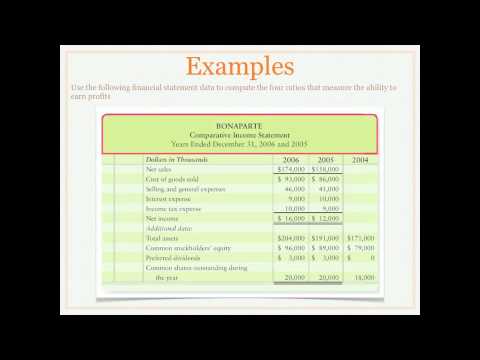
A YouTube element has been excluded from this version of the text. You can view it online here: pb.libretexts.org/llfinancialaccounting/?p=318
Return on average common stockholders’ equity From the stockholders’ point of view, an important measure of the income-producing ability of a company is the relationship of return on average common stockholders’ equity, also called rate of return on average common stockholders’ equity, or simply the return on equity (ROE). Although stockholders are interested in the ratio of operating income to operating assets as a measure of management’s efficient use of assets, they are even more interested in the return the company earns on each dollar of stockholders’ equity. The formula for return on average common stockholders’ equity if no preferred stock is outstanding is:
| Net Income – preferred dividends |
| AVERAGE common stockholder’s equity |
When a company has preferred stock outstanding, the numerator of this ratio becomes net income minus the annual preferred dividends. Synotech has preferred stock outstanding. The ratios for the company follow. Total common stockholders’ equity on January 1 was $ 1,531.5 million and on December 31 $1,969.6. Net income for the year was $762 million and preferred dividends were $25.7 million. NOTE: Common stockholder’s equity is Total stockholder’s equity – par value of preferred stock. We calculate average common stockholders equity by taking Jan 1 $1,531.50 + Dec 31 $1,969.60 and dividing by 2 to get $1,750.55 million. The return on average stockholder’s equity calculation would be:
| Net Income – preferred dividends = | $ 762 – $25.7 |
| AVERAGE common stockholder’s equity | $1,750.55 |
The ratio would be 42.06% which indicates that for each dollar of capital invested by a common stockholder, the company earned approximately 42 cents.
Earnings per share of common stock Probably the measure used most widely to appraise a company’s operations is earnings per share (EPS) of common stock. The formula for EPS is:| Earnings available to common stockholders |
| weighted average common shares outstanding |
The calculation of EPS may be fairly simple or highly complex depending on a corporation’s capital structure. A company has a simple capital structure if it has no outstanding securities (e.g. convertible bonds, convertible preferred stocks, warrants, or options) that can be exchanged for common stock. If a company has such securities outstanding, it has a complex capital structure. Discussion of EPS for a corporation with a complex capital structure is beyond the scope of this text.
The amount of earnings available to common stockholders is equal to net income minus the current year’s preferred dividends, whether such dividends have been declared or not.
Determining the weighted-average number of common shares The denominator in the EPS fraction is the weighted-average number of common shares outstanding for the period. If the number of common shares outstanding did not change during the period, the weighted-average number of common shares outstanding would, of course, be the number of common shares outstanding at the end of the period.
To illustrate, the balance in the Common Stock account of Synotech is $219.9 million on December 31. The common stock had a $1.20 par value. Assuming no common shares were issued or redeemed during the year, the weighted-average number of common shares outstanding would be 183.2 million (or $219.9 million common stock account balance /$1.20 par value per share). (Normally, common treasury stock reacquired and reissued are also included in the calculation of the weighted-average number of common shares outstanding. We ignore treasury stock transactions to simplify the illustrations.) The EPS in this example would be $4.02 per share calculated as:
| Earnings available to common stockholders = | Net Income – preferred dividends = | $762 – $25.7 = | 736.3 |
| weighted average common shares outstanding | Common stock account balance / par value | $219.9 / $1.20 | 183.25 shares |
If the number of common shares changed during the period, such a change increases or decreases the capital invested in the company and should affect earnings available to stockholders. To compute the weighted-average number of common shares outstanding, we weight the change in the number of common shares by the portion of the year that those shares were outstanding. Shares are outstanding only during those periods that the related capital investment is available to produce income.
To illustrate, assume that during Synotech’s began the year with 171.5 million shares outstanding. Assume that the company issued 9.5 million shares on April 1, and 2.2 million shares on October 1. The computation of the weighted-average number of common shares outstanding would be:
| 171.5 million shares x 1 year | 171.500 million |
| 9.5 million shares x ¾ year (April – December or 9/12) | 7.125 million |
| 2.2 million shares x ¼ year (October – December or 3/12) | 0.550 |
| Weighted-average number of common shares outstanding | 179.175 million |
The EPS in this example would be $4.11 per share calculated as:
| Earnings available to common stockholders = | Net Income – preferred dividends = | $ 762 – $25.7 = | 736.3 |
| weighted average common shares outstanding | 171.5 + 7.125 + 0.55 | 179.175 shares | 179.18 |
EPS and stock dividends or splits Increases in shares outstanding as a result of a stock dividend or stock split do not require weighting for fractional periods. Such shares do not increase the capital invested in the business and, therefore, do not affect income. All that is required is to restate all prior calculations of EPS using the increased number of shares. For example, assume a company reported EPS for the year as $1.20 (or $120,000/100,000 shares) and earned $120,000 of net income during the year. The only change in common stock was a two-for-one stock split on December 1, which doubled the shares outstanding to 200,000. The firm would restate EPS as $0.60 (or $120,000/200,000 shares).
A YouTube element has been excluded from this version of the text. You can view it online here: pb.libretexts.org/llfinancialaccounting/?p=318
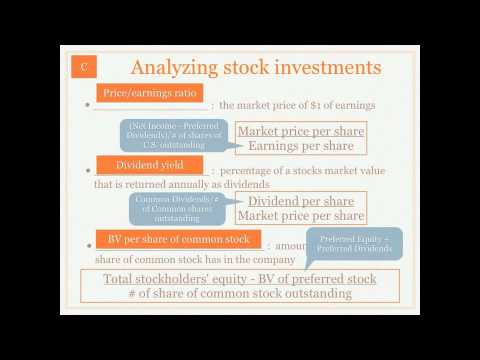
Price-earnings ratio The price-earnings ratiomeasures the value of the stock in relation to its selling or market price typically on the New York Stock Exchange. The formula to compute the price-earnings ratio is:
| Market price per common share |
| Earnings per share |
Assume Synotech has common stock with an EPS of $5.03 and that the quoted market price of the stock on the New York Stock Exchange is $110.70. Investors would say that this stock is selling at 22 times earnings, or at a multiple of 22 calculated as:
| Market price per common share = | $110.70 |
| Earnings per share | $5.03 |
These investors might have a specific multiple in mind that indicates whether the stock is underpriced or overpriced. Different investors have different estimates of the proper price-earnings ratio for a given stock and also different estimates of the future earnings prospects of the company. These different estimates may cause one investor to sell stock at a particular price and another investor to buy at that price.
Dividend yield on common stock The dividend paid per share of common stock is also of much interest to common stockholders. The dividend yield on common stockis calculated as:
| Annual cash dividend per share |
| Market price per share |
For example, Synotech’s December 31 common stock market price was $110.70 per share. Synotech paid cash dividends per share of $1.80. The company’s dividend yield on common stock is 1.6% calculated as:
| Annual cash dividend per share = | $1.80 |
| Market price per share | $110.70 |
The dividend yield tells investors the company pays 1.6% of the market price in cash dividends. Through the use of dividend yield rates, we can compare different stocks having different annual dividends and different market prices.
Final considerations in financial statement analysis
Standing alone, a single financial ratio may not be informative. Investors gain greater insight by computing and analyzing several related ratios for a company. Financial analysis relies heavily on informed judgment. As guides to aid comparison, percentages and ratios are useful in uncovering potential strengths and weaknesses. However, the financial analyst should seek the basic causes behind changes and established trends.
Analysts must be sure that their comparisons are valid—especially when the comparisons are of items for different periods or different companies. They must follow consistent accounting practices if valid interperiod comparisons are to be made. Comparable intercompany comparisons are more difficult to secure. Accountants cannot do much more than disclose the fact that one company is using FIFO and another is using LIFO for inventory and cost of goods sold computations. Such a disclosure alerts analysts that intercompany comparisons of inventory turnover ratios, for example, may not be comparable.
Also, when comparing a company’s ratios to industry averages provided by an external source such as Dun & Bradstreet, the analyst should calculate the company’s ratios in the same manner as the reporting service. Thus, if Dun & Bradstreet uses net sales (rather than cost of goods sold) to compute inventory turnover, so should the analyst. Net sales is sometimes preferable because all companies do not compute and report cost of goods sold amounts in the same manner.
Facts and conditions not disclosed by the financial statements may, however, affect their interpretation. A single important event may have been largely responsible for a given relationship. For example, competitors may put a new product on the market, making it necessary for the company under study to reduce the selling price of a product suddenly rendered obsolete. Such an event would severely affect the percentage of gross margin to net sales. Yet there may be little chance that such an event will happen again.
Analysts must consider general business conditions within the industry of the company under study. A corporation’s downward trend in earnings, for example, is less alarming if the industry trend or the general economic trend is also downward.
Investors also need to consider the seasonal nature of some businesses. If the balance sheet date represents the seasonal peak in the volume of business, for example, the ratio of current assets to current liabilities may be much lower than if the balance sheet date is in a season of low activity.
Potential investors should consider the market risk associated with the prospective investment. They can determine market risk by comparing the changes in the price of a stock in relation to the changes in the average price of all stocks.
Potential investors should realize that acquiring the ability to make informed judgments is a long process and does not occur overnight. Using ratios and percentages without considering the underlying causes may lead to incorrect conclusions.
Relationships between financial statement items also become more meaningful when standards are available for comparison. Comparisons with standards provide a starting point for the analyst’s thinking and lead to further investigation and, ultimately, to conclusions and business decisions. Such standards consist of (1) those in the analyst’s own mind as a result of experience and observations, (2) those provided by the records of past performance and financial position of the business under study, and (3) those provided about other enterprises. Examples of the third standard are data available through trade associations, universities, research organizations (such as Dun & Bradstreet and Robert Morris Associates), and governmental units (such as the Federal Trade Commission).
In financial statement analysis, remember that standards for comparison vary by industry, and financial analysis must be carried out with knowledge of specific industry characteristics. For example, a wholesale grocery company would have large inventories available to be shipped to retailers and a relatively small investment in property, plant, and equipment, while an electric utility company would have no merchandise inventory (except for repair parts) and a large investment in property, plant, and equipment.
Even within an industry, variations may exist. Acceptable current ratios, gross margin percentages, debt to equity ratios, and other relationships vary widely depending on unique conditions within an industry. Therefore, it is important to know the industry to make comparisons that have real meaning.
- Accounting Principles: A Business Perspective. Authored by: James Don Edwards, University of Georgia & Roger H. Hermanson, Georgia State University. Provided by: Endeavour International Corporation. Project: The Global Text Project . License: CC BY: Attribution
- Financial Statement Analysis: Measuring Profitability, cont'd - Accounting video . Authored by: BrianRouth TheAccountingDr. Located at: youtu.be/aEZWbQznr_U. License: All Rights Reserved. License Terms: Standard YouTube License
- Financial Statement Analysis: Analyzing Stock Investments - Accounting video . Authored by: Brian Routh TheAccountingDr. Located at: youtu.be/hDR7fRKwXu8. License: All Rights Reserved. License Terms: Standard YouTube License