
13.4: Ratio Analysis of Financial Information
- Page ID
- 918
\( \newcommand{\vecs}[1]{\overset { \scriptstyle \rightharpoonup} {\mathbf{#1}} } \)
\( \newcommand{\vecd}[1]{\overset{-\!-\!\rightharpoonup}{\vphantom{a}\smash {#1}}} \)
\( \newcommand{\dsum}{\displaystyle\sum\limits} \)
\( \newcommand{\dint}{\displaystyle\int\limits} \)
\( \newcommand{\dlim}{\displaystyle\lim\limits} \)
\( \newcommand{\id}{\mathrm{id}}\) \( \newcommand{\Span}{\mathrm{span}}\)
( \newcommand{\kernel}{\mathrm{null}\,}\) \( \newcommand{\range}{\mathrm{range}\,}\)
\( \newcommand{\RealPart}{\mathrm{Re}}\) \( \newcommand{\ImaginaryPart}{\mathrm{Im}}\)
\( \newcommand{\Argument}{\mathrm{Arg}}\) \( \newcommand{\norm}[1]{\| #1 \|}\)
\( \newcommand{\inner}[2]{\langle #1, #2 \rangle}\)
\( \newcommand{\Span}{\mathrm{span}}\)
\( \newcommand{\id}{\mathrm{id}}\)
\( \newcommand{\Span}{\mathrm{span}}\)
\( \newcommand{\kernel}{\mathrm{null}\,}\)
\( \newcommand{\range}{\mathrm{range}\,}\)
\( \newcommand{\RealPart}{\mathrm{Re}}\)
\( \newcommand{\ImaginaryPart}{\mathrm{Im}}\)
\( \newcommand{\Argument}{\mathrm{Arg}}\)
\( \newcommand{\norm}[1]{\| #1 \|}\)
\( \newcommand{\inner}[2]{\langle #1, #2 \rangle}\)
\( \newcommand{\Span}{\mathrm{span}}\) \( \newcommand{\AA}{\unicode[.8,0]{x212B}}\)
\( \newcommand{\vectorA}[1]{\vec{#1}} % arrow\)
\( \newcommand{\vectorAt}[1]{\vec{\text{#1}}} % arrow\)
\( \newcommand{\vectorB}[1]{\overset { \scriptstyle \rightharpoonup} {\mathbf{#1}} } \)
\( \newcommand{\vectorC}[1]{\textbf{#1}} \)
\( \newcommand{\vectorD}[1]{\overrightarrow{#1}} \)
\( \newcommand{\vectorDt}[1]{\overrightarrow{\text{#1}}} \)
\( \newcommand{\vectE}[1]{\overset{-\!-\!\rightharpoonup}{\vphantom{a}\smash{\mathbf {#1}}}} \)
\( \newcommand{\vecs}[1]{\overset { \scriptstyle \rightharpoonup} {\mathbf{#1}} } \)
\(\newcommand{\longvect}{\overrightarrow}\)
\( \newcommand{\vecd}[1]{\overset{-\!-\!\rightharpoonup}{\vphantom{a}\smash {#1}}} \)
\(\newcommand{\avec}{\mathbf a}\) \(\newcommand{\bvec}{\mathbf b}\) \(\newcommand{\cvec}{\mathbf c}\) \(\newcommand{\dvec}{\mathbf d}\) \(\newcommand{\dtil}{\widetilde{\mathbf d}}\) \(\newcommand{\evec}{\mathbf e}\) \(\newcommand{\fvec}{\mathbf f}\) \(\newcommand{\nvec}{\mathbf n}\) \(\newcommand{\pvec}{\mathbf p}\) \(\newcommand{\qvec}{\mathbf q}\) \(\newcommand{\svec}{\mathbf s}\) \(\newcommand{\tvec}{\mathbf t}\) \(\newcommand{\uvec}{\mathbf u}\) \(\newcommand{\vvec}{\mathbf v}\) \(\newcommand{\wvec}{\mathbf w}\) \(\newcommand{\xvec}{\mathbf x}\) \(\newcommand{\yvec}{\mathbf y}\) \(\newcommand{\zvec}{\mathbf z}\) \(\newcommand{\rvec}{\mathbf r}\) \(\newcommand{\mvec}{\mathbf m}\) \(\newcommand{\zerovec}{\mathbf 0}\) \(\newcommand{\onevec}{\mathbf 1}\) \(\newcommand{\real}{\mathbb R}\) \(\newcommand{\twovec}[2]{\left[\begin{array}{r}#1 \\ #2 \end{array}\right]}\) \(\newcommand{\ctwovec}[2]{\left[\begin{array}{c}#1 \\ #2 \end{array}\right]}\) \(\newcommand{\threevec}[3]{\left[\begin{array}{r}#1 \\ #2 \\ #3 \end{array}\right]}\) \(\newcommand{\cthreevec}[3]{\left[\begin{array}{c}#1 \\ #2 \\ #3 \end{array}\right]}\) \(\newcommand{\fourvec}[4]{\left[\begin{array}{r}#1 \\ #2 \\ #3 \\ #4 \end{array}\right]}\) \(\newcommand{\cfourvec}[4]{\left[\begin{array}{c}#1 \\ #2 \\ #3 \\ #4 \end{array}\right]}\) \(\newcommand{\fivevec}[5]{\left[\begin{array}{r}#1 \\ #2 \\ #3 \\ #4 \\ #5 \\ \end{array}\right]}\) \(\newcommand{\cfivevec}[5]{\left[\begin{array}{c}#1 \\ #2 \\ #3 \\ #4 \\ #5 \\ \end{array}\right]}\) \(\newcommand{\mattwo}[4]{\left[\begin{array}{rr}#1 \amp #2 \\ #3 \amp #4 \\ \end{array}\right]}\) \(\newcommand{\laspan}[1]{\text{Span}\{#1\}}\) \(\newcommand{\bcal}{\cal B}\) \(\newcommand{\ccal}{\cal C}\) \(\newcommand{\scal}{\cal S}\) \(\newcommand{\wcal}{\cal W}\) \(\newcommand{\ecal}{\cal E}\) \(\newcommand{\coords}[2]{\left\{#1\right\}_{#2}}\) \(\newcommand{\gray}[1]{\color{gray}{#1}}\) \(\newcommand{\lgray}[1]{\color{lightgray}{#1}}\) \(\newcommand{\rank}{\operatorname{rank}}\) \(\newcommand{\row}{\text{Row}}\) \(\newcommand{\col}{\text{Col}}\) \(\renewcommand{\row}{\text{Row}}\) \(\newcommand{\nul}{\text{Nul}}\) \(\newcommand{\var}{\text{Var}}\) \(\newcommand{\corr}{\text{corr}}\) \(\newcommand{\len}[1]{\left|#1\right|}\) \(\newcommand{\bbar}{\overline{\bvec}}\) \(\newcommand{\bhat}{\widehat{\bvec}}\) \(\newcommand{\bperp}{\bvec^\perp}\) \(\newcommand{\xhat}{\widehat{\xvec}}\) \(\newcommand{\vhat}{\widehat{\vvec}}\) \(\newcommand{\uhat}{\widehat{\uvec}}\) \(\newcommand{\what}{\widehat{\wvec}}\) \(\newcommand{\Sighat}{\widehat{\Sigma}}\) \(\newcommand{\lt}{<}\) \(\newcommand{\gt}{>}\) \(\newcommand{\amp}{&}\) \(\definecolor{fillinmathshade}{gray}{0.9}\)- Use ratio analysis to measure profitability, short-term liquidity, long-term solvency, and market valuation.
Question: Although reviewing trends and using common-size analysis provides an excellent starting point for analyzing financial information, managers, investors, and other stakeholders also use various ratios to assess the financial performance and financial condition of organizations. What are the four categories of ratios used to evaluate the financial health of an organization?
Answer: The four categories of ratios presented in this chapter are as follows (in order of presentation):
- Ratios used to measure profitability (focus is on the income statement)
- Ratios used to measure short-term liquidity (focus is on short-term liabilities)
- Ratios used to measure long-term solvency (focus is on long-term liabilities)
- Ratios used to measure market valuation (focus is on market value of the company)
For each ratio, we (1) explain the meaning, (2) provide the formula, (3) calculate the ratio for Coca-Cola for two years, and (4) compare the ratio for Coca-Cola to PepsiCo’s ratio and industry averages. (Note: All industry averages throughout this chapter were obtained from http://moneycentral.msn.com. Some averages are not available or not applicable and will be noted as such.)
Table 13.1 summarizes the formulas for all the ratios presented in this section, and Table 13.2 shows the ratio results for Coca-Cola, PepsiCo, and the industry averages that will be covered throughout this section.
Table 13.1 Financial Ratio Formulas
| Profitability Measures |
|
| Short-Term Liquidity Measures |
|
| Long-Term Solvency Measures |
|
| Market Valuation Measures |
|
Table 13.2 Summary of Financial Ratios for Coca-Cola, PepsiCo, and the Industry Average
| Coca-Cola 2010 | PepsiCo 2010 | Industry Average 2010 | ||
|---|---|---|---|---|
| Profitability Measures | ||||
| 1. | Gross margin ratio | 63.9 percent | 54.1 percent | 56.1 percent |
| 2. | Profit margin ratio | 33.6 percent | 10.9 percent | 19.2 percent |
| 3. | Return on assets | 19.4 percent | 11.7 percent | 14.2 percent |
| 4. | Return on common shareholders’ equity | 41.7 percent | 32.3 percent | 34.7 percent |
| 5. | Earnings per share | $5.12 | $3.97 | Not applicable |
| Short-Term Liquidity Measures | ||||
| 6. | Current ratio | 1.17 to 1 | 1.11 to 1 | 1.20 to 1 |
| 7. | Quick ratio | 0.85 to 1 | 0.80 to 1 | 1.10 to 1 |
| 8. | Receivables turnover ratio | 8.58 times | 10.57 times | 9.70 times |
| 9. | Average collection period | 42.54 days | 34.53 days | 37.63 days |
| 10. | Inventory turnover ratio | 5.07 times | 8.87 times | 7.50 times |
| 11. | Average sale period | 71.99 days | 41.15 days | 48.67 days |
| Long-Term Solvency Measures | ||||
| 12. | Debt to assets | 0.57 to 1 | 0.68 to 1 | 0.48 to 1 |
| 13. | Debt to equity | 1.33 to 1 | 2.17 to 1 | 0.94 to 1 |
| 14. | Times interest earned | 20.36 times | 10.10 times | 10.70 times |
| Market Valuation Measures | ||||
| 15. | Market capitalization | $146,500,000,000 | $100,700,000,000 | $87,500,000,000 |
| 16. | Price-earnings ratio | 12.48 times | 16.04 times | 14.60 times |
Before we discuss the various ratios, it is important to note that different terms are often used in financial statements to describe the same item. For example, some companies use the term net revenues instead of net sales, and the income statement is often called the statement of earnings, or consolidated statement of earnings. Also be sure to review the income statement and balance sheet information for Coca-Cola shown in Figure 13.5 and Figure 13.6. We refer to these figures throughout this section. (All the dollar amounts given for Coca-Cola are in millions unless stated otherwise.)
Profitability Ratios
Question: Analysts, shareholders, suppliers, and other stakeholders often want to evaluate profit trends within a company and compare a company’s profits with competitors’ profits. What are the five common ratios used to evaluate company profitability?
Answer: The five ratios used to evaluate profitability are as follows:
- Gross margin ratio
- Profit margin ratio
- Return on assets
- Return on common shareholders’ equity
- Earnings per share
Gross Margin Ratio
Question: How is the gross margin ratio calculated, and what does it tell us about Coca-Cola relative to PepsiCo and the industry average?
Answer: The gross margin ratio indicates the gross margin generated for each dollar in net sales and is calculated as gross margin (which is net sales minus cost of goods sold) divided by net sales:
Key Equation
The gross margin ratio for Coca-Cola using 2010 information is calculated as follows, with PepsiCo and industry average information following it:
| Coca-Cola 2010 | Coca-Cola 2009 | PepsiCo 2010 | Industry Average 2010 | |
| Gross margin ratio | 63.9 percent | 64.2 percent | 54.1 percent | 56.1 percent |
The gross margin ratio indicates Coca-Cola generated 63.9 cents in gross margin for every dollar in net sales. This ratio decreased slightly from 2009 to 2010 and is substantially higher than PepsiCo’s 54.1 percent. Coca-Cola is also higher than the industry average of 56.1 percent. (Alternative terms: Gross margin is often called gross profit, net sales is often called net revenues, and cost of goods sold is often called cost of sales.)
Profit Margin Ratio
Question: How is the profit margin ratio calculated, and what does it tell us about Coca-Cola relative to PepsiCo and the industry average?
Answer: The profit margin ratio shows the profit generated for each dollar in net sales. It is calculated as net income divided by net sales:
Key Equation
The profit margin ratio for Coca-Cola using 2010 information is calculated as follows, with PepsiCo and industry average information following it:
| Coca-Cola 2010 | Coca-Cola 2009 | PepsiCo 2010 | Industry Average 2010 | |
| Profit margin ratio | 33.6 percent | 22.0 percent | 10.9 percent | 19.2 percent |
The profit margin ratio indicates Coca-Cola generated 33.6 cents in net income for every dollar in net sales. This ratio increased significantly from 2009 to 2010 and is substantially higher than PepsiCo’s 10.9 percent. Coca-Cola is also higher than the industry average of 19.2 percent. (Alternative term: Net income is often called net earnings.)
Return on Assets
Question: The gross margin ratio and profit margin ratio focus solely on income statement information. Analysts also want to know what size asset base generated the net income. For example, a company with assets of $100,000 and net income of $15,000 is likely performing better than a company with assets of $300,000 and identical net income of $15,000. A measure that considers the assets required to generate net income is called return on assets. How is return on assets calculated, and what does it tell us about Coca-Cola relative to PepsiCo and the industry average?
Answer: The return on assets ratio is used to evaluate how much net income was generated from each dollar in average assets invested. Return on assets is net income divided by average total assets:
Key Equation
The average total assets amount is found by adding together total assets at the end of the current year and previous year (2010 and 2009 for this example) and dividing by two. The return on assets ratio for Coca-Cola for 2010 is calculated as follows, with PepsiCo and industry average information following it:
| Coca-Cola 2010 | Coca-Cola 2009 | PepsiCo 2010 | Industry Average 2010 | |
| Return on assets | 19.4 percent | 15.3 percent | 11.7 percent | 14.2 percent |
The return on assets ratio indicates Coca-Cola generated 19.4 cents in net income for every dollar in average assets. This ratio increased from 2009 to 2010 and is higher than PepsiCo’s 11.7 percent. Coca-Cola exceeded the industry average of 14.2 percent.
(Note: There are several variations on the return on assets calculation. Some prefer to use average operating assets in the denominator. Others adjust net income in the numerator by adding back interest expense net of the interest expense tax benefit. We leave these variations to advanced cost and intermediate accounting textbooks.)
Return on Common Shareholders’ Equity
Question: How is the return on common shareholders’ equity ratio calculated, and what does it tell us about Coca-Cola relative to PepsiCo and the industry average?
Answer: Common shareholders are interested in the return on common shareholders’ equity ratio because this ratio tells them how much net income was generated from each dollar of common shareholders’ equity. The return on common shareholders’ equity ratio is calculated as follows:
Key Equation
Note that preferred dividends are deducted from net income in the numerator. If the company does not have any outstanding preferred stock, as is the case with Coca-Cola, the preferred dividends amount is zero.
Average common shareholders’ equity in the denominator is found by adding together all items in the shareholders’ equity section of the balance sheet at the end of the current year and previous year (2010 and 2009 for this example), except preferred stock items, and dividing by two.
Because Coca-Cola does not have preferred stock, an average of all items in the shareholders’ equity section is in the denominator. The return on common shareholders’ equity ratio for Coca-Cola for 2010 is calculated as follows, with PepsiCo and industry average information following it:
| Coca-Cola 2010 | Coca-Cola 2009 | PepsiCo 2010 | Industry Average 2010 | |
| Return on common shareholders’ equity | 41.7 percent | 29.5 percent | 32.3 percent | 34.7 percent |
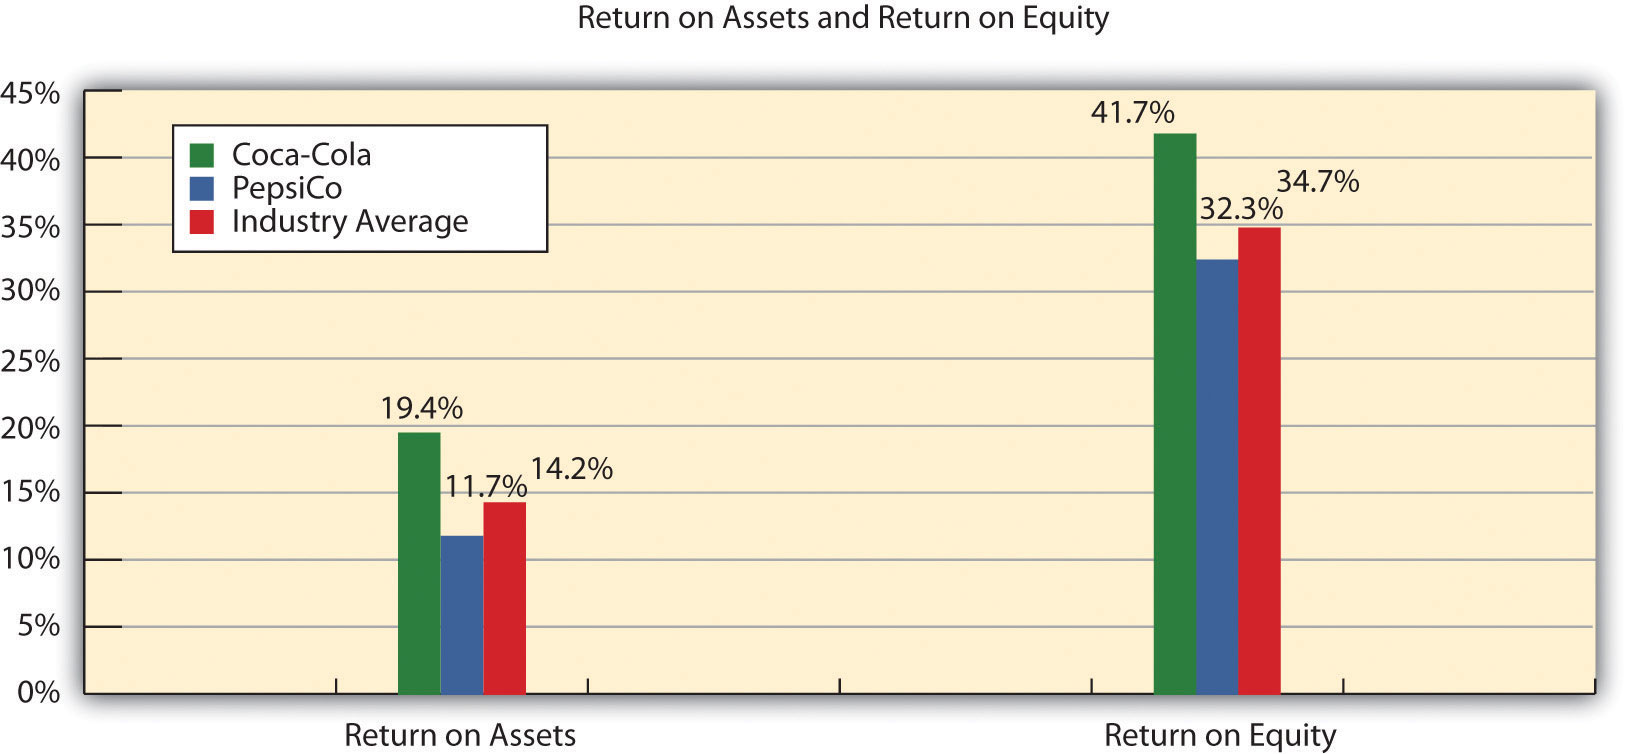
The return on common shareholders’ equity ratio indicates Coca-Cola generated 41.7 cents in net income for every dollar in average common shareholders’ equity. This ratio increased significantly from 2009 to 2010 and is higher than PepsiCo’s 32.3 percent. Coca-Cola exceeded the industry average of 34.7 percent.
Coca-Cola’s return on common shareholders’ equity of 41.7 percent is higher than its return on assets of 19.4 percent, indicating that the company has positive financial leverage. Financial leverage describes a company’s ability to leverage common shareholders’ equity by taking on debt at an interest rate lower than the company’s return on assets. For example, assume a company has equity of $10,000 earning 10 percent. The company can leverage this equity by borrowing $8,000 with a 6 percent interest rate. Assuming the company uses this $8,000 to purchase assets that earn 10 percent, the company has created positive financial leverage since the cost of borrowing is lower than the return on assets. This results in a return on equity that is higher than the return on assets. (Note: For a one-year period, the return on assets is $1,800 [= $18,000 × 10 percent] less the cost of debt of $480 [= 6 percent × $8,000], or $1,320. This results in a return on assets of 7.3 percent [= $1,320 ÷ $18,000]. Positive financial leverage causes the return on equity to be much higher at 13.2 percent [= $1,320 ÷ $10,000 equity].)
Although some level of financial leverage is generally regarded as healthy, companies that are highly leveraged tend to be riskier than similar companies with less leverage. Analysts and shareholders should avoid drawing quick conclusions that increases in return on common shareholders’ equity are always better than decreases without thoroughly reviewing the rest of the data.
Figure 13.9 shows the return on assets and return on equity for Coca-Cola, PepsiCo, and the industry average.
Figure 13.9 Return on Assets and Return on Equity for Coca-Cola, PepsiCo, and the Industry Average
Earnings per Share
Question: How is earnings per share calculated, and what does it tell us about Coca-Cola relative to PepsiCo and the industry average?
Answer: Earnings per share indicates how much net income was earned for each share of common stock outstanding. The earnings per share ratio states net income on a per share basis and is calculated as the following:
Key Equation
Note that preferred dividends are deducted from net income in the numerator. If the company does not have any outstanding preferred stock, as is the case with Coca-Cola, the preferred dividends amount is zero. The weighted average common shares outstanding amount used in the denominator is typically provided in the financial statements, either on the income statement or in the notes to the financial statements. (More advanced intermediate accounting textbooks discuss this calculation in detail. Throughout this chapter, we provide the number of weighted average common shares outstanding.)
Earnings per share for Coca-Cola using 2010 information is calculated as follows, with PepsiCo and industry average information following it (dollar amount and shares are in millions, except per share amount):
| Coca-Cola 2010 | Coca-Cola 2009 | PepsiCo 2010 | Industry Average 2010 | |
| Earnings per share | $5.12 | $2.95 | $3.97 | Not applicable |
The earnings per share amount at Coca-Cola indicates the company earned $5.12 for each share of common stock outstanding. This ratio increased from 2009 to 2010. Although earnings per share is useful for looking at trends over time within a company, it cannot be compared in any meaningful way from one company to another because different companies have different numbers of shares outstanding.
For example, assume two identical companies earn $10,000 for the year. One company has one share of common stock outstanding, and the other has two shares outstanding. Thus one company has earnings per share of $10,000 (= $10,000 ÷ 1 share) and the other company has earnings per share of $5,000 (= $10,000 ÷ 2 shares). The second company is not performing any worse; it simply has more shares outstanding. This is why you should not compare earnings per share across companies. (Alternative terms: Earnings per share are often called EPS or income per share.)
Business in Action 13.3

Source: Photo courtesy of DangApricot, http://commons.wikimedia.org/wiki/File:AnnTaylorLoftSign.JPG.
The Importance of Earnings per Share
The business press often uses earnings per share to announce a company’s earnings. For example, the Associated Press addressed earnings at AnnTaylor Stores Corporation, a retailer of women’s clothing, as follows: “Quarterly income fell to $7,100,000, or 10 cents per share, from $30,100,000, or 41 cents, the year before. Setting aside relocation costs, adjusted earnings were 18 cents per share, a penny higher than the average estimate from analysts polled by Thomson Financial.”
This quote demonstrates not only that earnings per share data are important when announcing a company’s earnings but also that analysts use these data when making predictions about a company’s performance. A quick perusal of any business publication, such as The Wall Street Journal, or a review of online business press releases at sites like finance.yahoo.com will confirm that earnings per share data are commonly used to announce a company’s financial results.
Source: Associated Press, “AnnTaylor’s 2Q Profit Plummets on Charge,” August 19, 2005.
REVIEW PROBLEM 13.3
Refer to the information presented in Note 13.10 "Review Problem 13.1" for PepsiCo, and perform the following for 2010:
- Calculate the gross margin ratio, and briefly describe what it means for PepsiCo.
- Calculate the profit margin ratio, and briefly describe what it means for PepsiCo.
- Calculate return on assets, and briefly describe what it means for PepsiCo.
- Calculate return on common shareholders’ equity, and briefly describe what it means for PepsiCo. Assume PepsiCo recorded preferred dividends of $6,000,000 in 2010.
- Calculate earnings per share, and briefly describe what it means for PepsiCo. Assume weighted average common shares outstanding totaled 1,590,000,000 shares.
Solutions to Review Problem 13.3
- For every dollar in net sales, PepsiCo generated 54.1 cents in gross margin.
- For every dollar in net sales, PepsiCo generated 10.9 cents in net income.
- For every dollar in average assets, PepsiCo generated 11.7 cents in net income.
- For every dollar in average common shareholders’ equity, PepsiCo generated 32.3 cents in net income (after deducting preferred dividends).
- For each common share outstanding, PepsiCo generated $3.97 in net income (after deducting preferred dividends).
Short-Term Liquidity Ratios
Question: Suppliers and other short-term lenders often want to evaluate whether companies can meet short-term obligations. What are the four common ratios used to evaluate short-term liquidity?
Answer: The four ratios used to evaluate short-term liquidity are as follows:
- Current ratio
- Quick ratio
- Receivables turnover ratio (often converted to average collection period)
- Inventory turnover ratio (often converted to average sale period)
Current Ratio
Question: How is the current ratio calculated, and what does it tell us about Coca-Cola relative to PepsiCo and the industry average?
Answer: The current ratio indicates whether a company has sufficient current assets to cover current liabilities. It is found by dividing current assets by current liabilities:
Key Equation
The current ratio for Coca-Cola for 2010 is calculated as follows, with PepsiCo and industry average information following it:
| Coca-Cola 2010 | Coca-Cola 2009 | PepsiCo 2010 | Industry Average 2010 | |
| Current ratio | 1.17 to 1 | 1.28 to 1 | 1.11 to 1 | 1.20 to 1 |
The current ratio indicates Coca-Cola had $1.17 in current assets for every dollar in current liabilities. This ratio decreased from 2009 to 2010 and is slightly higher than PepsiCo’s 1.11 to 1 ratio. Coca-Cola is close to the industry average of 1.20 to 1. In general, a current ratio above 1 to 1 is preferable, which indicates the company has sufficient current assets to cover current liabilities. However, finding the ideal minimum current ratio is dependent on many factors, such as the industry, the overall financial condition of the company, and the composition of the company’s current assets and current liabilities. Because of variations in these factors from one company to the next, a more stringent measure of short-term liquidity is often used. We present this measure, called the quick ratio, next.
Quick Ratio
Question: How is the quick ratio calculated, and what does it tell us about Coca-Cola relative to PepsiCo and the industry average?
Answer: The quick ratio (also called acid-test ratio) indicates whether a company has sufficient quick, or highly liquid, assets to cover current liabilities. The quick ratio is quick assets divided by current liabilities:
Key Equation
Notice the numerator excludes current assets that are not easily and quickly converted to cash. Although inventory is typically excluded from the numerator, further analysis is needed to evaluate whether inventory should be included. For example, grocery stores turn inventory over very quickly, typically within a couple of weeks, and should consider including inventory in the quick ratio. Producers of wine, on the other hand, turn inventory over very slowly, and should consider excluding inventory in the numerator of the quick ratio. For the sake of consistency, you should exclude inventory from the numerator in this chapter, unless told otherwise. (Note: Many companies provide two quick ratio calculations, one that includes inventory in the numerator and one that excludes inventory in the numerator. If two ratios are presented, it is important to label each ratio to indicate whether inventory has been included or excluded.)
It is helpful when reviewing a company’s balance sheet to remember that current assets are presented in order of liquidity, with the most liquid current asset appearing first and the least liquid appearing last. This helps in determining whether a particular current asset should be included or excluded in the numerator of the quick ratio. The quick ratio for Coca-Cola for 2010 is calculated as follows, with PepsiCo and industry average information following it:
| Coca-Cola 2010 | Coca-Cola 2009 | PepsiCo 2010 | Industry Average 2010 | |
| Quick ratio | 0.85 to 1 | 0.95 to 1 | 0.80 to 1 | 1.10 to 1 |
The quick ratio indicates Coca-Cola had $0.85 in quick assets for every dollar in current liabilities. This ratio decreased from 2009 to 2010 and is slightly higher than PepsiCo’s 0.80 to 1 ratio. Coca-Cola is below the industry average of 1.10 to 1.
Receivables Turnover Ratio
Question: How is the receivables turnover ratio calculated, and what does it tell us about Coca-Cola relative to PepsiCo and the industry average?
Answer: The receivables turnover ratio indicates how many times receivables are collected in a given period and is found by dividing credit sales by average accounts receivable:
Key Equation
Assume all net sales presented on the income statement are on account, and therefore will be used in the numerator. The average accounts receivable amount in the denominator is found by adding together accounts receivable at the end of the current year and previous year (2010 and 2009 for this example) and dividing by two. The receivables turnover ratio for Coca-Cola for 2010 is calculated as follows, with PepsiCo and industry average information following it:
| Coca-Cola 2010 | Coca-Cola 2009 | PepsiCo 2010 | Industry Average 2010 | |
| Receivables turnover ratio | 8.58 times | 9.05 times | 10.57 times | 9.70 times |
The receivables turnover ratio indicates Coca-Cola collected receivables 8.58 times during 2010. This ratio decreased from 2009 to 2010 and is lower than PepsiCo’s 10.57 times. Coca-Cola is below the industry average of 9.70 times.
Question: How is the receivables turnover ratio converted to average collection period?
Answer: The receivables turnover ratio can be converted to the average collection period, which indicates how many days it takes on average to collect on credit sales, as follows:
Key Equation
This ratio is typically compared to the company’s credit terms to evaluate how effectively receivables are being collected. The average collection period for Coca-Cola for 2010 is calculated as follows, with PepsiCo and industry average information following it:
| Coca-Cola 2010 | Coca-Cola 2009 | PepsiCo 2010 | Industry Average 2010 | |
| Average collection period | 42.54 days | 40.33 days | 34.53 days | 37.63 days |
The average collection period indicates Coca-Cola collected credit sales in 42.54 days, on average. The number of days increased slightly from 2009 to 2010 and is higher than PepsiCo’s 34.53 days. Coca-Cola is also above the industry average of 37.63 days and therefore is slower at collecting accounts receivable than the industry as a whole.
Inventory Turnover Ratio
Question: How is the inventory turnover ratio calculated, and what does it tell us about Coca-Cola relative to PepsiCo and the industry average?
Answer: The inventory turnover ratio indicates how many times inventory is sold and restocked in a given period. It is calculated as cost of goods sold divided by average inventory:
Key Equation
The average inventory amount in the denominator is found by adding together inventory at the end of the current year and previous year (2010 and 2009 for this example) and dividing by two. The inventory turnover ratio for Coca-Cola for 2010 is calculated as follows, with PepsiCo and industry average information following it:
| Coca-Cola 2010 | Coca-Cola 2009 | PepsiCo 2010 | Industry Average 2010 | |
| Inventory turnover ratio | 5.07 times | 4.88 times | 8.87 times | 7.50 times |
The inventory turnover ratio indicates Coca-Cola sold and restocked inventory 5.07 times during 2010. This ratio increased slightly from 2009 to 2010 and is substantially lower than PepsiCo’s 8.87 times. Coca-Cola is well below the industry average of 7.50 times.
Question: How is the inventory turnover ratio converted to average sale period?
Answer: The inventory turnover ratio can be converted to the average sale period, which indicates how many days it takes on average to sell the company’s inventory, as follows:
Key Equation
The average sale period for Coca-Cola for 2009 is calculated as follows, with PepsiCo and industry average information following it:
| Coca-Cola 2010 | Coca-Cola 2009 | PepsiCo 2010 | Industry Average 2010 | |
| Average sale period | 71.99 days | 74.80 days | 41.15 days | 48.67 days |
The average sale period indicates Coca-Cola sold its inventory in 71.99 days, on average. The number of days decreased from 2009 to 2010 and is substantially higher than PepsiCo’s 41.15 days. Coca-Cola is also above the industry average of 48.67 days and therefore is slower at selling inventory than the industry as a whole.
Business in Action 13.4

© Thinkstock
Industry Variations in Inventory and Receivable Turnover
Retail grocery stores turn inventory over every 22 days, meaning that shelves are emptied and restocked about every three weeks. In addition to extremely fast inventory turnover, retail grocery stores collect credit sales in seven days. Thus it takes 29 days, on average, to convert freshly stocked inventory to cash. Very few industries are able to convert inventory to cash as quickly. Examples of inventory and receivable turnover for several industries are shown in the following.
| Receivables Turnover | Inventory Turnover | |
| Auto manufacturers | 39 days | 41 days |
| Chemical manufacturing | 51 days | 61 days |
| Forestry and wood products | 46 days | 53 days |
| Computer systems | 78 days | 18 days |
Source: Industry averages found at MSN Money, Home Page,” http://moneycentral.msn.com.
REVIEW PROBLEM 13.4
Refer to the information presented in Note 13.10 "Review Problem 13.1" for PepsiCo, and perform the following requirements for 2010:
- Calculate the current ratio, and briefly describe what it means for PepsiCo.
- Calculate the quick ratio, and briefly describe what it means for PepsiCo.
- Calculate the receivables turnover ratio and average collection period, and briefly describe what these measures mean for PepsiCo. Assume all sales are on account.
- Calculate the inventory turnover ratio and average sale period, and briefly describe what these measures mean for PepsiCo.
Solution to Review Problem 13.4
- For every dollar in current liabilities, PepsiCo had $1.11 in current assets.
- For every dollar in current liabilities, PepsiCo had $0.80 in quick assets.
- PepsiCo collected receivables 10.57 times during 2010.
PepsiCo collected credit sales in 34.53 days, on average.
- PepsiCo sold and restocked inventory 8.87 times during 2010.
PepsiCo sold its inventory in 41.15 days, on average.
Long-Term Solvency Ratios
Question: Banks, bondholders, and other long-term lenders often want to evaluate whether companies can meet long-term obligations. What are the three common ratios used to evaluate long-term solvency?
Answer: The three ratios used to evaluate long-term solvency are as follows:
- Debt to assets
- Debt to equity
- Times interest earned
Debt to Assets
Question: How is the debt to assets ratio calculated, and what does it tell us about Coca-Cola relative to PepsiCo and the industry average?
Answer: The debt to assets ratio indicates the percentage of assets funded by creditors and is used to evaluate the financial leverage of a company. Debt to assets is found by dividing total liabilities by total assets:
Key Equation
The higher the percentage, the higher the financial leverage. The debt to assets ratio for Coca-Cola for 2010 is calculated as follows, with PepsiCo and industry average information following it:
| Coca-Cola 2010 | Coca-Cola 2009 | PepsiCo 2010 | Industry Average 2010 | |
| Debt to assets | 0.57 to 1 | 0.48 to 1 | 0.68 to 1 | 0.48 to 1 |
The debt to assets ratio indicates that creditors funded 57 percent of Coca-Cola’s assets at the end of 2010. This ratio increased from 2009 to 2010 and is lower than PepsiCo’s 0.68 to 1. Coca-Cola is higher than the industry average of 0.48 to 1.
A review of the basic balance sheet equation shows that the complement of the debt to assets ratio provides the percentage of assets funded by shareholders. Thus for every dollar Coca-Cola has in assets, creditors fund $0.57 and shareholders fund $0.43 (= $1 – $0.57):
The debt to assets ratio reveals Coca-Cola (0.57 to 1) and PepsiCo (0.68 to 1) are more highly leveraged than the industry average of 0.48 to 1.
Debt to Equity
Question: How is the debt to assets ratio calculated, and what does it tell us about Coca-Cola relative to PepsiCo and the industry average?
Answer: A variation of the debt to assets ratio is the debt to equity ratio, which measures the balance of liabilities and shareholders’ equity used to fund assets. The debt to equity ratio is total liabilities divided by total shareholders’ equity:
Key Equation
This ratio indicates the amount of debt incurred for each dollar that owners provide. The debt to equity ratio for Coca-Cola for 2010 is calculated as follows, with PepsiCo and industry average information following it:
| Coca-Cola 2010 | Coca-Cola 2009 | PepsiCo 2010 | Industry Average 2010 | |
| Debt to equity | 1.33 to 1 | 0.92 to 1 | 2.17 to 1 | 0.94 to 1 |
The debt to equity ratio indicates that Coca-Cola had $1.33 in liabilities for each dollar in shareholders’ equity. This ratio increased from 2009 to 2010 and is substantially lower than PepsiCo’s 2.17 to 1. However, Coca-Cola is higher than the industry average of 0.94 to 1.
Business in Action 13.5

Source: Photo courtesy of spechtenhauser, http://www.flickr.com/photos/usinside/2931437356/.
Financial Leverage at General Motors and Toyota
Prior to the company’s bankruptcy filing in 2009, General Motors (GM) was the largest manufacturer of automobiles and trucks in the world (ranked by revenues). However, GM took on substantial amounts of debt over several years. With an average debt to equity ratio of 2.5 to 1, the automobile industry is relatively highly leveraged, but GM’s ratio was substantially higher at 11.3 to 1. This means that GM had $11.30 in debt for every $1 in shareholders’ equity.
Toyota Motor Corporation, on the other hand, was not highly leveraged; it had a debt to equity ratio of 1 to 1. Thus Toyota had $1 in debt for every $1 in shareholders’ equity. It is important to review other financial ratios before concluding that Toyota was in better financial shape than GM, but the fact that GM was much more highly leveraged than Toyota likely played a big role in GM’s downfall!
Source: Industry averages found at MSN Money, Home Page,” http://moneycentral.msn.com and Yahoo! Finance, “Home Page,” biz.yahoo.com.
Times Interest Earned
Question: How is times interest earned calculated, and what does it tell us about Coca-Cola relative to PepsiCo and the industry average?
Answer: The times interest earned ratio (also called interest coverage ratio) measures the company’s ability to cover its interest expense related to long-term debt with current period earnings. The times interest earned ratio is net income before income tax expense and interest expense divided by interest expense:
Key Equation
Notice that income tax expense and interest expense are added back in the numerator to find net income available to cover interest expense. The times interest earned ratio for Coca-Cola for 2010 is calculated as follows, with PepsiCo and industry average information following it:
| Coca-Cola 2010 | Coca-Cola 2009 | PepsiCo 2010 | Industry Average 2010 | |
| Times interest earned | 20.36 times | 25.97 times | 10.10 times | 10.70 times |
The times interest earned ratio indicates Coca-Cola had earnings to cover interest expense 20.36 times. This ratio decreased from 2009 to 2010 and is much higher than PepsiCo’s 10.10 times. Coca-Cola is also higher than the industry average of 10.70 times. It appears that Coca-Cola has plenty of earnings to cover interest expense.
REVIEW PROBLEM 13.5
Refer to the information presented in Note 13.10 "Review Problem 13.1" for PepsiCo, and perform the following requirements for 2010:
- Calculate the debt to assets ratio, and briefly describe what it means for PepsiCo.
- Calculate the debt to equity ratio, and briefly describe what it means for PepsiCo.
- Calculate the times interest earned ratio, and briefly describe what it means for PepsiCo.
Solution to Review Problem 13.5
- Creditors funded 68 percent of PepsiCo’s assets. Owners funded the remaining 32 percent.
- For every dollar in shareholders’ equity, PepsiCo had $2.17 in liabilities.
- PepsiCo had earnings to cover interest expense 10.10 times.
Market Valuation Measures
Question: Existing and potential shareholders are often interested in a company’s market value. What are the two common measures used to evaluate market value?
Answer: The two measures used to determine and evaluate the market value of a company are as follows:
- Market capitalization
- Price-earnings ratio
Market Capitalization
Question: How is market capitalization calculated, and what does it tell us about Coca-Cola relative to PepsiCo and the industry average?
Answer: Market capitalization (also called market cap) measures the value of a company at a point in time. It is determined by multiplying market price per share times the number of shares outstanding:
Key Equation
Market capitalization = Market price per share × Number of shares outstanding
Coca-Cola’s market capitalization for 2010 is calculated as follows, with PepsiCo information following it. The number of shares outstanding at Coca-Cola’s fiscal year ended December 31, 2010, totaled 2,292,000,000 (= 3,520,000,000 shares issued – 1,228,000,000 treasury shares). The market price per share at that time was $63.92.
Market capitalization = $63.92 per share × 2,292,000,000 shares = $146,500,000,000
| Coca-Cola 2010 | Coca-Cola 2009 | PepsiCo 2010 | Industry Average 2010 | |
| Market capitalization | $146,500,000,000 | $123,200,000,000 | $100,700,000,000 | $87,500,000,000 |
Coca-Cola’s market capitalization indicates that the company’s shares outstanding had a market value totaling $146,500,000,000 at the end of 2010. This amount increased significantly from 2009 to 2010 and is higher than PepsiCo’s $100,700,000,000. Both Coca-Cola and PepsiCo are above the industry average of $87,500,000.
(Note that the number of shares outstanding is typically found in the shareholders’ equity section of the balance sheet or in the notes to the financial statements. We provide the number of shares outstanding throughout this chapter, unless noted otherwise. This number is different than the weighted average shares outstanding used to calculate earnings per share earlier in the chapter. Also note that the price per share amount is from Yahoo’s finance Web site at finance.yahoo.com. We provide this information throughout the chapter, unless noted otherwise.)
Looking at a company’s market capitalization is a quick way of gauging its aggregate value. But what does a number like Coca-Cola’s $146,500,000,000 market capitalization really tell us about how a company compares to others? Note 13.54 "Business in Action 13.6" has the answer.
Business in Action 13.6
Three Categories of Market Capitalization
Most investors refer to market capitalization as market cap. Companies are typically classified into one of three market cap categories: small-cap, midcap, and large-cap. In general, small-cap companies have a market value of less than $1,000,000,000, midcap companies have a market value between $1,000,000,000 and $12,000,000,000, and large-cap companies have a market value greater than $12,000,000,000.
Thus small-cap mutual funds are stock funds that invest in companies with a market value of less than $1,000,000,000. Midcap mutual funds are stock funds that invest in companies with a market value between $1,000,000,000 and $12,000,000,000, and so on. These categories are important to investors because the stocks of small-cap companies tend to be more volatile than those of mid- or large-cap companies.
Source: Definitions are from the Web site of Vanguard, one of the world’s largest investment management firms (http://www.vanguard.com).
Price-Earnings Ratio
Question: How is the price-earnings ratio calculated, and what does it tell us about Coca-Cola relative to PepsiCo and the industry average?
Answer: The price-earnings ratio (also called P/E ratio) measures the premium investors are willing to pay for shares of stock relative to the company’s earnings. The price-earnings ratio is found by dividing market price per share by earnings per share:
Key Equation
In general, a relatively high price-earnings ratio indicates investors expect favorable future earnings, whereas a relatively low price-earnings ratio indicates investors expect moderate future earnings. The price-earnings ratio for Coca-Cola for 2010 is calculated as follows, with PepsiCo and industry average information following it. The market price information was given in the market capitalization example, and we calculated earnings per share earlier in the chapter.
| Coca-Cola 2010 | Coca-Cola 2009 | PepsiCo 2010 | Industry Average 2010 | |
| Price-earnings ratio | 12.48 times | 18.21 times | 16.04 times | 14.60 times |
The price-earnings ratio indicates investors were willing to pay 12.48 times the earnings for Coca-Cola’s stock. This ratio decreased from 2009 to 2010 and is lower than PepsiCo’s 16.04 times. Coca-Cola is also lower than the industry average of 14.60 times.
Key Takeaway
- Shareholders, creditors, and analysts often evaluate a company’s profitability. Five ratios used to evaluate profitability are the gross margin ratio, the profit margin ratio, return on assets, return on common shareholders’ equity, and earnings per share. Suppliers and other short-term creditors often evaluate whether a company can meet short-term obligations. Four ratios used to evaluate short-term liquidity are the current ratio, the quick ratio, the receivables turnover ratio (often converted to average collection period), and the inventory turnover ratio (often converted to average sale period). Banks, bondholders, and other long-term lenders often evaluate whether companies can meet long-term obligations. Three ratios used to evaluate long-term solvency are debt to assets, debt to equity, and times interest earned. Shareholders are particularly interested in a company’s market value. Two measures used to determine and evaluate the market value of a company are market capitalization and the price-earnings ratio.
REVIEW PROBLEM 13.6
Perform the following requirements for PepsiCo for 2010:
- Calculate the market capitalization, and briefly describe what it means for PepsiCo. Assume PepsiCo had 1,581,000,000 shares outstanding at the end of 2010, and the market price per share was $63.68.
- Calculate the price-earnings ratio, and briefly describe what it means for PepsiCo. (Hint: Earnings per share was calculated for PepsiCo in Note 13.29 "Review Problem 13.3".)
Solution to Review Problem 13.6
- PepsiCo’s shares outstanding had a market value of $100,700,000,000 at the end of 2010.
- Investors were willing to pay 16.04 times earnings for PepsiCo’s stock.